Anisa Larasati![]() | Zainal Arifin*
| Zainal Arifin*![]() | Dominicus Danardono Dwi Prija Tjahjana
| Dominicus Danardono Dwi Prija Tjahjana![]() | Singgih Dwi Prasetyo
| Singgih Dwi Prasetyo![]()
© 2025 The authors. This article is published by IIETA and is licensed under the CC BY 4.0 license (http://creativecommons.org/licenses/by/4.0/).
OPEN ACCESS
The increasing integration of hybrid renewable energy systems, such as photovoltaic-Savonius systems, provides an innovative solution to mitigate climate change by reducing pollutant emissions. This study hypothesizes that a triangular deflector installed between the solar photovoltaic and the Savonius turbine can cool the operating temperature of the solar photovoltaic while enhancing the turbine's power coefficient (Cp). This research investigates the effects of deflector width, angle, and distance with three levels for each variable on turbine performance and PV cooling efficiency. The deflector, made of acrylic glass, has dimensions based on the turbine's diameter and radius. Experiments were conducted indoors using halogen lamps as solar simulators with an intensity of 1000 W/m², and 3×3 blowers supplied wind at a speed of 4.5 m/s. Using Design of Experiment (DOE) Full Factorial 33 allowed for 27 run experiments to capture all possible interactions between variables, which will then be analyzed using Analysis of Variance (ANOVA) to confirm that deflector width was the most significant factor influencing system performance, followed by angle and distance. Using the optimal configuration 1/1D width, 75° angle, 1.40/1r distance) increased PV efficiency by 6.18% and the turbine power coefficient by 40.37%, supporting further development of sustainable energy technologies.
hybrid system, renewable energy, Savonius helix wind turbine, solar photovoltaic, triangular deflector, vertical axis wind turbine
Using renewable energy sources is a solution to reduce the negative impacts of burning fossil fuels because it does not emit pollutants that cause climate change and the greenhouse effect. However, the use of renewable energy tends to be expensive and uneconomical. Recently, with the decline in the cost of wind and solar power, interest in clean energy technology has increased drastically [1]. The hybrid wind-solar photovoltaic (PV) system has become a global trend due to its complementary energy production characteristics [2]. Several studies have explored hybrid wind-solar PV systems using various models, such as tree-like branching wind-solar PV designs, integrating solar PV panels with blades on vertical axis wind turbines, and using solar PV as a wind direction guide for wind turbines [3-5].
The increasing integration of hybrid renewable energy systems, such as PV-Savonius systems, provides an innovative solution to mitigate climate change by reducing pollutant emissions. Previous studies have focused on improving the efficiency and conducting economic analyses of hybrid systems [6]. However, the efficiency of these systems can be compromised due to the operating temperature of solar PV panels, which decreases by up to 0.5% for every 1°C rise above the standard [7, 8]. This implies that in hot regions or during periods of high solar irradiance, solar panels may produce less energy than their optimal potential due to temperature increases [9]. Further research is needed to explore the potential of utilizing wind from turbines as a cooling mechanism for solar PV panels, maintaining their operating temperature within an optimal range and enhancing both solar PV efficiency and wind turbine performance simultaneously.
In wind-solar PV integration, a Savonius-type Vertical Axis Wind Turbine (VAWT) is adopted because it is capable of capturing wind from all directions [10]. Additional components, such as deflectors, are required to enhance the cooling of the solar PV panels while simultaneously optimizing the performance of the Savonius turbine. His opportunity arises from the need to maintain the temperature of the PV panels by generating turbulent airflow [11]. Turbulent airflow is known to improve wind turbine efficiency [12]. One method to induce turbulence is by adding deflectors, which act as wind barriers while also directing the airflow [13].
A deflector is a passive cooling device that directs airflow toward the turbine, significantly impacting its performance [14]. Research conducted by Qasemi and Azadani [15] analyzed the deflector's width, angle, and distance with random values to determine the optimal parameters. The results indicated that the best configuration includes a deflector width of 4/3 of the turbine height, an inclination angle of either 0° or 90°, and a distance of ½ the turbine’s diameter. According to the conclusions of Fatahian et al. [16], when employing a dual-rotor avionics design, the deflector's distance from the turbine is the most influential parameter, accounting for a 16.54% impact, following the rotor distance parameter. Prior studies by Layeghmand et al. [17] have explored various deflector geometries to address this issue and improve wind turbine performance. For instance, an airfoil-shaped deflector with an angle of 70° and placed at a distance of 1.20/D from the airfoil shape significantly enhanced the turbine's performance, resulting in a 50% increase in the power coefficient (Cp). Additionally, research by Kuncoro et al. [10] Stated that the width of a flat deflector could influence up to 90% of the performance of a helical Savonius vertical axis wind turbine. Another study by Jiang et al. [18] employed a diamond-shaped deflector, achieving an overall power increase of over 35% when positioned between two H-rotor turbines.
Despite these advancements, the specific application of triangular deflectors remains underexplored. This study distinguishes itself by analyzing the effects of triangular deflectors, which direct turbulent airflow to cool solar PV panels and enhance turbine performance. Findings are expected to offer insights into the deflector’s impact on wind turbine performance and potential for future hybrid applications.
2.1 Geometry of VAWT Savonius helix and solar panel
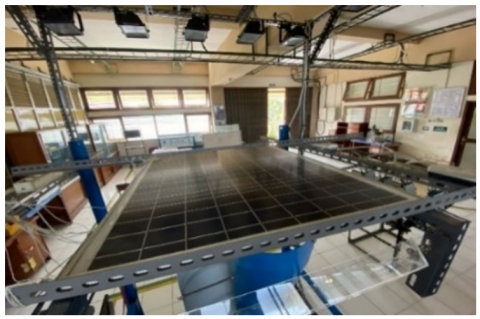
This study investigates the effects of a triangular-shaped deflector on the cooling performance of solar PV systems and the power coefficient (Cp) of Savonius turbines (Figure 1). The solar panels used are polycrystalline due to their widespread use and market dominance, ensuring the study’s findings apply to commonly available systems [19]. The wind turbine employed is a Savonius helix-type VAWT, which offers superior performance compared to conventional Savonius turbines [20]. This is due to the helix-type Savonius turbine rotor, which has multiple surface areas exposed to the wind at each rotational angle. This condition results in a continuous positive torque, providing better performance compared to conventional rotors [21].
Figure 1. Solar PV
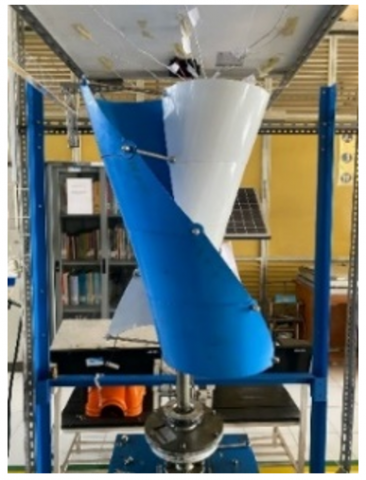
In this study, Yingli solar photovoltaic panels with a capacity of 50 Wp were used. The photovoltaic panel has a module efficiency of 14%, according to specifications. This panel is shown in Figure 2, while its complete characteristics are presented in Table 1. The panel was used in this study. The wind turbine used is a type of Savonius helix, as shown in Figure 2, with the dimension in Table 2. The turbine uses an aluminum alloy plate with a thickness of 1 mm.
Table 1. Solar PV parameters
|
Parameter |
Value |
|
Module name |
YL050P-17b 1/3 |
|
Module efficiency |
14% |
|
Power output |
50W |
|
Width - W |
54 cm |
|
Length - L |
66 cm |
|
Thickness |
3 cm |
Table 2. VAWT Savonius helix parameters
|
Parameter |
Value |
|
Start-up wind speed |
2.5 m/s |
|
Cut-in wind speed |
3.5 m/s |
|
Turbine radius (r) |
24 cm |
|
Turbine diameter |
48 cm |
|
Turbine height |
62 cm |
|
Height ratio: diameter |
1:1 |
Figure 2. Savonius helix
2.2 Savonius helix turbine performance parameters
The performance of Savonius turbines can be enhanced through precise modifications of rotor geometry or by using deflectors to protect turbine blades from the adverse effects of back-torque, a phenomenon referred to as curtaining [22].
The potential wind energy that can be harnessed with Savonius turbines can be calculated using the following formula:
$Pavaible=\frac{1}{2} \rho A V^3$ (1)
$Tavaible=\frac{1}{2}\rho A{{V}^{2}}R$ (2)
Meanwhile, power and power coefficient can be calculated using the following formulas:
$Pturbine=T\times {{\omega }_{s}}=\frac{2\pi NT}{60}$ (3)
$Cp=\frac{Pturbine}{Pavaible}$ (4)
$Tturbine=F\times r$ (5)
${{C}_{T}}=\frac{Tturbine}{Tavaible}$ (6)
${{C}_{p}}={{C}_{T}}~\times TSR$ (7)
$\lambda =\frac{{{V}_{Rotor}}}{V}=\frac{\omega R}{V}$ (8)
2.3 Solar panel performance parameters
Solar panels have several indicators used to assess the efficiency and effectiveness of the system in converting solar energy into electrical energy. Key parameters for evaluating solar panel performance are described as follows [23]:
The output power (P) of a PV module is determined from the voltage (V) and current (I) values using the following equation:
$P=VI$ (9)
To calculate the efficiency (η) of the panel module, the output power, and the incident solar radiation data, I(t), are used in Eq. (2) as shown below:
$\eta =~\frac{P}{A.I\left( t \right)}$ (10)
It shows that A is the area of the panel module and I(t) is the incident solar radiation or irradiance.
In solar panel measurements, a key parameter known as the fill factor (FF) represents the ratio between the maximum power (Pmax) that the module can produce at its maximum power point and the product of the open-circuit voltage (Voc) and short-circuit current (Isc).
$F=\frac{{{P}_{max}}}{{{I}_{SC}}\times {{V}_{OC}}}=\frac{{{I}_{max}}\times {{V}_{max}}}{{{I}_{SC}}\times {{V}_{OC}}}$ (11)
where, ${{P}_{max}}$ is the maximum power generated at the maximum power point, ${{V}_{max}}$ dan ${{I}_{max}}$ are the voltage and current at the maximum power point. Meanwhile, ${{V}_{oc}}$ dan ${{I}_{sc}}$ refer to the open-circuit voltage (the maximum voltage when the current is zero) and the short-circuit current (the maximum current when the voltage is zero).
2.4 Lab test equipment and setup
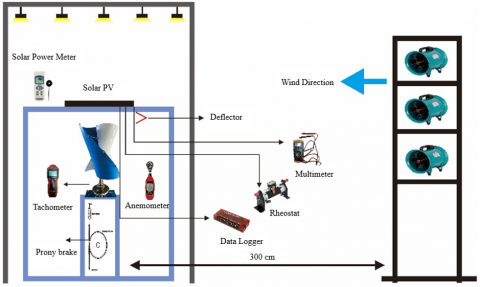
In this study illustrated in Figure 3, the sunlight as the primary energy source was replaced with 20 halogen lamps, each rated at 500 Watts, spaced at 37.5 cm intervals. The position of the lamps with solar PV spanned 75 cm and utilized an effective area of 16%, as in previous research [14]. The radiation from the lamp reached 1000 W/m2 and remained constant throughout all tests. The power output from the solar PV was measured using multimeters, with load variations controlled by a rheostat. Wind, as the primary turbine energy source, was also simulated using 3×3 blower fans arranged in a 3×3 configuration to achieve a uniform wind speed of 4.5 m/s, in line with the average wind speed that can be considered a wind resource in Indonesia [24]. The distance between the fan and the turbine is 300 cm, providing sufficient space for the airflow to reach the turbine. Working temperature measurements were recorded using a Labjack U6Pro, with 9 thermocouple sensors placed on the underside of the panel to monitor heat distribution.
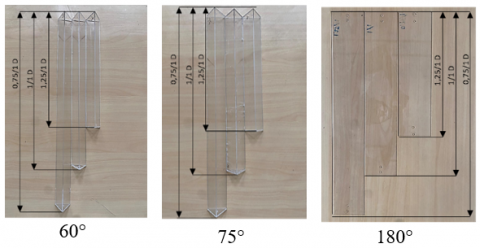
As shown in Figure 4, the deflector, made of acrylic glass, was selected for its lightweight, durable, and transparent properties, ensuring minimal interference with light reaching the PV panel. In addition, this material is easy to shape according to the deflector configuration. The deflector's dimensions were based on previous research and adapted to align with the turbine's diameter (D) and radius (r).
Figure 3. Experimental research layout
Figure 4. Deflector configuration
Figure 5. Deflector position
Table 3. Deflector parameters
|
Deflector Parameters |
Level |
||
|
1 |
2 |
3 |
|
|
Width ($w$) |
0.75/1 D |
1/1 D |
1.25/1 D |
|
Angle ($\alpha$) |
180° |
75° |
60° |
|
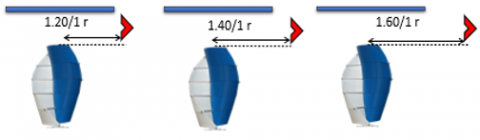
Distance ($x$) |
1.20/1 r |
1.40/1 r |
1.60/1 r |
The width (w) of the deflector is chosen based on the ratio to the turbine diameter to optimize the wind flow to the turbine. A width of 0.75/1 D results in a more focused but restricted flow, while 1.25/1 D can create additional drag. A width of 1/1 D is predicted to provide the best balance between wind flow concentration and minimal drag, increasing Cp by 90% [14]. A deflector angle (α) of 75° was shown in a previous study to provide a significant increase in Cp over an angle of 60°, which tends to cause flow separation, or 180°, which results in stagnation [17]. This angle will result in even pressure distribution, increased turbine rotation, and PV cooling efficiency. The distance (x) of the deflector to the turbine axis (r) is also essential for regulating wind speed and direction. A distance of 1.20/1 r can trigger excessive turbulence, while 1.60/1 r reduces wind intensity. An optimal distance of 1.40/1 r is chosen to ensure the wind reaches the rotor at maximum speed, increasing the Cp and efficiency of the PV [16, 18].
Triangular deflectors were positioned between the solar PV and the Savonius wind turbine with three different distance variations from the turbine center along the x-axis, as shown in Figure 5 and detailed in Table 3. The deflectors were positioned to optimize the wind speed near the rotor and minimize turbulence, aiming to determine the optimal distance to maximize the turbine Cp and PV cooling efficiency.
3.1 Experiment data
Data collection begins after the turbine operates for 300 seconds, ensuring the initial rotational stability. Table 4 summarizes the 27 variations from Table 3, which were evaluated using a 33 multifactorial design experiment and ANOVA analysis. Using a blower as a wind source may induce air turbulence, affecting the final testing results. To ensure consistency, the experimental setup followed the same methodology outlined in the studies of Wong et al. and Kuncoro et al. [10, 14]. In this experiment, a Prony brake was paired with weights adjusted according to the study by Tjahjana et al. [25] to systematically analyze the relationships between various factors and levels.
Table 4. Experiment data collection
|
No. Run |
w |
α |
x |
Average PV Temperature (℃) |
Eff |
Cp |
|
Bare turbine |
43.08 |
13.58% |
0.15568 |
|||
|
26 |
0.75/1 |
180° |
1.20/1 |
41.465 |
13.78% |
0.13185 |
|
4 |
1/1 |
180° |
1.20/1 |
40.578 |
14.03% |
0.11964 |
|
3 |
1.25/1 |
180° |
1.20/1 |
41.617 |
13.89% |
0.11996 |
|
13 |
0.75/1 |
75° |
1.20/1 |
40.395 |
14.06% |
0.12309 |
|
22 |
1/1 |
75° |
1.20/1 |
38.514 |
14.32% |
0.20554 |
|
6 |
1.25/1 |
75° |
1.20/1 |
41.516 |
13.90% |
0.13919 |
|
24 |
0.75/1 |
60° |
1.20/1 |
42.817 |
13.78% |
0.13965 |
|
18 |
1/1 |
60° |
1.20/1 |
41.226 |
13.94% |
0.17137 |
|
2 |
1.25/1 |
60° |
1.20/1 |
42.851 |
13.75% |
0.14669 |
|
1 |
0.75/1 |
180° |
1.40/1 |
42.698 |
13.73% |
0.13156 |
|
23 |
1/1 |
180° |
1.40/1 |
42.137 |
13.96% |
0.12234 |
|
5 |
1.25/1 |
180° |
1.40/1 |
42.674 |
13.86% |
0.11580 |
|
21 |
0.75/1 |
75° |
1.40/1 |
41.154 |
13.95% |
0.15551 |
|
10 |
1/1 |
75° |
1.40/1 |
37.743 |
14.42% |
0.21862 |
|
27 |
1.25/1 |
75° |
1.40/1 |
41.534 |
13.90% |
0.16056 |
|
14 |
0.75/1 |
60° |
1.40/1 |
42.460 |
13.77% |
0.13495 |
|
15 |
1/1 |
60° |
1.40/1 |
40.371 |
14.05% |
0.18474 |
|
19 |
1.25/1 |
60° |
1.40/1 |
42.605 |
13.75% |
0.14337 |
|
25 |
0.75/1 |
180° |
1.60/1 |
41.673 |
13.74% |
0.12681 |
|
11 |
1/1 |
180° |
1.60/1 |
41.348 |
13.92% |
0.15238 |
|
8 |
1.25/1 |
180° |
1.60/1 |
41.922 |
13.84% |
0.12790 |
|
17 |
0.75/1 |
75° |
1.60/1 |
41.021 |
13.89% |
0.12554 |
|
7 |
1/1 |
75° |
1.60/1 |
39.936 |
14.12% |
0.19700 |
|
9 |
1.25/1 |
75° |
1.60/1 |
41.657 |
13.88% |
0.13217 |
|
20 |
0.75/1 |
60° |
1.60/1 |
42.738 |
13.73% |
0.11280 |
|
16 |
1/1 |
60° |
1.60/1 |
42.028 |
13.83% |
0.13669 |
|
12 |
1.25/1 |
60° |
1.60/1 |
42.735 |
13.73% |
0.13912 |
This study recognizes limitations, including uncontrolled air turbulence and constraints of using a Prony brake for torque measurement, which does not capture the system's full dynamics. Despite this, the approach enhances understanding of factors influencing turbine performance in cooling solar panel temperatures.
Table 3 shows that a deflector configuration in run ratio no.10 has the highest efficiency (14.42%) and power coefficient (Cp: 0.218621), optimizing PV cooling and turbine performance. At the same time, the lowest efficiency is recorded at 13.73% at the run ratio in 1, 20, and 12.
3.2 The effect of deflector width on PV-Savonius turbine
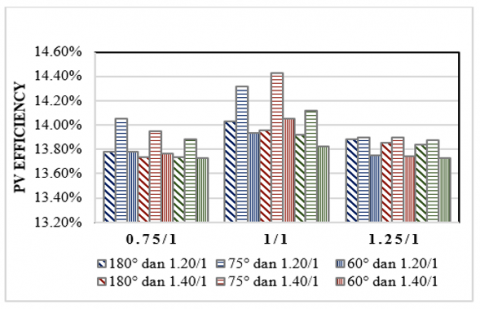
The results show that deflector width affects the PV-Savonius turbine, divided into two aspects: PV efficiency in percentage (%) and power coefficient (Cp) as a numerical value. Figures 6 and 7 have different deflector angle and deflector distance combinations to see how variations in deflector angle and distance influence overall system efficiency.
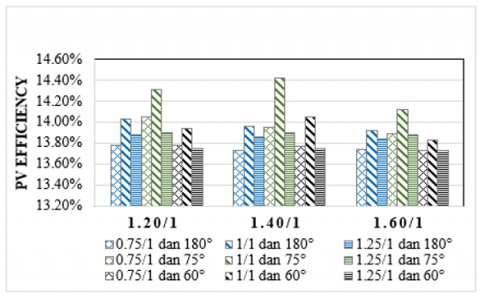
Figure 6. Effect of width deflector on solar PV
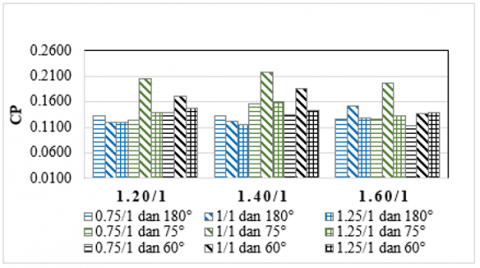
Figure 7. Effect of width deflector on Savonius turbine
The study indicates that the installed deflector width between the solar PV and wind turbine substantially impacts PV efficiency. A pattern of efficiency improvement is observed at a w=1/1 D, followed by a decline as the width increases further. The highest PV efficiency was achieved with the 1/1 D deflector across all combinations of angles and distances, showing a 0.59% improvement over the lowest efficiency recorded for this width. This improvement corresponds to reduced PV temperatures, starting at the 0.75/1 D ratio, peaking at 1/1 D, and declining at 1.25/1 D.
These trends can be explained by airflow dynamics around the turbine and its effect on PV cooling. At 1/1 D, the deflector enhances airflow velocity toward the turbine while preventing airflow stagnation near the PV surface, optimizing cooling. Conversely, narrower deflectors (0.75/1 D) restrict airflow into the rotor, while wider deflectors (1.25/1 D) increase the drag on the returning blade, reducing efficiency. These findings align with previous studies, which suggest that an optimal deflector width maximizes wind capture efficiency by reducing turbulence and drag effects [15].
For turbine performance, Figure 7 shows that deflector widths of 0.75/1 D and 1.25/1 D result in minimal improvements in Cp, with maximum values of 0.15551 (-0.11%) and 0.16056 (3.13%), respectively, compared to the bare turbine. In contrast, the 1/1 D width achieves a Cp of 0.21862, a 40.37% improvement over the bare turbine. This improvement demonstrates that an optimally sized deflector facilitates better airflow direction into the rotor, enhancing turbine efficiency. The performance decreased at w=1.25/1 D can be attributed to excessive drag caused by the deflector on the returning blade, validating findings in similar experimental setups [20].
The control condition in this study, represented by the bare turbine without any deflector, serves as the baseline for comparison. The addition of $w$=1/1 D deflector resulted in the most significant improvements, highlighting its role in optimizing system performance. These results confirm prior research on the impact of deflector width on turbine efficiency but also underline the importance of balancing deflector width to minimize drag and maximize airflow optimization.
3.3 The effect of deflector angle on PV-Savonius turbine
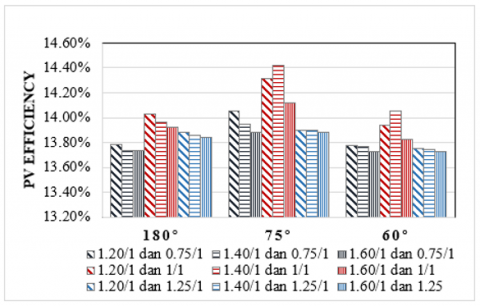
Based on the results in Figure 8, the deflector angle significantly impacts solar PV efficiency. The study categorizes efficiency outcomes based on deflector angle ratios, with the 75° angle achieving the highest efficiency enhancement while the 60° angle results in the lowest. Specifically, the 75° deflector angle combined with w=1/1 D and x=1.40/1 r yields a PV efficiency of 14.42% and a reduced panel temperature of 37.743℃. This corresponds to a temperature reduction of 6.058℃ (13.83%) compared to the bare turbine condition. Conversely, the 60° deflector angle with w=0.75/1 D and x=1.25/1 r results in the highest temperature of 42.851℃, which is only 0.950℃ (2.17%) higher than the bare temperature without a deflector.
Figure 8. Effect of ratio angle deflector on solar PV
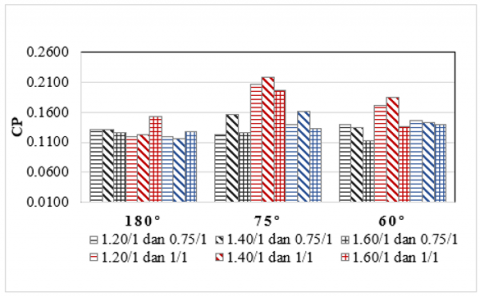
Figure 9. Effect of ratio angle deflector on Savonius turbine
These results suggest that α=75° deflector angle optimizes airflow patterns around the PV panel, enhancing cooling by directing wind across the panel surface more effectively. The reduced temperatures likely stem from increased convective heat transfer at the optimal angle. At α=60°, however, the deflector's geometry likely limits airflow coverage, leading to less effective cooling. This aligns with prior studies emphasizing the role of deflector angles in improving airflow velocity and turbulence management to enhance cooling efficiency [16, 17]. The bare turbine condition serves as the baseline, highlighting that the significant temperature reduction and efficiency enhancement at α=75° demonstrate the critical role of deflector geometry in improving hybrid systems.
Figure 9 highlights the significant influence of deflector angles on the turbine power coefficient (Cp). At a 75° angle, the turbine achieves the highest Cp with a recorded speed of 112 rpm, reflecting a 21.74% increase from the bare turbine's maximum speed of 92 rpm. This optimal configuration, paired with w=1/1 D and x=1.40 r, enhances turbine performance. Conversely, the 180° deflector angle results in stagnation, with a maximum speed of 103 rpm, only a 12% improvement from the bare turbine.
The variation in performance stems from the deflector's influence on airflow and pressure distribution. At 75°, the deflector effectively channels airflow toward the turbine blades, increasing rotational speed and power output. In contrast, the 180° angle inefficiently redirects airflow, causing stagnation and reduced energy capture. These findings align with previous studies highlighting the critical role of deflector angles in minimizing drag and optimizing aerodynamic efficiency [18]. The comparison with the bare turbine condition emphasizes the effectiveness of the 75° configuration in enhancing both turbine and PV system performance.
3.4 The effect of deflector distance on PV-Savonius turbine
The findings show that the deflector distance from the turbine’s x-axis affects solar PV efficiency. As shown in Figure 10, a distance ratio of 1.40/1 r achieves the highest efficiency across all variations, while the lowest efficiency occurs at a distance ratio of 1.60/1 r. Efficiency declines under specific configurations, such as w=0.75/1 D paired with angles of 60° or 180°, suggesting that the interaction between $x$, $w$, and S is critical to system performance. Substantial efficiency improvements occur at x Ratio=1.20/1 r, 1.40/1 r, and 1.60/1 r when combined with a width of 1/1 D and a 75° angle, highlighting the importance of these specific parameter combinations.
The highest efficiency, 14.42%, is recorded at a distance ratio of 1.40/1 r, with a cooling temperature of 37.743℃. This represents a 6.058℃ (13.83%) reduction compared to the baseline condition without a deflector. Positioning the deflector closer to the turbine rotor, specifically at a distance of 1.40/1 r (33.6 cm from the turbine’s x-axis), optimizes airflow interaction, enhancing both cooling performance and turbine efficiency. These results are consistent with Figure 11, demonstrating how increasing deflector distance affects airflow patterns. Airflow is channeled effectively at specific distances, particularly 1.40/1 r, boosting the wind speed delivered to the turbine. This configuration achieves the highest Cp value of 0.21862, followed by 0.20554 at 1.20/1 r and 0.19700 at 1.60/1 r, all with a width of 1/1 D and a 75° angle.
The aerodynamic effects of deflector width, angle, and distance create varying airflow patterns, influencing turbine performance. At optimal combinations, airflow is well-directed and enhances energy capture, while in other cases, separation of airflow reduces Cp, as shown in several variations in Figure 11. These observations align with previous research suggesting that the positioning of deflectors directly impacts pressure distribution and the velocity profile of air approaching the turbine blades [10].
Comparing these results with the bare turbine, the deflector at x=1.40/1 r demonstrates its effectiveness in significantly improving PV cooling and turbine performance. This highlights the importance of optimizing deflector parameters. However, the effect of deflector distance is less significant than that of width and angle, which play a dominant role in enhancing system efficiency.
Figure 10. Effect of ratio distance deflector on solar PV
Figure 11. Effect of ratio distance deflector on Savonius turbine
3.5 ANOVA test
The ANOVA test evaluates each factor's impact on PV efficiency, determined by the difference between its maximum and minimum average values. A more significant difference indicates a higher influence on PV efficiency. The ANOVA analysis findings, which assess the impact of factors w, α, and × PV efficiency is shown in Table 5. The F-value for the factor w is 26.39, and the P-value is 2.4×10⁻⁶. The P-value is less than 0.05, suggesting that the factor w Significantly affects PV efficiency. A significant impact on PV efficiency is also demonstrated by factor α, which has a P-value of 1.06×10⁻⁵ and an F-value of 21.42. Like w, the P-value is less than 0.05, indicating that changes in α likewise substantially impact changes in PV efficiency. However, factor × has a P-value of 0.062 and a far lower F-value of 3.2. The impact of × On PV, efficiency is deemed negligible. This implies that variations in x Do not significantly impact changes in PV efficiency.
Table 6 in the analysis for Savonius shows that none of the three factors have a P-value of more than 0.05, which means that these three factors significantly influence the performance of Savonius turbines. Factor $w$ has an F-value of 12.86 and a P-value of 2.5×10⁻⁴. The α factor also shows an F-value of 11.51 and a P-value of 4.7×10⁻⁴, likewise with $x$, which has an F-value of 3.2 and a P-value of 0.030, still below 0.05. Since factor $x$ contributes 11% to improving turbine performance; it is inversely proportional to factor $x$. The solar PV analysis results only contribute 5%.
Table 5. ANOVA of PV efficiency
|
Source |
DF |
Adj SS |
Adj MS |
F-value |
P-value |
|
Width |
2 |
3.4×10⁻⁵ |
1.7×10⁻⁵ |
26.39 |
2.4×10⁻⁶ |
|
Angle |
2 |
2.7×10⁻⁵ |
1.4×10⁻⁵ |
21.42 |
1.06×10⁻⁵ |
|
Distance |
2 |
4×10⁻⁶ |
2×10⁻⁶ |
3.2 |
0.062 |
|
Error |
20 |
1.3×10⁻⁵ |
1×10⁻⁶ |
||
|
Total |
26 |
7.8×10⁻⁵ |
Table 6. ANOVA of Savonius turbine
|
Source |
DF |
Adj SS |
Adj MS |
F-value |
P-value |
|
Width |
2 |
9.5×10⁻³ |
4.7×10⁻³ |
12.86 |
2.5×10⁻⁴ |
|
Angle |
2 |
8.5×10⁻³ |
4.2×10⁻³ |
11.51 |
4.7×10⁻⁴ |
|
Distance |
2 |
3.1×10⁻³ |
1.5×10⁻³ |
4.2 |
0.030 |
|
Error |
20 |
7.4×10⁻³ |
3.7×10⁻⁴ |
||
|
Total |
26 |
2.8×10⁻² |
3.6 Optimum parameter
The study identifies the optimal deflector configuration that enhances hybrid system performance, including improved PV cooling for higher efficiency. Table 7 shows the contributions of factors w (deflector width), α (deflector angle), and x (deflector distance) to solar PV and Savonius turbine performance, which was calculated using ANOVA analysis. Factor w Has the most significant impact, contributing 44% to system efficiency and 33% to turbine performance. Factor α follows with 35% and 30%, respectively, while factor x Contributes only 5% to PV efficiency and 11% to turbine performance. Computations demonstrate high accuracy, with minimal errors of 0.0013% for PV and 0.0074% for the turbine. Overall, w and α dominate the variations, while x Has a minor influence.
Table 8 shows the optimum parameter compared to the bare turbine, which results in an efficiency of 14.42% and 0.218621 for the Cp turbine. It increased by 6.18% for PV efficiency and 40.37% for Cp turbines compared to the bare turbine. With the same type of turbine and PV but a different type of deflector, the maximum Cp value rise was 10.32% higher than in the prior study [10]. It can be seen that the installation of a triangular deflector improves Cp performance.
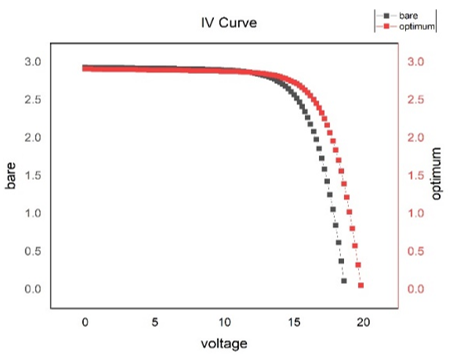
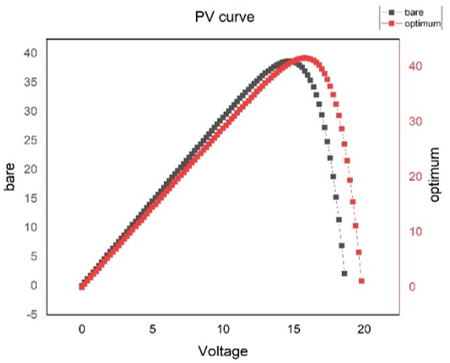
Figure 12 shows the IV curve, which shows the electrical characteristics under bare and optimal conditions, with voltage on the x-axis and current on the y-axis. The current difference between 0-5 V is small, but at 15-17 V, the optimal condition sustains a higher current before dropping, unlike the bare curve, which decreases more rapidly. These highlights improved power generation and efficiency under optimal conditions. Figure 12 also illustrates power variation with voltage under the same conditions. The optimal curve achieves a higher maximum power output and sustains it over a broader voltage range, demonstrating enhanced performance and efficiency through optimization.
Table 7. Contribution of each factor
|
Factor |
Distribution |
|
|
Solar PV |
Turbine |
|
|
w |
44% |
33% |
|
α |
35% |
30% |
|
x |
5% |
11% |
|
Error |
0.00130% |
0.74440% |
|
Total |
0.00780% |
2.87120% |
Table 8. Optimum parameter
|
Faktor |
Efficiency (%) |
Cp |
|
Bare |
13.58% |
0.155683 |
|
Optimum Level (10) |
14.42% |
0.218621 |
(a)
(b)
Figure 12. (a) IV curve and (b) PV curve
The effects of triangular deflectors on hybrid PV-Savonius turbine systems have been investigated. The study utilized a Design of Experiment 33, encompassing 27 experiments with three factors $w$ (deflector width), $\alpha$ (deflector angle), and Scriptx (deflector distance), each tested at three levels. The ANOVA analysis found that the deflector width is the most influential factor, with an F-value of 26.39. The order of effectiveness of the factors is as follows: $w>\alpha>x$. The optimal configuration, consisting of a width of 1/1 D turbine diameter, an angle of 75°, and a distance of 1.40 r turbine radius, resulted in the highest hybrid system performance, with a 6.18% increase in PV efficiency and a 40.37% improvement in turbine performance, as observed in the 14th experiment.
These findings confirm previous research, highlighting the critical role of deflector width in enhancing the turbine's ability to capture wind efficiently. The study demonstrates the potential of optimizing deflector parameters to improve the efficiency of hybrid renewable energy systems, thereby contributing to more sustainable energy solutions.
For practical applications, the results indicate that implementing triangular deflectors with precise configurations can significantly enhance the performance of real-world hybrid systems. Future research should investigate designing deflectors that address challenges such as uncontrolled air turbulence and improve energy capture efficiency. Specific experimental methodologies and advanced measurement techniques should also be developed to refine triangular deflector integration and further explore its potential in hybrid renewable energy systems.
This study was funded by a PNBP grant from Universitas Sebelas Maret, Indonesia, identified by contract number 194.2/UN27.22/PT.01.03/2024, as part of the Penelitian Hibah Grup Riset (penelitian Hgr-uns) initiative.
[1] Nasser, M., Megahed, T.F., Ookawara, S., Hassan, H. (2022). Performance evaluation of PV panels/wind turbines hybrid system for green hydrogen generation and storage: Energy, exergy, economic, and enviroeconomic. Energy Conversion and Management, 267: 115870. https://doi.org/10.1016/j.enconman.2022.115870
[2] Tjahjana, D.D.D.P., Suyitno, R.A.R., Juwana, W.E., Prasojo, Y.J., Prasetyo, S.D., Arifin, Z. (2023). Economic feasibility of a PV-wind hybrid microgrid system for off-grid electrification in Papua, Indonesia. International Journal of Design & Nature and Ecodynamics, 18(4): 811-818. https://doi.org/10.18280/ijdne.180407
[3] Demirdelen, T., Ekinci, F., Mert, B.D., Karasu, İ., Tümay, M. (2020). Green touch for hydrogen production via alkaline electrolysis: The semi-flexible PV panels mounted wind turbine design, production and performance analysis. International Journal of Hydrogen Energy, 45(18): 10680-10695. https://doi.org/10.1016/j.ijhydene.2020.02.007
[4] Eltayeb, W.A., Somlal, J., Kumar, S., Rao, S.K. (2023). Design and analysis of a solar-wind hybrid renewable energy tree. Results in Engineering, 17: 100958. https://doi.org/10.1016/j.rineng.2023.100958
[5] Kong, D., Wang, Y., Li, M., Liang, J. (2022). Experimental investigation of a novel hybrid drying system powered by a solar photovoltaic/thermal air collector and wind turbine. Renewable Energy, 194: 705-718. https://doi.org/10.1016/j.renene.2022.05.102
[6] Pietrykowski, K., Kasianantham, N., Ravi, D., Gęca, M. J., Ramakrishnan, P., Wendeker, M. (2023). Sustainable energy development technique of vertical axis wind turbine with variable swept area—An experimental investigation. Applied Energy, 329: 120262. https://doi.org/10.1016/j.apenergy.2022.120262
[7] Amelia, A. R., Irwan, Y. M., Leow, W.Z., Safwati, I., Zhafarina, M. (2016). Investigation of the effect of temperature on photovoltaic (PV) panel output performance. Journal of Renewable Energy and Sustainable Development, 6(5): 682-688.
[8] Ebhota, W.S., Tabakov, P.Y. (2023). Influence of photovoltaic cell technologies and elevated temperature on photovoltaic system performance. Ain Shams Engineering Journal, 14(7): 101984. https://doi.org/10.1016/j.asej.2022.101984
[9] Masthura, Abdullah. (2024). Effect of temperature and sunlight intensity on surface of solar panels on electric power generated. Journal of Physics: Conference Series, Institute of Physics, 2733: 012029. https://doi.org/10.1088/1742-6596/2733/1/012029
[10] Kuncoro, I.W., Arifin, Z., Budiana, E.P., Hijriawan, M. (2023). Improvement performance twisted Savonius wind turbine on hybrid system: Effect of flat plate deflector installation. International Journal of Heat and Technology, 41(3): 742-748. https://doi.org/10.18280/ijht.410330
[11] Iakovidis, F., Ting, D.S.K. (2014). Effect of free stream turbulence on air cooling of a surrogate PV panel. ASME International Mechanical Engineering Congress and Exposition, American Society of Mechanical Engineers, 46521: V06BT07A001. https://doi.org/10.1115/IMECE2014-36560
[12] Pettongkam, W., Roynarin, W., Intholo, D. (2018). Investigation of PV and wind hybrid system for building rooftop. International Energy Journal, 18(4): 331-352.
[13] Tian, W., Bian, J., Yang, G., Ni, X., Mao, Z. (2022). Influence of a passive upstream deflector on the performance of the Savonius wind turbine. Energy Reports, 8: 7488-7499. https://doi.org/10.1016/j.egyr.2022.05.244
[14] Wong, K.H., Chong, W.T., Sukiman, N.L., Shiah, Y.C., Poh, S.C., Sopian, K., et al. (2018). Experimental and simulation investigation into the effects of a flat plate deflector on vertical axis wind turbine. Energy Conversion and Management, 160: 109-125. https://doi.org/10.1016/j.enconman.2018.01.029
[15] Qasemi, K., Azadani, L.N. (2020). Optimization of the power output of a vertical axis wind turbine augmented with a flat plate deflector. Energy, 202: 117745. https://doi.org/10.1016/j.energy.2020.117745
[16] Fatahian, H., Mishra, R., Jackson, F.F., Fatahian, E. (2023). Design optimization of an innovative deflector with bleed jets to enhance the performance of dual Savonius turbines using CFD-Taguchi method. Energy Conversion and Management, 296: 117655. https://doi.org/10.1016/j.enconman.2023.117655
[17] Layeghmand, K., Tabari, N.G., Zarkesh, M. (2020). Improving efficiency of Savonius wind turbine by means of an airfoil-shaped deflector. Journal of the Brazilian Society of Mechanical Sciences and Engineering, 42(10): 528. https://doi.org/10.1007/s40430-020-02598-7
[18] Jiang, Y., Zhao, P., Stoesser, T., Wang, K., Zou, L. (2020). Experimental and numerical investigation of twin vertical axis wind turbines with a deflector. Energy Conversion and Management, 209: 112588. https://doi.org/10.1016/j.enconman.2020.112588
[19] Arifin, Z., Prasojo, Y.J., Juwana, W.E., Rachmanto, R.A., Widhiyanuriyawan, D., Yohana, E., et al. (2024). Investigating the influence of nanofluid on photovoltaic-thermal systems concerning photovoltaic panel performance. E-Prime - Advances in Electrical Engineering, Electronics and Energy, 9: 100730. https://doi.org/10.1016/j.prime.2024.100730
[20] Damak, A., Driss, Z., Abid, M.S. (2013). Experimental investigation of helical Savonius rotor with a twist of 180°. Renewable Energy, 52: 136-142. https://doi.org/10.1016/j.renene.2012.10.043
[21] He, Y., Zhang, M., Li, W., Su, J., Kase, K. (2019). Feasibility of a new helical blade structure for a PV integrated wind turbine in a heat-driven swirling wind field. Energy, 185: 585-598. https://doi.org/10.1016/j.energy.2019.07.029
[22] Storti, B.A., Dorella, J.J., Roman, N.D., Peralta, I., Albanesi, A.E. (2019). Improving the efficiency of a Savonius wind turbine by designing a set of deflector plates with a metamodel-based optimization approach. Energy, 186: 107144. https://doi.org/10.1016/j.energy.2019.07.144
[23] Chandrasekar, M., Suresh, S., Senthilkumar, T., Ganesh Karthikeyan, M. (2013). Passive cooling of standalone flat PV module with cotton wick structures. Energy Conversion and Management, 71: 43-50. https://doi.org/10.1016/j.enconman.2013.03.012
[24] Pambudi, N.A., Firdaus, R.A., Rizkiana, R., Ulfa, D.K., Salsabila, M.S., Suharno, et al. (2023). Renewable energy in Indonesia: Current status, potential, and future development. Sustainability, 15(3): 2342. https://doi.org/10.3390/su15032342
[25] Tjahjana, D.D.D.P., Arifin, Z., Suyitno, S., Juwana, W.E., Prabowo, A.R., Harsito, C. (2021). Experimental study of the effect of slotted blades on the Savonius wind turbine performance. Theoretical and Applied Mechanics Letters, 11(3): 100249. https://doi.org/10.1016/j.taml.2021.100249