Bain Khusnul Khotimah*![]() | Setiani
| Setiani![]() | Ana Yuniasti Retno Wulandari
| Ana Yuniasti Retno Wulandari![]() | Andharini Dwi Cahyani
| Andharini Dwi Cahyani![]() | Deshinta Arrova Dewi
| Deshinta Arrova Dewi![]()
© 2025 The authors. This article is published by IIETA and is licensed under the CC BY 4.0 license (http://creativecommons.org/licenses/by/4.0/).
OPEN ACCESS
New machine learning (ML) models face challenges, particularly with imbalanced data. Such data is shared in productivity, and data regulation can improve fields such as the livestock sector. Data mining involves multi-stage preprocessing: sampling techniques for data replication, weighted K-nearest neighbor imputation (WKNNI), data transformation, and the classification refinement stage to get an optimum model. Support vector machines are among the most powerful machine learning methods based on kernels that require optimal clustering improvements. Weighted K-nearest neighbors with kernel refinement prove that modifying KNN reduces computation and maximizes performance. The addition of grid search hyperparameters is also used to optimize parameters and improve accuracy. The result obtained by combining weighted K-nearest neighbor (WKNN) and support vector machine (SVM), called weight K-nearest support vector machine (WKSVM), using synthetic minority over sampling technique (SMOTE), reached an experimental accuracy of 97.54%, which outperforms various benchmarks from several standard SVMs for public and field data.
livestock, imbalanced data, sampling methods, productivity, process innovation, weighted K-nearest neighbor, weight K-nearest support vector machine
Imbalanced data tends to experience changes in characteristics because minority class instances play a role but are limited in number. The majority class is large in number and does not have general specifications [1]. When the minority class is essential, the data that can be collected is often irregular data without any regularity, so some data processing is required to get meaningful data from a large amount [2]. Data is divided into many types because of its characteristics, all of which have different feature attributes [3]. Class inequality distribution is often a problem in classification [4], so a sample balancing solution method is required to provide significant quality improvements. Livestock identification systems range from manual identification to automatic identification with the help of mixed data. Traditional livestock identification systems with body condition scores and behaviors, such as standing time, sitting, and Peristalsis [5], have been used for individual identification in cattle, goats, and horse farms [6]. The complexity of hyperparameters and the number of support vectors required to construct the method are needed [7, 8]. The data used are categorical and continuous, type longitudinal multinomial, individual identification methods with non-ideal conditions, including the possibility of loss, duplication, and malfunction of electronic devices [9]. Visual feature-based livestock identification systems detect and classify various breeds or individuals based on unique features. The problem of data imbalance in research in various fields, especially livestock, in determining the selection of prospective parents requires special attention and fast and accurate solutions to increase productivity in food security [10].
The characteristics of imbalanced data sets have led to the problem of low accuracy for minority classes in classification. Researchers have proposed a large number of algorithms to solve the problem of class imbalance [11]. Furthermore, to overcome the problem of imbalanced class distribution, researchers designed various methods for taking weak samples for oversampling, such as SMOTE [6], RUS [9], ROS [12], adaptive synthetic sampling (ADASYN) [13], SMOTEboost [14], and RAMOBoost [15]. Li et al. [16] proposed an imbalance-reduced classification method by adding a new label matrix normalization to solve the general balance problem. Extending the mixed data development of standard debfab SVM can handle longitudinal and imbalanced data. The SMOTE algorithm is widely used to address class imbalance in SVM classification. The proposed an approach to optimize SMOTE parameters, reducing time expenditure and improving classification quality [11]. However, inconsistencies arise when SMOTE and SVM operate in different spaces [17]. To address this, kernel-based SMOTE methods have been developed. These methods perform the oversampling of minority instances in the feature space and obtain pre-images of synthetic samples to be added to the original dataset [18]. The proposed K-SMOTE that generates synthetic minority data points directly in the SVM feature space by augmenting the original Gram matrix. This method performed better on benchmark datasets and real-world applications, such as predicting degradation stages in semiconductor etching chambers. Finally, kernel-based SMOTE techniques demonstrated higher quality synthetic samples with better SVM classification effectiveness for imbalanced datasets when compared with the traditional SMOTE approaches [19].
Recent studies have explored hyperparameter optimization techniques for SVM classification [20, 21]. Grid search, random search, and Bayesian optimization have been compared for tuning SVM parameters, with Bayesian optimization demonstrating superior performance and efficiency in bioactive compound classification [22]. Hyperparameter tuning using random grid search has significantly improved lung cancer classification accuracy, precision, and specificity [23]. In fruit and vegetable image recognition, GridSearchCV optimization of SVM hyperparameters yielded 96% accuracy on both Chen's validation and test sets [24]. The comparative study on the grid search and random search techniques for optimizing SVM hyperparameters across seven datasets, considering accuracy, memory usage, and model validation time [25, 26]. These findings emphasize how proper hyperparameter tuning can significantly enhance SVM classification performance, be it for medical diagnostics, drug discovery, or agricultural applications [27, 28].
SVM performance is significantly affected by parameters, with grid search (GS) techniques working by determining the radius-margin constraints combining C, gamma, degree, and kernel selection parameters into a unified framework [22, 26]. The choice of appropriate kernel parameters is determined by determining the geometry of the feature space in several ways that are being developed, such as temporary kernel improvements by setting C to maximize margins and minimize errors. Class separation is usually applied to determine kernel parameters rather than C, gamma, and degree parameters for SVM. The approach being developed is by setting both Gaussian and clustering [25], a heuristic-based clustering algorithm optimizes the SVM kernel parameters by adopting a blind strategy in dynamically adjusting the operator as an objective function. The improvement measurement is very suitable for nonlinear data, as it optimizes SVM classification model parameters based on the double Gaussian Kernel [29]. Since, the technique of modifying the kernel function based on the Riemannian geometric structure increases the spatial resolution around the separating boundary surface and conformal mapping, which increases the separability between classes [30]. The new support vector machine for classification utilizes a polynomial kernel function. The most accurate SVM classification combines Hermite and Gaussian kernels. This new kernel for classifying hyperspectral data merges polynomial and radial basis functions. Additionally, kernel enhancement through KNN for nearest neighbors addresses ambiguous data, leading to improved classification performance [31, 32]. However, the biggest weakness of the KNN method is that the K value is difficult to determine [33, 34]. Furthermore, adaptive weights and selects the optimal K value by optimizing the weight particle collection, namely WKNN. The selection of the optimal K value is done by combining two widely used empirical methods: sequential weight selection and optimal learning [35]. A locally adjusted number of nearest neighbors is proposed by giving probabilistic weights, which is proposed to conclude K as the optimal number of nearest neighbors [36].
The WKNN model can reduce the influence of outliers on the training set. The kernel clustering method can be used with the existing one to cluster the training set and obtain different cluster centers. The best training set results are optimized by calculating the similarity between the center of each class and the corresponding sample with the WKNN weighting technique [11, 36]. The kernel function in SVM can map data using the nearest-based clustering technique by mapping from the original space to a high-dimensional feature space. Nonlinear mapping to a high-dimensional space significantly affects the classification results, resolving differences between data samples is strengthened, and data partitioning is improved to obtain better classification results. This method, supported by local learning, is a new algorithm built on the cluster [36]. This study prefers the WKNN query-based method to overcome the nonlinear kernel by using limits such as additional clustering. This study is comparable to the hierarchical clustering system in many real-world implementations. The efficiency of the KNN method can also be used to set SVM so that the output of probabilistic can be used to extend binary classification to multiclass classification. Imbalance data often have missing data, thus requiring an appropriate imputation method. In the classification of mixed data, ambiguous data often occurs due to uncertainty in values, so data improvement is required, namely reliable imputation [37, 38]. The classical KNNI strategy is widely used in order to address missing data problems. However, feature relevance significantly influences the selection of nearest neighbors for imputation [39]. The KNN algorithm selects the K most relevant complete observations based on the Euclidean distance and assigns weighted contributions from those examples to replace missing values [34, 40]. This study implemented the weighted KNN imputation method, an improved version of the KNN for enhancing the performance, especially at higher levels of missing data [39, 40].
The paper is organized as follows: Section 1 explains the Introduction. Section 2 reviews the theoretical background of preprocessing, the variety of sampling methods, and improved SVM. Section 3 discusses hyperparameters for WKSVM and compares them with other methods. It then presents the results of several experiments conducted on several real-world datasets and public data. Finally, Section 4 provides some conclusions regarding this research, as the abstract mentions.
Handling imbalanced data classification is essential for improving the performance of machine learning models. This literature review discusses various methods, including preprocessing techniques for unbalanced mixed data, SVM classification, kernel enhancement using weighted nearest neighbors, and hyperparameter tuning. These methods aim to enhance performance in unbalanced mixed data classification. Additionally, the researcher explores the theoretical foundations relevant to the proposed techniques.
2.1 Prepossessing data
The proposed research process series consists of the preprocessing stage, enhanced classification, and the model discovery stage. Normalizing data on mixed data is the process of making several variables have the same value range to anticipate data that is too large or too small to have normality that meets the requirements [1]. The methods for normalizing data on mixed numeric and categorical data are Z-score normalization and decimal scaling normalization [2].
$Z=\frac{x-\bar{x}}{\sigma}$ (1)
Z-score normalization is a method whose results are obtained from the data's average value and standard deviation. This method has a stable value against outliers or values greater than maxA or less than minA [3]. Finally, Decimal scaling normalization is shown in Eq. (2).
newdata $=$ data $/ \mathrm{i}$ (2)
with Newdata = normalized data, and i = the max value of the criteria. Data preprocessing prepares the data with several steps, namely weighted KNN imputation (WKNNI), especially at higher missing levels [34], data normalization, and balancing the data with various sampling methods. Furthermore, the performance improvement of SVM with kernel refinement can be improved by using the nearest the distance between neighbors and objects, for the greater weight. In WKNN, neighbor weights are used to calculate more accurate class probabilities to classify objects [26, 35].
2.2 Synthetic minority over sampling technique (SMOTE)
SMOTE is a replication-based method with an oversampling technique to change the balance of the data set [6, 8]. The process maintains balance by increasing the number of minority classes towards the majority [10]. This method searches for the n closest adjacent samples on the data sample x from the minority class data set in the nearest neighbor data set at y1, y2, y3, ... yn. The use of random linear interpolation operations is carried out on the minority class x and yi(j = 1,2, N) to produce new samples zj, within Eq. (3):
$z_j=x+\operatorname{rand} N(0,1) *\left(y_j-x\right), j=1,2, \ldots, N$ (3)
with randN (0,1) is a random number, zj represents a new replication sample, and x represents a minority class sample. At the same time, yj represents the j-th neighbor sample of x. Finally, this new synthetic minority class is merged into the original data set to produce a new training data set [11].
2.3 Adaptive synthetic sampling (ADASYN)
The adaptive ADASYN method exploits learning from imbalanced datasets by adaptively generating synthetic data according to its distribution [10]. ADASYN uses density distribution as a criterion to decide how much synthetic data to develop for each minority class. The principle of ADASYN, which uses distribution weights for data in the minority class based on the level of learning difficulty, enlightens us about its unique approach [11]. ADASYN ensures synthetic data is generated from minority classes that are difficult to learn compared to minority data that are easier to understand.
2.4 Random combination sampling (RCS)
The undersampling can risk losing important information, oversampling may lead to excess unrepresentative samples. Combining both techniques is advisable to achieve a more representative dataset. The RCS method offers a unique solution by randomly removing some data from the majority class and generating new samples for the minority class by combining two random samples from that class. This approach aims to produce new variations occupying a point in the vector space, ensuring that the latest samples remain representative and ultimately enhance the dataset's quality [13]. The RCS method, which randomly deletes some data in the majority class and adds samples for the minority class by combining two random samples in that class, offers a promising solution. The new sample will have new variations and be able to create a point in the vector space in an area that is still representative, thereby enhancing the quality of the dataset [14].
2.5 Grid search
The Grid-Search Algorithm selects optimal parameters in a certain range of values in the form of a grid to produce the most accurate predictions. The grid search strategy for all combinations of hyperparameters is determined in a multidimensional grid [8, 20].
2.6 Support vector machine (SVM)
SVM is a general machine learning classification method that exploits multiple high-dimensional fields to lower dimensions. Kernel functions are an integral part of SVM, which is extended to nonlinear separable problems as boundaries. The most prominent feature of SVM is the introduction of the kernel trick, which maps high-dimensional sample and feature spaces into a high-dimensional space. Its generalization ability, however, depends heavily on the choice of kernel function [18, 19]. The kernel space varies greatly depending on the type of data diversity, which can be separated linearly or nonlinearly to a lower dimension. The kernel is a separator function that assesses how much the data elements are clustered into classes that have the same similarity. The SVM method, called kernel-based, is the most well-known of the various classes of methods for modeling data using kernels [24, 25]. Given that the following example data consists of two parts in the input space $x=\left\{x_i x_2\right\}$ dan $y=\left\{y_i y_2\right\}$. Assume the kernel function will be created using the inputs x and y as follows. The above value of K implicitly defines a mapping to a higher dimensional space as in Eq. (4).
$\Phi(x)=\left\{x_i^2, \sqrt{2} x_1 x_2, x_2^2\right\}$ (4)
The kernel K = (x,y) takes two input spaces and gives them their similarities in feature space as follows:
$\Phi: X \rightarrow F$ (5)
$K: X x X \rightarrow R, K(x, y)=\Phi(x) . \Phi(y)$ (6)
Based on the kernel function, it can perform calculations that make predictions based on some data in the feature space station in Eq. (7).
$f(\Phi(x))=\operatorname{sign}(w . \Phi(y)+b)$ (7)
$f(\Phi(x))=\operatorname{sign}\left(\sum_{i=1}^m \alpha_i y_i K(x, y)+b\right)$ (8)
2.7 Weighted K-nearest neighbor (WKNN)
KNN classifies object data based on the number K of the closest training data. This classification aims to classify new objects based on the attributes of the sample data in the training data. The class will be determined based on the majority of K values that will determine the class [12]. In KNN, all closest neighbors have the same weight when determining the object class. In WKNN, the nearest neighbor is also determined using the calculation of the distance between the object to be classified and other objects in the dataset [27].
Suppose a dataset, $X=\left\{x_1, x_2, \ldots, x_N\right\}$, a data object is expressed as $x_i(1 \leq i \leq N)$, and $x_i \in R^d$. Nonlinear mapping function $\Phi: R^d \rightarrow F$, where F is a mapped high dimensional space. In space F, a clustering algorithm is used to partition data. Suppose that the number of clusters that need partitioning is K; then, data are clustered in the nearest class by the kernel function.
$\min D=\sum_{k=1}^K \sum_{x_i \in C_k}\left\|x_i-m_k\right\|^2$ (9)
$m_k=\frac{\sum_{x_i \in C_k} x}{\left|C_k\right|}$ (10)
where, $m_k$ is the center of a cluster, then $C_k(1 \leq k \leq K)$ as a cluster produced during the clustering process, Ck represents the number of data objects in cluster k. Kernel clustering method based on the similarity between training samples and the selection of centers in each appropriate class. Centroid updates are carried out in stages by adding weights to improve extensive performance in showing high performance and improving the classifier's effectiveness [28, 29]. The proposed WKNN method, which uses multiple data points to represent clusters, solves this problem well and archives better results when applied in classification.
$(i, j)=\frac{\sum_{f=1}^p \delta_{i j}^{(f)} d_{i j}^{(f)}}{\sum_{f=1}^p \delta_{i i}^{(f)}}$ (11)
with $d_{i j}^{(f)}$ depending on the type of data feature, If the data feature type is numeric, then value $d_{i j}^{(f)}=\frac{\left\|x_{i f}-x_{j f}\right\|}{\max _h x_{h f}-\min _h x_{h f}}$, with $\max _h x_{h f}$, is the largest value in the feature and $\min _h x_{h f}$ is the smallest value in feature $f$. If the data feature type is categorical then $d_{i j}^{(f)}=0$ if $x_{i f}=x_{j f}$. On the contrary, if $x_{i f} \neq$ $x_{j f}$ then $d_{i j}^{(f)}=1$.
$W_i^{\prime}=\left\{\begin{array}{c}\frac{d\left(x^{\prime}, x_k^{N N}\right)-d\left(x^{\prime}, x_i^{N N}\right)}{d\left(x^{\prime}, x_k^{N N}\right)-d\left(x^{\prime}, x_1^{N N}\right)}, \text { if } d\left(x^{\prime}, x_k^{N N}\right) \neq d\left(x^{\prime}, x_i^{N N}\right) \\ n, \quad \text { if } d\left(x^{\prime}, x_k^{N N}\right)=d\left(x^{\prime}, x_i^{N N}\right)\end{array}\right.$ (12)
The further improve positioning accuracy, the enhanced WKNN algorithm based on spatial distance with the weighted combination of these two distances is used. The determination of the K value can vary according to the calculation of the closest distance. The weights for each data, determine the test data based on the class with the largest weight Eq. (13).
$y^{\prime}=\arg \max _y \sum_{\left(x_i^{N N}, y_i^{N N}\right) \in T^{\prime}} W_i^{\prime} x \delta\left(y=y_i^{N N}\right)$ (13)
So, kernel mathematical functions methods take data as input and transform it into the required form. In other words, kernel functions transform the training dataset to convert the nonlinear decision surface into a linear equation in a higher-dimensional space [27]. The kernel improvement here uses a kernel clustering algorithm that uses data points to represent clusters during the clustering process. Kernel function mapping objects with nonlinear mapping of data divided into high-dimensional space. Nonlinear data division for data objects, from high-dimensional space to lower dimensions, with adaptive weights to separate data objects efficiently [28, 30].
2.8 Weight K-nearest SVM (WKSVM) classifier
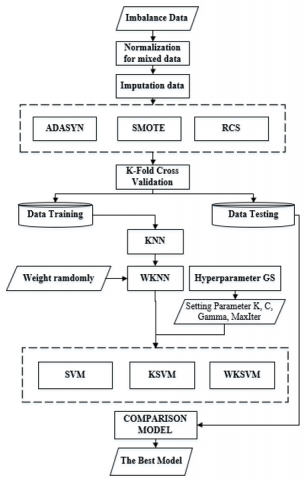
SVM requires complete labeling of input data, while WKNN groups data into K clusters. The choice of K poses challenges, as it impacts model accuracy and may lead to overfitting due to necessary weighting. In contrast, KNN can yield varying final clusters, making it difficult to determine the optimal K-value. The WKNN algorithm assigns most neighbors to the same class among the K neighbors. The proposed approach to improving data classification combines several appropriate preprocessing treatments, kernel, and hyperparameter refinement to reduce the influence of outliers in the training set contain stage. Figure 1 uses the improved SVM, and WKNN method for imputation to generate complete data based on the closest to direct the same class.
Figure 1. The stages in developing an improved SVM for imbalance data
The kernel function refinement using WKNN clustering maps the data that requires clustering from a high-dimensional feature space to a low-dimensional class. Calculating the similarity between the center of each class and its corresponding sample will optimize a reliable training set. Finally, hyperparameters are also added to optimize the classifier performance, reduce computation, and improve performance for better classification results [36]. The steps of the proposed combined method are as follows in the following algorithm details.
3.1 Data description
Data collection from publicly available datasets and direct measurement of livestock in Indonesia. The public dataset of livestock data is taken from the public website https://www.kaggle.com/datasets [1]. The usage of public and private livestock datasets in the regional government organizations, involving Food Security and Agriculture in Madura region has almost the same characteristics, namely mixed data on body condition and behavioral characteristics taken, namely ordinal and consisting of categories, continuous, and multiclass [3]. Livestock data that tends to survive both horses, cows and goats to measure BCS and behavior. Finally, each dataset includes the total number of data records, attributes as features, and different classes as shown in Table 1.
Data normality is measured to determine the level of correlation, and an observation test is used to determine the highest correlation level of data uniformity [2]. The statistical coefficient in Table 2, which shows value, measures the model's ability to describe the variables prepared for the target classification response.
Table 1. Description of livestock in balance data
|
Dataset |
Features |
Records |
Missing Value |
|
Horse survival |
20 |
1000 |
yes |
|
Indonesian goats |
10 |
796 |
yes |
|
Indonesian cattle |
10 |
683 |
yes |
Table 2. Summary results of normality test on dataset
|
Model |
Model Summary |
||||
|
F |
R Square |
Adjusted R Square |
Standard Deviation |
Durbin Watson |
|
|
Horse survival |
20.50 |
0.853 |
0.742 |
1.07 |
1.24 |
|
Indonesian goats |
1.202 |
0.262 |
0.727 |
2.52 |
0.74 |
|
Indonesian cattle |
1.702 |
0.653 |
0.853 |
1.39 |
0.92 |
Determination testing obtained the value of local Indonesian cattle with an Adjusted R Square of 0.853, meaning that the characteristic features as independent variables significantly affect the dependent variable (response). STD shows a standard deviation value above 1, meaning that the data is heterogeneous because it consists of unbalance data. The horse is in second place with an R Square value of and the last Indonesian Goats. The variation and distribution of values influence data normality. This study proposes improvements to problematic data, namely several missing feature values and unbalanced data. Furthermore, the method for fixing the problem is carried out at the data processing level [6, 7]. Imputation using WKNNI to find the best performance depends on K at the best nearest [8].
Table 3 shows the preprocessing process with imputation and replication. The dataset generally contains missing values of ±10% requiring normalization, which is done by preprocessing to obtain values from category and quantity variations. Missing values will be credited with WKNNI using GS to obtain imputation accuracy in the range K = 1 - 20. The table shows that each level of accuracy for the best value obtained varies according to data conditions. The best accuracy value for local cattle K = 9, with the sampling replication method, for Indonesian cattle is 97.54%.
Table 3. The result imputation data with WKNNI
|
Dataset |
Imputation (WKNNI) |
Accuracy |
|
Horse survival |
K = 7 |
93.05 |
|
Indonesian goats |
K = 11 |
95.20 |
|
Indonesian cattle |
K = 9 |
97.54 |
3.2 Hyperparameter WKSVM
Grid search settings to set the parameters C, γ, and kernel for the WKSVM model are carried out on the training data. The optimal parameters are determined based on the accuracy value by dividing the Cross-validation data 10 times. In addition to the imputation of the use of WKNN and other kernels and class mapping on the kernel, we set maxIter = 100, C = 0.1-20, and error rate ε = 0.0001 for all experiments. We prepared four mixed multivariate data with high correlation. The test results aim to prepare data to analyze the significance level of the diversity of values in the data. Finally, the SVM model with optimal parameters is applied to the test data to obtain classification performance using the optimal parameters of the WKSVM grid search method.
Table 4. The result performance measurement of WKSVM classification
|
Dataset |
K |
$\gamma$ |
$C$ |
Accuracy |
Sensitivity |
Specificity |
|
Horse survival |
9 |
2-2 |
12 |
93.05 |
67.80 |
73.90 |
|
Indonesian goats |
13 |
2-1 |
0.5 |
95.20 |
85.20 |
87.16 |
|
Indonesian cattle |
7 |
2-3 |
5 |
97.54 |
67.00 |
86.68 |
(a) Horse survival
(b) Data Indonesian goats
(c) Data Indonesian cattle
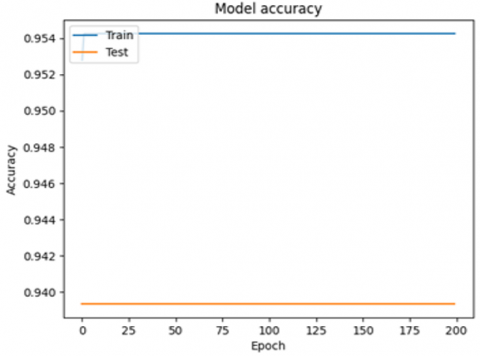
Figure 2. WKSVM performance pattern on each data
Figure 2 shows the type of category tends to be heterogeneous, and the number of records is small, indicating the optimal parameter value. The higher the value of K, C, the greater the likelihood of increasing accuracy. The high heterogeneity values in Indonesian Cattle have produced the highest accuracy because the data is more stable with high correlation, having an accuracy of 97.54%. Data with high heterogeneity values in produce the highest accuracy because the data is more stable with high correlation. The hybrid method combining GS to select optimal parameters in the SVM method and kernel improvement with WKNN. Modeling on SVM improvement with kernel enhancement, kernel improvement, and parameter optimization with GS in 10-fold cross-validation testing is used to measure accuracy on several datasets. The usage a hybrid method that combines GS hyperparameters in several method sampling, to determine on sampling variety of SVM repair. The test are 3 data sets, using 1-1000 iterations with variations of the best parameter K, C and gamma.
Figure 2 indicates that the goat dataset is overfitting due to its limited and uniform values. In contrast, the kernel repair function in SVM with WKNN yields more stable class margins for the horse and cow datasets, which offer greater variability. Many data mining issues arise from imbalanced datasets. The use of Table 5 with the imbalance variation method to test for conditions of excess or lack of data prevents the model from effectively capturing the underlying pattern.
Table 5. Accuracy values each model
|
Dataset |
Sampling Techniques |
SVM |
K-SVM |
WKSVM |
|
Horse survival |
SMOTE |
0.791 |
0.924 |
0.947 |
|
ADASYN |
0.820 |
0.831 |
0.922 |
|
|
RCS |
0.816 |
0.928 |
0.912 |
|
|
Indonesian goats |
SMOTE |
0.868 |
0.803 |
0.930 |
|
ADASYN |
0.873 |
0.784 |
0.928 |
|
|
RCS |
0.828 |
0.902 |
0.900 |
|
|
Indonesian cattle |
SMOTE |
0.860 |
0.939 |
0.975 |
|
ADASYN |
0.902 |
0.949 |
0.903 |
|
|
RCS |
0.934 |
0.954 |
0.930 |
Table 5 shows WKNN for K-nearest kernel improvement for SVM. Here WKSVM can solve classification problems on heterogeneous data compared to data that tends to be homogeneous. Finally, this WKSVM combined algorithm can be applied to multi classification problems without difficulty, resulting in the highest accuracy compared to other SVMs. In the classification of datasets generated by SMOTE, ADASYN, and RCS, the classification results have almost the same average value as the accuracy results. In these three datasets, the difference between the use of differences in the use of SMOTE has increased significantly in the horse dataset. ADASYN increases in datasets that tend to be homogeneous with low correlation levels in the WKSVM classification.
The results of kernel refinement with GS hyperparameters on WKSVM are significant in selecting the best K, C, and gamma parameters. The classification performance on public horse farm data and goat and cattle data in Indonesia shows that WKSVM hyperparameters have shown high accuracy and computational reduction for the highest Indonesian cattle data of 97.54% with k = 9, which provides better performance than regular SVM. The accuracy value depends on the unbalanced data conditions, so that by testing several methods, namely three sampling methods, namely SMOTE, ADASYN, and RCS, the most appropriate method is SMOTE because most of the data is independent in mixed conditions. Furthermore, the experimental results show that WKSVM hyperparameters have higher classification accuracy than regular SVM and KSVM. Its performance also depends on the level of correlation between data, which is found in livestock data. Because kernel refinement and SVM parameter optimization have better optimization potential for mixed data with a certain level of correlation than regular SVM.
The use of grid search (GS) is highlighted as a method for parameter optimization. However, the computational intensity of GS, especially with high-dimensional data, raises concerns regarding scalability and efficiency. The absence of a discussion on alternative optimization techniques, such as Random Search or Bayesian Optimization, which are more computationally efficient, represents a limitation. Addressing these alternatives in future work could broaden the perspective on parameter optimization strategies and improve the robustness of the proposed methodology.
We acknowledge the Ministry of Higher Education, Science, and Technology for providing funding under the BIMA Account 013/UN46.4.1/PT.01.03/2024 for Fundamental Research in 2024. Furthermore, we would like to express our gratitude to a number of regional government organizations, involving Food Security and Agriculture, for their collaboration in helping with data collection and licensing, thereby rendering this research appropriate.
|
$d(i, j)$ |
Dissimilarity between the i-th data and the j-th data |
|
i |
1…m, where, m is the training data |
|
j |
1…n, where, n is the testing data |
|
p |
Number of features |
|
f |
Feature 1…feature p for the value $\delta_{i j}^{(f)}$ |
|
$x^{\prime}$ |
The value to be calculated with the nearest neighbor |
|
$d\left(x^{\prime}, x_k^{N N}\right)$ |
Euclidean distance between $x^{\prime}$, and $x_k^{N N}$ (largest distance) |
|
$d\left(x^{\prime}, x_k^{N N}\right)$ |
Euclidean distance between $x^{\prime}$, and $x_i^{N N}$ (largest distance) |
|
$y^{\prime}$ |
Class label of unknown test data |
|
$y_i^{N N}$ |
Class label of the i-th neighbor among its K nearest neighbors |
|
$\delta\left(y=y_i^{N N}\right)$ |
Dirac delta function, is 1 if $y=y_i^{N N}$ and 0 otherwise |
|
$b$ |
Bias value |
|
m |
Number of support vectors |
|
$K(x, y)$ |
Kernel |
|
w |
Weigh |
|
K |
K-Nearest |
|
C |
Value regulation |
|
$\sigma_i$ |
Sigma |
|
$\gamma$ |
The velocity value |
|
$\alpha$ |
The initial initialization of the support vector |
[1] Werner de Vargas, V., Schneider Aranda, J.A., dos Santos Costa, R., da Silva Pereira, P.R., Victória Barbosa, J.L. (2023). Imbalanced data preprocessing techniques for machine learning: A systematic mapping study. Knowledge and Information Systems, 65(1): 31-57. https://doi.org/10.1007/s10115-022-01772-8
[2] Sagunthaladevi, S., Bhupathi, R.V.R.R. (2017). New attribute construction in mixed datasets using classification algorithms. International Journal of Engineering Sciences & Research Technology, 6(2): 386-393. https://doi.org/10.5281/zenodo.291847
[3] Alasadi, S.A., Bhaya, W.S. (2017). Review of data preprocessing techniques in data mining. Journal of Engineering and Applied Sciences, 12(16): 4102-4107. https://doi.org/10.3923/jeasci.2017.4102.4107
[4] Karrar, A.E. (2022). The effect of using data pre-processing by imputations in handling missing values. Indonesian Journal of Electrical Engineering and Informatics, 10(2): 375-384. https://doi.org/10.52549/ijeei.v10i2.3730
[5] Elreedy, D., Atiya, A.F. (2019). A comprehensive analysis of synthetic minority oversampling technique (SMOTE) for handling class imbalance. Information Sciences, 505: 32-64. https://doi.org/10.1016/j.ins.2019.07.070
[6] Hollevoet, A., De Waele, T., Peralta, D., Tuyttens, F., De Poorter, E., Shahid, A. (2024). Goats on the move: Evaluating machine learning models for goat activity analysis using accelerometer data. Animals, 14(13): 1977. https://doi.org/10.3390/ani14131977
[7] Van FC, L.L., Anam, M.K., Firdaus, M.B., Yunefri, Y., Rahmi, N.A. (2024). Enhancing machine learning model performance in addressing class imbalance. Cogito Smart Journal, 10(1): 57-69. https://doi.org/10.31154/cogito.v10i1.626.478-490
[8] Mohammed, R., Rawashdeh, J., Abdullah, M. (2020). Machine learning with oversampling and undersampling techniques: Overview study and experimental results. In 2020 11th International Conference on Information and Communication Systems (ICICS), Irbid, Jordan, pp. 243-248. https://doi.org/10.1109/ICICS49469.2020.239556
[9] Hossain, M.E., Kabir, M.A., Zheng, L., Swain, D.L., McGrath, S., Medway, J. (2022). A systematic review of machine learning techniques for cattle identification: Datasets, methods and future directions. Artificial Intelligence in Agriculture, 6: 138-155. https://doi.org/10.1016/j.aiia.2022.09.002
[10] Berckmans, D. (2014). Precision livestock farming technologies for welfare management in intensive livestock systems. Revue Scientifique et Technique, 33(1): 189-196. https://doi.org/10.20506/rst.33.1.2273
[11] Gond, V.K., Dubey, A., Rasool, A., Khare, N. (2022). Missing value imputation using weighted KNN and genetic algorithm. In ICT Analysis and Applications: Proceedings of ICT4SD, pp. 161-169. https://doi.org/10.1007/978-981-19-5224-1_18
[12] Ependi, U., Rochim, A.F., Wibowo, A. (2023). A hybrid sampling approach for improving the classification of imbalanced data using ROS and NCL methods. International Journal of Intelligent Engineering and Systems, 16(3): 345-361. https://doi.org/10.22266/ijies2023.0630.28
[13] He, H., Bai, Y., Garcia, E.A., Li, S. (2008). ADASYN: Adaptive synthetic sampling approach for imbalanced learning. In 2008 IEEE International Joint Conference on Neural Networks (IEEE World Congress on Computational Intelligence), Hong Kong, pp. 1322-1328. https://doi.org/10.1109/IJCNN.2008.4633969
[14] Mujahid, M., Kına, E.R.O.L., Rustam, F., Villar, M.G., Alvarado, E.S., De La Torre Diez, I., Ashraf, I. (2024). Data oversampling and imbalanced datasets: An investigation of performance for machine learning and feature engineering. Journal of Big Data, 11(1): 87. https://doi.org/10.1186/s40537-024-00943-4
[15] Chen, S., He, H., Garcia, E.A. (2010). RAMOBoost: Ranked minority oversampling in boosting. IEEE Transactions on Neural Networks, 21(10): 1624-1642. https://doi.org/10.1109/TNN.2010.2066988
[16] Li, G., Zheng, Q., Liu, Y., Li, X., Qin, W., Diao, X. (2024). A classification method for incomplete mixed data using imputation and feature selection. Applied Sciences, 14(14): 5993. https://doi.org/10.3390/app14145993
[17] Ali, J., Aldhaifallah, M., Nisar, K.S., Aljabr, A.A., Tanveer, M. (2022). Regularized least squares twin SVM for multiclass classification. Big Data Research, 27: 100295. https://doi.org/10.1016/j.bdr.2021.100295
[18] Lu, S.D., Liu, H.D., Wang, M.H., Wu, C.C. (2024). A novel strategy for multitype fault diagnosis in photovoltaic systems using multiple regression analysis and support vector machines. Energy Reports, 12: 2824-2844. https://doi.org/10.1016/j.egyr.2024.08.074
[19] Sain, H., Purnami, S.W. (2015). Combine sampling support vector machine for imbalanced data classification. Procedia Computer Science, 72: 59-66. https://doi.org/10.1016/j.procs.2015.12.105
[20] Syarif, I., Prugel-Bennett, A., Wills, G. (2016). SVM parameter optimization using grid search and genetic algorithm to improve classification performance. TELKOMNIKA, 14(4): 1502-1509. http://doi.org/10.12928/telkomnika.v14i4.3956
[21] Luts, J., Molenberghs, G., Verbeke, G., Van Huffel, S., Suykens, J.A. (2012). A mixed effects least squares support vector machine model for classification of longitudinal data. Computational Statistics & Data Analysis, 56(3): 611-628. https://doi.org/10.1016/j.csda.2011.09.008
[22] Mantovani, R.G., Rossi, A.L., Vanschoren, J., Bischl, B., De Carvalho, A.C. (2015). Effectiveness of random search in SVM hyper-parameter tuning. In 2015 International Joint Conference on Neural Networks (IJCNN), Killarney, Ireland, pp. 1-8. https://doi.org/10.1109/IJCNN.2015.7280664
[23] Wu, R., Wang, B., Zhao, Z. (2024). Privacy-preserving medical diagnosis system with Gaussian kernel-based support vector machine. Peer-to-Peer Networking and Applications, 17: 3094-3109. https://doi.org/10.1007/s12083-024-01743-6
[24] Gao, Z., Fang, S.C., Luo, J., Medhin, N. (2021). A kernel-free double well potential support vector machine with applications. European Journal of Operational Research, 290(1): 248-262. https://doi.org/10.1016/j.ejor.2020.10.040
[25] Muflikhah, L., Widodo, Mahmudy, W.F., Solimun, S. (2020). A support vector machine based on kernel k-means for detecting the liver cancer disease. International Journal of Intelligent Engineering and Systems, 13(3): 293-303. https://doi.org/10.22266/ijies2020.0630.27
[26] Muhajir, D., Akbar, M., Bagaskara, A., Vinarti, R. (2022). Improving classification algorithm on education dataset using hyperparameter tuning. Procedia Computer Science, 197: 538-544. https://doi.org/10.1016/j.procs.2021.12.171
[27] Ali, Y.A., Awwad, E.M., Al-Razgan, M., Maarouf, A. (2023). Hyperparameter search for machine learning algorithms for optimizing the computational complexity. Processes, 11(2): 349. https://doi.org/10.3390/pr11020349
[28] Gao, R., Qi, K., Yang, H. (2024). Fused robust geometric nonparallel hyperplane support vector machine for pattern classification. Expert Systems with Applications, 236: 121331. https://doi.org/10.1016/j.eswa.2023.121331
[29] Hicdurmaz, B., Calik, N., Ustebay, S. (2024). Gauss-like logarithmic kernel function to improve the performance of kernel machines on the small datasets. Pattern Recognition Letters, 179: 178-184. https://doi.org/10.1016/j.patrec.2024.01.014
[30] Ahmed, R., Bibi, M., Syed, S. (2023). Improving heart disease prediction accuracy using a hybrid machine learning approach: A comparative study of SVM and KNN algorithms. International Journal of Computations, Information and Manufacturing, 3(1): 49-54. https://doi.org/10.54489/ijcim.v3i1.223
[31] Shaffi, N., Vimbi, V., Mahmud, M., Subramanian, K., Hajamohideen, F. (2023). Bagging the best: A hybrid SVM-KNN ensemble for accurate and early detection of Alzheimer’s and Parkinson’s diseases. In Brain Informatics: 16th International Conference, Hoboken, NJ, USA, pp. 443-455. https://doi.org/10.1007/978-3-031-43075-6_38
[32] Rithesh, R.N. (2017). SVM-KNN: A novel approach to classification based on SVM and KNN. International Research Journal of Computer Science, 4(8): 43-49. https://doi.org/10.26562/IRJCS.2017.AUCS10088
[33] Hu, L.Y., Huang, M.W., Ke, S.W., Tsai, C.F. (2016). The distance function effect on K-nearest neighbor classification for medical datasets. SpringerPlus, 5: 1304. https://doi.org/10.1186/s40064-016-2941-7
[34] Zuo, W., Zhang, D., Wang, K. (2008). On kernel difference-weighted K-nearest neighbor classification. Pattern Analysis and Applications, 11: 247-257. https://doi.org/10.1007/s10044-007-0100-z
[35] Zuo, W.M., Lu, W.G., Wang, K.Q., Zhang, H. (2008). Diagnosis of cardiac arrhythmia using kernel difference weighted KNN classifier. In 2008 Computers in Cardiology, Bologna, Italy, pp. 253-256. https://doi.org/10.1109/CIC.2008.4749025
[36] Açıkkar, M., Tokgöz, S. (2024). An improved KNN classifier based on a novel weighted voting function and adaptive k-value selection. Neural Computing and Applications, 36(8): 4027-4045. https://doi.org/10.1007/s00521-023-09272-8
[37] Surono, S., Onn, C.W., Rafsanjani, Z.A., Eka, A. (2022). Fuzzy inference system for classification with dimension reduction of rough set. Journal of Theoretical and Applied Information Technology, 100(22): 6741-6757.
[38] Li, Q., Xiong, Q., Ji, S., Yu, Y., Wu, C., Yi, H. (2021). A method for mixed data classification base on RBF-ELM network. Neurocomputing, 431: 7-22. https://doi.org/10.1016/j.neucom.2020.12.032
[39] Madhu, G., Nagachandrika, G. (2016). A new paradigm for development of data imputation approach for missing value estimation. International Journal of Electrical and Computer Engineering, 6(6): 3222-3228. https://doi.org/10.11591/ijece.v6i6.10632
[40] Faris, H., Abukhurma, R., Almanaseer, W., Saadeh, M., Mora, A.M., Castillo, P.A., Aljarah, I. (2020). Improving financial bankruptcy prediction in a highly imbalanced class distribution using oversampling and ensemble learning: A case from the Spanish market. Progress in Artificial Intelligence, 9: 31-53. https://doi.org/10.1007/s13748-019-00197-9