Nabaa Mohammed Al-Shamary*![]() | Hadeel Salim Alkutubi
| Hadeel Salim Alkutubi![]() | Shaymaa Maki Kadham
| Shaymaa Maki Kadham![]()
© 2025 The authors. This article is published by IIETA and is licensed under the CC BY 4.0 license (http://creativecommons.org/licenses/by/4.0/).
OPEN ACCESS
In this research, medical data was used representing the incidence of coronavirus infections for a few of the selected Arab nations under investigation (Bahrain, Iraq, Kuwait, Egypt, Jordan, Lebanon, Libya, Oman, Qatar, Morocco, Palestine, Saudi Arabia, Sudan, Tunisia, Yemen, Syria, UAE), where the data was analyzed using two statistical methods, the first is to design a randomized controlled trial to determine the significant differences between the quantity of coronavirus cases in the chosen Arab nations. Also, knowing the presence or absence of a clear moral difference in the number of infections between the different months of the year in 2020 and for each selected Arab country separately. The second statistical method was Tukey's test to answer the following question: Is there a clear significant difference in whichever diseases there are in each of the two nations individually or not, and which Arab countries have a higher number of infections compared to the rest of the selected countries under study.
randomized complete block design (RCBD), Tukey's honest significance test, coronavirus data
In this paper the theoretical background on how to design a randomized trial will be discussed, which design a complete block randomized trial and how to obtain an analysis of variance table for this experiment? In addition to discussing the way Tukey’s test helps in comparing the number of significant differences of the variables in question, this also. For the number of cases of the Coronavirus for the year 2020, obtained data were analyzed through the two methods described above, and the results of the two analyses were as follows, which can be viewed in the body of the current study below.
The concept of a randomized complete block design is considered one of the widely used layouts in many fields such as agricultural, engineering, medical, and other fields. Besides the chance that the design helps decrease random error, the final character broadens the scope of the generalizable study findings. The complete block means that each treatment is applied on all the blocks, while an incomplete randomized block design means that if a block misses one or more treatment groups. The designation of randomness will therefore stay because the treatment group will be randomly assigned to the experimental units within the blocks. Regarding the Tukey test, it is understood as being the post-hoc test that is built when making comparison between the variables that have been chosen and collected data beforehand. This test tells dividing difference between the arithmetic mean of each of two values as opposed to comparing the values in pairs. The value of the Tukey test, in simple terms, is the arithmetic difference between the mean of each two values The above absolute difference is further divided by the standard error of the means (SE) as determined from thee one way ANOVA test. The SE is the square root of Variance/ sample size [1, 2]. As it will be shown in this section, there is a vast literature focused on statistical analyses of medical data and many of those analyses include data on the corona virus Such vast literature actually includes many studies on the use of experimental design including a completely randomized design. However, the following tests associated with finding multiple comparisons between each two variables separately include - Tukey test, Scheffé, etc. In this research we will discuss some of these studies, as below.
Alkutubi [2] analyzed twenty types of cancer at Tikrit General Hospital in Salah al-Din Governorate during the years 1995-2005 where the researchers employed a randomized trial design, among three statistical methods, to find out the significant differences in the number of cases of any of the twenty cancer categories, for both males and females.
Cancer types prevalent in the hospital settings were examined and authors introduced various statistical approaches employed in the analysis of data collected from the previous studies [3, 4]. A completely randomized trial design was used in the realization of the distinctions between the male and female individuals and the age distribution of the various types of cancers registered in the hospital setting [5, 6]. They presented the number of HIV infections from 1990 to 2008 based on three variables: age, sex, and race. In addition to a completely randomized trial design a factorial experiment design was used to establish significant differences of this however there were large differences with quantity of infections with this disease in different age groups and also between genders. The affected person, in addition to the type of race [7-9]. They assessed the trend of breast cancer patients in Al-Sadr Teaching Hospital in Najaf Governorate in Iraq during the period between 2005 and 2009 where the authors had planned to carry out a complete randomized trial to detect difference in number of occurrences of the event in relation to different research parameters including age and tumour stage, occupation and SES. And last not the least his level of education.
Lynd and O'brien [10] found out the significance of the age and sex factors in the case of COVID-19 deaths in the United States, analysis of variance test is carried out [11-13]. These data were extracted from the “Provisional COVID-19 Deaths by Sex and Age” files that are in data.gov and CDC’s website. This information includes Daily COVID19 deaths, breakdown of fatalities by age, sex of the deceased, and jurisdiction where the death occurred as well as other diseases reported from individuals to the NCHS, like pneumococcal pneumonia and influenza. COVID-related deaths from January 1, 2020- November 9, 2022. There are eleven subgroups in the age; (0 - 1), (1 - 4), (5 - 14), (15 - 24, (25 - 34), (35 - 44), (45 -54), and (55 – are these subcategories. Age group has a statistically significant influence on COVID deaths, and the only component derived from the data. The estimates do not show a strong relationship between the sex and interaction term in the COVID deaths. Finally, the results of the analysis provided support for the ANOVA assumptions of homogeneity of variance, normality, and independence of observations after testing. Where there were significant pairwise groupings, a post hoc Tukey HSD test was conducted to determine which of these would affect COVID deaths.
Regardless the age range the Tukey test results revealed that all together there were 26 significant within pairs in the data. Furthermore, the findings of the ANOVA test also refute the fact that everyone had been operating under the thought process that men are more vulnerable to COVID-19 fatalities than women. The analysis of COVID-19 [14-16] and labour show that the employment kinds did not greatly differ by gender. There could also be some truth in the stands that female organisms are generally healthier than male ones. Besides, men are inclined to pay no attention to the physical distance and engage in risk-taking behaviors. They may also be more careless on symptoms of Coronavirus or less worried about them. This comprises activities that relate to lung health as supported by the findings of the statistical analysis discussed above and human health [17-22].
2.1 The randomized complete block design
The randomized complete block design (RCBD) is perhaps the most commonly encountered design that can be analyzed as a two-way ANOVA. An experimental unit set is arranged (blocked) in this design in a manner that reduces the variability between units within groups (blocks). Maintaining as little experimental error as feasible inside each block is the goal. The variability across blocks may be approximated as a distinct source of variation since each block comprises the whole set of treatments; so, differences between blocks are not caused by treatments. Treatments are allocated at random inside a block after experimental units have been organised into blocks; distinct randomizations are created for each block. Table 1 displays an ANOVA's generalised framework for an RCBD. Testing the equity of treatment methods is our primary focus in this approach.
Table 1. Analysis of variance table for a randomized complete block trial design
|
Sources of Variation (S.O.V.) |
Degrees of Freedom (df) |
Sum of Square (SS) |
Mean Sum of Square (MS) |
F-Test $F_{\text {calcu.}}$ |
|
Block |
r-1 |
SSB |
MSB |
$\frac{M S B}{M S E}$ |
|
Treatment |
t-1 |
SSt |
MST |
$\frac{M S t}{M S E}$ |
|
Error |
(t-1)(r-1) |
SSE |
MSE |
|
|
Total |
tr-1 |
SST |
2.2 Practical application
In this research, real data was used signifying the quantity of infections with the Corona virus for the year 2020, classified according to the twelve months and for some of the selected Arab countries under study (Bahrain, Iraq, Kuwait, Egypt, Jordan, Lebanon, Libya, Oman, Qatar), where an experimental analysis was applied. Randomized complete blocks to determine whether or if the frequency of coronavirus infections in the chosen Arab nations varies significantly from one another. Tukey's analysis was then used to determine the accuracy of the notable variations between the infection rate between each two countries separately. After that, and again, a completely randomized block design and Tukey's analysis were applied to find significant differences between the number of Coronavirus infections among a number of other selected Arab countries (Morocco, Palestine, Saudi Arabia, Sudan, Tunisia, Yemen, Syria, and the Emirates).
Step 1. Statistical hypothesis for replications:
H0: All replicate (the number of infections in different months of the year) means are equal.
HA: At least one of the replicates (the number of infections in different months of the year) means is different from the others.
Step 2. Statistical hypothesis for treatments:
H0: All treatment (the infections of selected countries are being studied) means are equal.
HA: At least one of the treatments (the infections of selected countries are being studied) means is different from the others.
Step 3. Calculate the Correction Factor (CF):
$\mathrm{CF}=\frac{\left(Y_{. .}\right)^2}{r t}=\frac{(1695237)^2}{9 * 12}=26609523020$
Step 4. Calculate the Total SS (SST):
$S S T=\sum Y_{i j}^2-C F=(2313)^2+\cdots+(0)^2-C F=75894543465$
Step 5. Calculate the Block SS (SSB):
$\mathrm{SSB}=\frac{\sum Y_{. j}{ }^2}{t}-C F=\frac{(114682)^2+\ldots+(100)^2}{9}-C F=17234158790$
Step 6. Calculate the Treatment SS (SSt):
$\mathrm{SS}t=\frac{\sum Y_{i_.}{ }^2}{r}-C F=\frac{(88964)^2+\dots+(140961)^2}{12}-\mathrm{CF}=15645046770$
Step 7. Calculate the Error SS (SSE):
$\mathrm{SSE}=\mathrm{SST}-\mathrm{SSB}-\mathrm{SSt}=43015337905$
Step 8. Complete analysis of variance table for this experiment (explained in the Results section)
Table 2. Actual information on the number of coronavirus infections for the year 2020 for some Arab countries (Bahrain, Iraq, Kuwait, Egypt, Jordan)
|
Replication R=N |
Bahrain A |
Iraq B |
Kuwait C |
Egypt D |
Jordan E |
|
1 |
2356 |
24199 |
3792 |
6034 |
45307 |
|
2 |
5142 |
79802 |
17089 |
8165 |
145001 |
|
3 |
11044 |
112343 |
20769 |
4297 |
59257 |
|
4 |
18848 |
127113 |
19932 |
4352 |
8083 |
|
5 |
10819 |
109914 |
18107 |
4970 |
775 |
|
6 |
14516 |
74112 |
21005 |
27003 |
63 |
|
7 |
15446 |
40972 |
19332 |
43305 |
394 |
|
8 |
7872 |
4176 |
22452 |
18181 |
283 |
|
9 |
2406 |
1373 |
3474 |
4659 |
183 |
|
10 |
477 |
623 |
221 |
608 |
0 |
|
11 |
38 |
7 |
45 |
1 |
0 |
|
12 |
0 |
0 |
0 |
0 |
0 |
|
Total |
88964 |
574634 |
146218 |
121575 |
259346 |
|
Mean |
7,413.7 |
47,886.2 |
12,184.8 |
10,131.25 |
21,612.2 |
Table 3. Actual details on the quantity of coronavirus infections in 2020 for some Arab countries (Lebanon, Libya, Oman, Qatar)
|
Replication R=N |
Lebanon F |
Libya G |
Oman H |
Qatar K |
Total |
|
1 |
19576 |
8349 |
2756 |
2313 |
114682 |
|
2 |
47415 |
21802 |
9050 |
6305 |
339771 |
|
3 |
41152 |
26614 |
15849 |
6810 |
298135 |
|
4 |
21507 |
20591 |
13041 |
6958 |
240425 |
|
5 |
12536 |
10201 |
6385 |
8115 |
181822 |
|
6 |
2589 |
2460 |
40099 |
15354 |
197201 |
|
7 |
554 |
632 |
28637 |
39844 |
189116 |
|
8 |
470 |
69 |
8149 |
42698 |
104350 |
|
9 |
275 |
53 |
2095 |
11871 |
26389 |
|
10 |
443 |
8 |
173 |
693 |
3246 |
|
11 |
3 |
0 |
6 |
0 |
100 |
|
12 |
0 |
0 |
0 |
0 |
0 |
|
Total |
146520 |
90779 |
126240 |
140961 |
1695237 |
|
Mean |
12,210 |
7,564.9 |
10,520 |
11,746.75 |
Table 4. Actual information on the number of coronavirus infections for the year 2020 for some Arab countries (Morocco, Palestine, Saudi – Arabia, Sudan, Tunisia)
|
Replications R=N |
Morocco A |
Palestine B |
Saudi Arabia C |
Sudan D |
Tunisia E |
|
1 |
45806 |
27869 |
2760 |
3759 |
15110 |
|
2 |
138509 |
32046 |
10248 |
3862 |
36438 |
|
3 |
94111 |
14627 |
12693 |
159 |
42408 |
|
4 |
59784 |
21052 |
19366 |
417 |
13720 |
|
5 |
38140 |
14225 |
40602 |
1693 |
2171 |
|
6 |
10969 |
12395 |
87783 |
2238 |
342 |
|
7 |
4510 |
1817 |
103052 |
4458 |
96 |
|
8 |
3459 |
119 |
61982 |
4425 |
96 |
|
9 |
3765 |
392 |
19949 |
369 |
668 |
|
10 |
556 |
115 |
1453 |
6 |
312 |
|
11 |
0 |
0 |
0 |
0 |
0 |
|
12 |
0 |
0 |
0 |
0 |
0 |
|
Total |
399609 |
124657 |
359888 |
21386 |
111361 |
|
Mean |
33300.75 |
10388.08 |
29990.66 |
1782.16 |
9280.08 |
Table 5. Actual information on the number of coronavirus infections for the year 2020 for some Arab countries (Yemen, Syria, United Arab – Emirates)
|
Replications R=N |
Yemen F |
Syria G |
United Arab Emirates H |
Total |
|
1 |
6 |
1369 |
17196 |
113875 |
|
2 |
14 |
2114 |
36245 |
259476 |
|
3 |
28 |
1535 |
38418 |
203979 |
|
4 |
82 |
1445 |
23400 |
139266 |
|
5 |
227 |
1965 |
9184 |
108207 |
|
6 |
598 |
469 |
12260 |
127054 |
|
7 |
818 |
147 |
14350 |
129248 |
|
8 |
304 |
79 |
21967 |
92431 |
|
9 |
6 |
33 |
11318 |
36500 |
|
10 |
0 |
10 |
590 |
3042 |
|
11 |
0 |
0 |
17 |
17 |
|
12 |
0 |
0 |
0 |
0 |
|
Total |
2083 |
9166 |
184945 |
1213095 |
|
Mean |
173.58 |
763.8 |
15,412.08 |
Step 1. Statistical hypothesis for replications:
H0: All replicate (the number of infections in different months of the year) means are equal.
HA: At least one of the replicates (the number of infections in different months of the year) means is different from the others
Step 2. Statistical hypothesis for treatments:
H0: All treatment (the infections of selected countries are being studied) means are equal.
HA: At least one of the treatments (the infections of selected countries are being studied) means is different from the others.
Step 3. Calculate the Correction Factor (CF):
$\mathrm{CF}=\frac{\left(Y_{\mathrm{F}}\right)^2}{r t}=\frac{(1213095)^2}{(8)(12)}=15329161240$
Step 4. Calculate the Total SS (SST):
$\begin{gathered}S S T=\sum Y^2{ }_{i j}-\mathrm{CF}=(458062313)^2+\cdots(0)^2-C F =56016876687\end{gathered}$
Step 5. Calculate the Block SS (SSB):
$\mathrm{SSB}=\frac{\sum Y_{. j}^2}{t}-C F=\frac{(113875)^2+\cdots(17)^2}{8}-C F=9138248070$
Step 6. Calculate the Treatment SS (SSt):
$\mathrm{SSt}=\frac{\sum Y_{i_i}{ }^2}{r}-C F=\frac{(399609)^2+\cdots(184945)^2}{12}-C F=13995649915$
Step 7. Calculate the Error SS (SSE):
$\mathrm{SSE}=\mathrm{SST}-\mathrm{SSB}-\mathrm{SSt}=32882978702$
Step 8. Complete analysis of variance table for this experiment (explained in the Results section)
Table 6. Tukey's analysis of coronavirus data for some Arab countries (Bahrain, Iraq, Kuwait, Egypt, Jordan, Lebanon, Libya, Oman, Qatar)
|
The Difference Between the Average Infections |
$\overline{{M_i}}-\overline{M_J}$ |
Tukey’s Statistics $\mathbf{T}_\alpha$ |
Conclusion |
|
|A - G| |
151.2 |
29103 |
Not Sig. |
|
|A - D| |
2717.55 |
29103 |
Not Sig. |
|
|A - H| |
3106.3 |
29103 |
Not Sig. |
|
|A - K| |
4333.05 |
29103 |
Not Sig. |
|
|A - C| |
4771.1 |
29103 |
Not Sig. |
|
|A - F| |
4796.3 |
29103 |
Not Sig. |
|
|A - E| |
14198.5 |
29103 |
Not Sig. |
|
|A - B| |
40472.5 |
29103 |
Sig. |
|
|G - D| |
2566.35 |
29103 |
Not Sig. |
|
|G - H| |
2955.1 |
29103 |
Not Sig. |
|
|G - K| |
4181.85 |
29103 |
Not Sig. |
|
|G - C| |
4619.9 |
29103 |
Not Sig. |
|
|G - F| |
4645.1 |
29103 |
Not Sig. |
|
|G - E| |
14047.3 |
29103 |
Not Sig. |
|
|G - B| |
40321.3 |
29103 |
Sig. |
|
|D - H| |
388.75 |
29103 |
Not Sig. |
|
|D - K| |
1615.5 |
29103 |
Not Sig. |
|
|D - C| |
2053.55 |
29103 |
Not Sig. |
|
|D - F| |
2078.75 |
29103 |
Not Sig. |
|
|D - E| |
11480.95 |
29103 |
Not Sig. |
|
|D - B| |
37754.95 |
29103 |
Sig. |
|
|H - K| |
1226.75 |
29103 |
Not Sig. |
|
|H - C| |
1664.8 |
29103 |
Not Sig. |
|
|H - F| |
1690 |
29103 |
Not Sig. |
|
|H - E| |
11092.2 |
29103 |
Not Sig. |
|
|H - B| |
37366.2 |
29103 |
Sig. |
|
|K - C| |
438.05 |
29103 |
Not Sig. |
|
|K - F| |
463.25 |
29103 |
Not Sig. |
|
|K - E| |
9865.45 |
29103 |
Not Sig. |
|
|K - B| |
36139.45 |
29103 |
Sig. |
|
|C - F| |
25.2 |
29103 |
Not Sig. |
|
|C - E| |
9427.4 |
29103 |
Not Sig. |
|
|C - B| |
35701.4 |
29103 |
Sig. |
|
|F - E| |
9402.2 |
29103 |
Not Sig. |
|
|F - B| |
35676.2 |
29103 |
Sig. |
|
|E - B| |
26274 |
29103 |
Not Sig. |
Table 7. The result of a Tukey test analysis of coronavirus data for some Arab countries (Bahrain, Iraq, Kuwait, Egypt, Jordan, Lebanon, Libya, Oman, Qatar)
|
Treatments |
Means |
|
A (Bahrain) |
7413 a |
|
G (Libya) |
7564.9 a |
|
D (Egypt) |
10131.25 a |
|
H (Oman) |
10520 a |
|
K (Qatar) |
11746.75 a |
|
C (Kuwait) |
12184.8 a |
|
F (Lebanon) |
12210 a |
|
E (Jordan) |
21612.2 ab |
|
B (Iraq) |
47886.2 b |
The test steps are shown in the Tables 6 and 7 in the next section. The Tukey test statistic can be calculated as follows:
$\begin{gathered}T_\alpha=q_\alpha(p, f) \sqrt{\frac{M S E}{r}} \\ T_{0.05}=q_{0.05}(9,88) \sqrt{\frac{488810658}{12}}=29103.28 \approx 29103\end{gathered}$
The test steps are shown in the Tables 8 and 9 in the next section. The Tukey test statistic can be calculated as follows:
$\begin{gathered}T_\alpha=q_\alpha(p, f) \sqrt{\frac{M S E}{r}} \\ T_{0.05}=q_{0.05}(8,77) \sqrt{\frac{427051671.4}{12}}=26260.3 \approx 26260\end{gathered}$
Table 8. Tukey's analysis of coronavirus data for some Arab countries (Morocco, Palestine, Saudi Arabia, Sudan, Tunisia, Yemen, Syria, and the Emirates)
|
The Difference Between the Average Infections |
$\overline{{M_i}}-\overline{M_J}$ |
Tukey’s Statistics $\mathbf{T}_\alpha$ |
Conclusion |
|
|F - G| |
590.22 |
26260 |
Not Sig. |
|
|F - D| |
1608.58 |
26260 |
Not Sig. |
|
|F - E| |
9106.5 |
26260 |
Not Sig. |
|
|F - B| |
10214.5 |
26260 |
Not Sig. |
|
|F - H| |
15238.5 |
26260 |
Not Sig. |
|
|F - C| |
29817.08 |
26260 |
Sig. |
|
|G - D| |
1018.36 |
26260 |
Not Sig. |
|
|G - E| |
8516.28 |
26260 |
Not Sig. |
|
|G - B| |
9624.28 |
26260 |
Not Sig. |
|
|G - H| |
14648.28 |
26260 |
Not Sig. |
|
|G - C| |
29226.86 |
26260 |
Sig. |
|
|D - E| |
7497.92 |
26260 |
Not Sig. |
|
|D - B| |
8605.92 |
26260 |
Not Sig. |
|
|D - H| |
13629.92 |
26260 |
Not Sig. |
|
|D - C| |
28208.5 |
26260 |
Sig. |
|
|E - B| |
1108 |
26260 |
Not Sig. |
|
|E - H| |
6132 |
26260 |
Not Sig. |
|
|E - C| |
20710.58 |
26260 |
Not Sig. |
|
|E - A| |
24020.67 |
26260 |
Not Sig. |
|
|B - H| |
5024 |
26260 |
Not Sig. |
|
|B - C| |
19602.58 |
26260 |
Not Sig. |
|
|B - A| |
22912.67 |
26260 |
Not Sig. |
|
|H - C| |
14578.58 |
26260 |
Not Sig. |
|
|H - A| |
17888.67 |
26260 |
Not Sig. |
|
|C - A| |
3310.09 |
26260 |
Not Sig. |
Table 9. The result of a Tukey test analysis of coronavirus data for some Arab countries (Morocco, Palestine, Saudi Arabia, Sudan, Tunisia, Yemen, Syria, and the Emirates)
|
Treatments |
Means |
|
F (Yemen) |
173.58 a |
|
G (Syria) |
763.8 ab |
|
D (Sudan) |
1782.16 ab |
|
E (Tunisia) |
9280.08 ab |
|
B (Palestine) |
10388.08 ab |
|
H (Emirates) |
15412.08 ab |
|
C (Saudi Arabia) |
29990.66 |
|
A (Morocco) |
33300.75 |
In this section, we include the results we obtained from the previous section, the randomized complete block design, and Tukey's selection analysis, in addition to the graph of the real data used in the research.
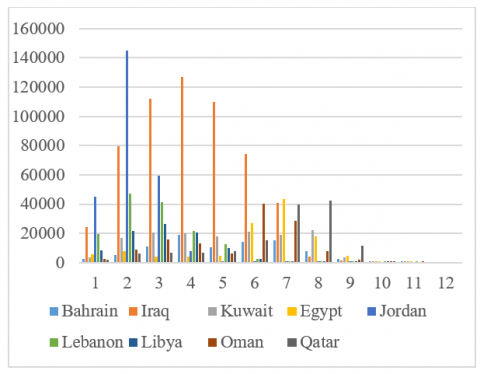
Figure 1 displays the number of coronavirus infections for a few of the chosen Arab nations under investigation., which are Bahrain, Iraq, Kuwait, Egypt, Jordan, Lebanon, Libya, Oman, and finally Qatar. The country with the highest number of infections with the Corona virus in months (January and February) is Jordan, the country with the highest number of infections with the Corona virus in months (March, April, May and June) is Iraq, the country with the highest number of infections with the Corona virus in month (July) is Egypt. The country with the highest number of infections with the Corona virus in months (August, September and October) is Qatar and the country with the highest number of infections with the Corona virus in months (November) is Kuwait.
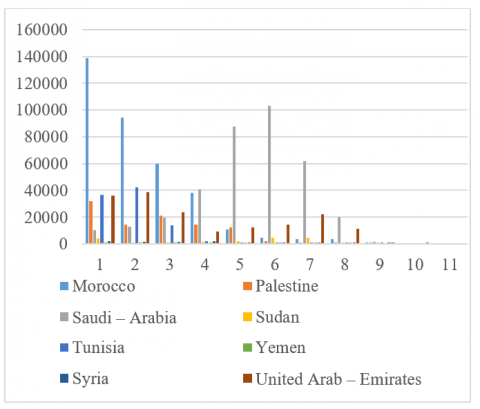
Figure 2 shows the number of infections with the Corona virus for some of the selected Arab countries under study, which are Morocco, Palestine, Saudi Arabia, Sudan, Tunisia, Yemen, Syria, and finally the Emirates. The country with the highest number of infections with the Corona virus in months (January, February, March and April) is Morocco, the country with the highest number of infections with the Corona virus in months (May, June, July, August, September and October) is Saudi Arabia, the country with the highest number of infections with the Corona virus in month (November) is United Arab-Emirates.
Figure 1. Data on the distribution of coronavirus infections in a few Arab nations (Bahrain, Iraq, Kuwait, Egypt, Jordan, Lebanon, Libya, Oman, Qatar)
Figure 2. Data on the number of coronavirus infections distributed among some Arab countries (Morocco, Palestine, Saudi Arabia, Sudan, Tunisia, Yemen, Syria, and the Emirates)
Table 10. Variance analysis table for the number of Coronavirus infections for some Arab countries (Bahrain, Iraq, Kuwait, Egypt, Jordan, Lebanon, Libya, Oman, Qatar)
|
S.O.V. |
df |
SS |
MS |
Fcalcu. |
|
Block (reps) |
11 |
17234158790 |
1566741708 |
3.205212 |
|
Treatment |
8 |
15645046770 |
1955630846 |
4.000794 |
|
Error |
88 |
43015337905 |
488810658 |
|
|
Total |
107 |
75894543465 |
|
Table 11. Variance analysis table for the number of Coronavirus infections for some Arab countries (Morocco, Palestine, Saudi Arabia, Sudan, Tunisia, Yemen, Syria, and the Emirates)
|
S.O.V. |
df |
SS |
MS |
Fcalcu. |
|
Block (reps) |
11 |
9138248070 |
830749824 |
1.945314537 |
|
Treatment |
7 |
13995649915 |
1999378559 |
4.681818836 |
|
Error |
77 |
32882978702 |
427051671.4 |
|
|
Total |
95 |
56016876687 |
|
Since Fcalcu. (3.205) >Ftab. at the 95% (1.8991) levels of confidence, we reject H0 (that means there are significant differences between the number of infections in different months of the year) Also Fcalcu. (4.0008)>Ftab At the 95% (2.0454) levels of confidence, we reject H0 (that means there are significant differences between infections of selected countries are being studied).
Since Fcalcu. (1.945)>Ftab. at the 95% (1.915) levels of confidence we reject H0 (that means there are significant differences between the number of infections in different months of the year). Since Fcalcu. (4.681)>Ftab. at the 95% (2.13099) levels of confidence, we reject H0 (that means there are significant differences between infections of selected countries are being studied).
When doing a Tukey test study to ascertain if there are any noteworthy variations in the quantity of coronavirus infections across many chosen nations (Bahrain, Iraq, Kuwait, Egypt, Jordan, Lebanon, Libya, Oman, Qatar), it was found that there is a very a discernible and noteworthy variation in the quantity of coronavirus infections. Iraq's coronavirus infection rate in comparison to that of other nations like Bahrain, Libya, Egypt, Oman, Qatar, Kuwait, and Lebanon only.
Once again, Tables 10-11 show that the number of infections in Iraq is clearly significantly different from the rest of the countries under study (Bahrain, Iraq, Kuwait, Egypt, Jordan, Lebanon, Libya, Oman, Qatar). The lowercase letter (a) indicates that there are no significant differences, while the letter (b) indicates that there are significant differences. As for (ab), it indicates that there is a difference in the number of infections from other countries, but it is not significant.
When conducting a Tukey test analysis to determine the presence or absence of significant differences in the number of infections with the Corona virus between a number of selected countries (Morocco, Palestine, Saudi Arabia, Sudan, Tunisia, Yemen, Syria, and the Emirates), it was found that there is a very clear significant difference between the number of infections with the Corona virus in Saudi Arabia compared to the number of infections in other countries such as Yemen, Syria, and Sudan only.
Once again, the table above shows that the number of infections in Saudi Arabia and Morocco are clearly significantly different from the rest of the countries under study (Morocco, Palestine, Saudi Arabia, Sudan, Tunisia, Yemen, Syria, and the Emirates). The lowercase letter (a) indicates that there are no significant differences, while the letter (b) indicates that there are significant differences. As for (ab), it indicates that there is a difference in the number of infections from other countries, but it is not significant.
The conclusions we reached are the following points:
1. From the graphs, the total number of coronavirus infections within a given year 2020 in Morocco comes in first place, Saudi Arabia in second place and finally the UAE in third place when compared with the number of infections in a group of selected Arab countries (Palestine, Sudan, Tunisia, Yemen, Syria).Also, among the number of infections in Arab countries (Bahrain, Iraq, Kuwait, Egypt, Jordan, Lebanon, Libya, Oman, Qatar), we found that the number of infections with the Corona virus for the year 2020 is the highest and ranked first in Iraq, Jordan ranked second, and Jordan ranked third.
2. An analysis of a randomized complete block design of a number of Coronavirus infections in a group of selected Arab countries under study showed, generally, that the number of illnesses in various nations varies significantly. In addition, there are significant differences in the number of infections between the months of 2020 for each of the selected Arab countries under study.
3. From the Tukey's honest significance test, there is a very clear significant difference between the number of infections with the Corona virus. Corona in Iraq compared to the number of infections in other countries such as Bahrain, Libya, Egypt, Oman, Qatar, Kuwait, and Lebanon only. Also, there is a very clear significant difference between the number of infections with the Corona virus in Saudi Arabia compared to the number of infections in other countries such as Yemen, Syria, and Sudan only.
[1] Alkutubi, H., Abod, R., Jabber, O. (2022). Statistical analysis of the number of infections with corona virus in some Arab countries using the method of least significant difference. Journal of Kufa for Mathematics and Computer, 9(2): 38-52. https://doi.org/10.31642/JoKMC/2018/090205
[2] Alkutubi, H. (2022). A statistical study on the significant differences in the number of infections with the corona virus for some Arab countries based on the Tukey test and the Scheffe test. Journal of Kufa for Mathematics and Computer, 9(2): 53-62. http://doi.org/10.31642/JoKMC/2018/090206
[3] Cabal, M.R., Noreña, L.G., Montoya, O.D., Hincapie, D., Caicedo, B.C. (2024). Optimal design of helical springs using metaheuristic techniques. Mathematical Modelling of Engineering Problems, 11(10): 2595-2605. https://doi.org/10.18280/mmep.111001
[4] Abdulhafedh, A. (2023). Analyzing the impact of age and gender on COVID-19 deaths using two-way ANOVA. Open Access Library Journal, 10(1): 1-17. https://doi.org/10.4236/oalib.1109658
[5] Martin, B. (2000). An Introduction to Medical Statistics. Oxford University Press.
[6] Kabylbekova, B., Vysotskaya, N., Anarbayev, A., Spabekova, R., Kurbanbekov, K., Khussanov, Z., Kaldybekova, G. (2024). Role of heat carrier components in the formation of corrosion and scale deposits in the pipes of heat supply systems. Mathematical Modelling of Engineering Problems, 11(10): 2731-2739. https://doi.org/10.18280/mmep.111015
[7] Kadham, S.M. (2024). Acute interstitial pneumonia image enhancement using fuzzy partial transforms. Applied Geomatics, 16(1): 35-39. https://doi.org/10.1007/s12518-023-00509-8
[8] Mustafa, M.A., Kadham, S.M., Abbass, N.K., Karupusamy, S., Jasim, H.Y., Alreda, B.A., Mashhadani, Z.A., AL-Hussein, W.R.A., Ahmed, M.T. (2024). A novel fuzzy M-transform technique for sustainable ground water level prediction. Applied Geomatics, 16(1): 9-15. https://doi.org/10.1007/s12518-022-00486-4
[9] Myers, E.R., Silva, S.G., Hafley, G., Kunselman, A.R., Nestler, J.E., Legro, R.S., National Institute of Child Health and Human Development Reproductive Medicine Network. (2005). Estimating live birth rates after ovulation induction in polycystic ovary syndrome: Sample size calculations for the pregnancy in polycystic ovary syndrome trial. Contemporary Clinical Trials, 26(3): 271-280. https://doi.org/10.1016/j.cct.2005.01.006
[10] Lynd, L.D., O'brien, B.J. (2004). Advances in risk-benefit evaluation using probabilistic simulation methods: An application to the prophylaxis of deep vein thrombosis. Journal of Clinical Epidemiology, 57(8): 795-803. https://doi.org/10.1016/j.jclinepi.2003.12.012
[11] Amir, E., Seruga, B., Niraula, S., Carlsson, L., Ocaña, A. (2011). Toxicity of adjuvant endocrine therapy in postmenopausal breast cancer patients: A systematic review and meta-analysis. Journal of the National Cancer Institute, 103(17): 1299-1309. https://doi.org/10.1093/jnci/djr242
[12] Pitrou, I., Boutron, I., Ahmad, N., Ravaud, P. (2009). Reporting of safety results in published reports of randomized controlled trials. Archives of Internal Medicine, 169(19): 1756-1761. https://doi.org/10.1001/archinternmed.2009.306
[13] Lagier, J.C., Million, M., Cortaredona, S., Delorme, L., Colson, P., Fournier, P.E., Brouqui, P., Raoult, D., Parola, P., IHU Task Force. (2022). Outcomes of 2111 COVID-19 hospitalized patients treated with hydroxychloroquine/azithromycin and other regimens in Marseille, France, 2020: A monocentric retrospective analysis. Therapeutics and Clinical Risk Management, 18: 603-617. https://doi.org/10.2147/TCRM.S364022
[14] Pickover, A.M., Messina, B.G., Correia, C.J., Garza, K. B., Murphy, J.G. (2016). A behavioral economic analysis of the nonmedical use of prescription drugs among young adults. Experimental and Clinical Psychopharmacology, 24(1): 38-47. https://doi.org/10.1037/pha0000052
[15] Amlung, M., Morris, D.H., Hatz, L.E., Teeters, J.B., Murphy, J.G., McCarthy, D.M. (2016). Drinking-and-driving–related cognitions mediate the relationship between alcohol demand and alcohol-impaired driving. Journal of Studies on Alcohol and Drugs, 77(4): 656-660. https://doi.org/10.15288/jsad.2016.77.656
[16] Lee, C.A., Derefinko, K.J., Milich, R., Lynam, D.R., DeWall, C.N. (2017). Longitudinal and reciprocal relations between delay discounting and crime. Personality and Individual Differences, 111: 193-198. https://doi.org/10.1016/j.paid.2017.02.023
[17] Hashim, L.H., Dreeb, N.K., Hashim, K.H., Shiker, M.A. (2021). An application comparison of two negative binomial models on rainfall count data. Journal of Physics: Conference Series, 1818(1): 012100. https://doi.org/10.1088/1742-6596/1818/1/012100
[18] Kadhim, H.J., Shiker, M.A., Al-Dallal, H.A. (2021). A new technique for finding the optimal solution to assignment problems with maximization objective function. Journal of Physics: Conference Series, 1963(1): 012104. https://doi.org/10.1088/1742-6596/1963/1/012104
[19] Vrat, P., Kriengkrairut, C. (1986). A goal programming model for project crashing with piecewise linear time-cost trade-off. Engineering Costs and Production Economics, 10(2): 161-172. https://doi.org/10.1016/0167-188X(86)90010-8
[20] Dwail, H.H., Mahdi, M.M., Shiker, M.A. (2022). CG method with modifying βk for solving unconstrained optimization problems. Journal of Interdisciplinary Mathematics, 25(5): 1347-1355. https://doi.org/10.1080/09720502.2022.2040854
[21] Dreeb, N.K., Hashim, L.H., Hashim, K.H., Shiker, M.A. (2021). Using a new projection approach to find the optimal solution for nonlinear systems of monotone equation. Journal of Physics: Conference Series, 1818(1): 012101. https://doi.org/10.1088/1742-6596/1818/1/012101
[22] DePorter, E.L., Ellis, K.P. (1990). Optimization of project networks with goal programming and fuzzy linear programming. Computers & Industrial Engineering, 19(1-4): 500-504. https://doi.org/10.1016/0360-8352(90)90168-L