Wissam A. Kidder*![]() | Shamil A. Behaya
| Shamil A. Behaya![]()
© 2025 The authors. This article is published by IIETA and is licensed under the CC BY 4.0 license (http://creativecommons.org/licenses/by/4.0/).
OPEN ACCESS
Structural failure is one of the maximum essential reasons of collapse inside the embankment dams due to the float of water from the reservoir on the upstream of the dam via the dam segment closer to downstream. In order to keep away from or manage this phenomenon and treat it, we want to investigate the manner of float and calculate the amount of seepage water from the dam's frame via using one of the no longer unusual strategies known, which might be often long and hard and want precise gear. Two mathematical equations have been prepared to discover each the seepage discharge and the intensity of water emerging from the middle in zoned earth fill dams with a willing core without a doubt and quick. Statistical strategies have been used for a database produced by way of numerical approach (finite detail technique) for a fixed formed of two hundred fashions of zoned earth fill dams with two shapes of inclined middle (forward or backward). Observed models were prepared with dimensions and properties in accordance with the recommended safe boundary limits to ensure the safety of stability of slopes or sliding and scouring of the dam in the construction designs of this type of dams. These equations showed high performance in predicting both the seepage discharge amount and the depth of water emerging from the middle while tested and evaluating their consequences with different analysis methods effects with a correlation coefficient r2 equal to 97.3% and 89.5% for each of them, respectively.
seepage, inclined core, zoned earth fill dam, finite elements, multiple nonlinear regression
Many embankments dams’ failure had been reported due to constant and transient seepage and side slope scouring and sliding developed during rising and falling of reservoir water table. In order to stop water from reaching the downstream slope, a great lot of study has been done on seepage analysis and dam stability. To clear out drains and impermeable middle drains are used to lower the phreatic line and disperse excessive pore water strain. One of the widely used approaches, which are frequently time-consuming and require specific equipment may be used to analyze seepage for the glide method and decide how tons water seeps from the dam's frame.
The aim is to discuss the results obtained from the observation to identify the change in water seepage quantities, phreatic line shape and stability of the dam with the different changes that were made to the dam, core and filter.
Furthermore, the purpose is also to increase brief estimation empirical equations for both the seepage discharge amount and the height of water stage out of the variety shapes of the significant core by using the use of statistical techniques of a couple of nonlinear regressions. Dams are indispensable structures for storing water supplies, facilitating irrigation needs, controlling floods, and producing electricity. However, dam screw ups may have catastrophic repercussions, bringing about lack of human lifestyles, property harm, and environmental degradation. One of the primary reasons of dam failure is seepage, which transpires when water percolates via the dam's frame and foundation. Seepage can lead to erosion, instability, and in the end, the fall apart of the dam. Consequently, it's miles actually critical to because it must be predicting seepage to make sure the safety and balance of dams. Seepage exam is a crucial detail of dam format and operation. Traditional methods for seepage examination are often complex, time-consuming, and require specialized equipment. These methods may not be feasible for all dam undertakings, especially for small or medium-sized dams. Furthermore, the precision of seepage exam is relatively reliant at the first-class of enter records, which can be tough to reap in exercise. The accurate prediction of seepage is indispensable for ensuring the safety and stability of dams. Seepage examination can help identify potential issues and prevent dam failure. Moreover, seepage examination can optimize dam layout and operation, reducing the risk of seepage-related problems and enhancing the dam's overall performance.
Hasani et al. [1] investigated the Ilam earth dam, which functions a crucial clay middle, using SEEP/W to evaluate the effect of mesh kind and scale on typical flow charge. Mohammadi et al. [2] optimized the geometry of the Birjand Hesar Sangi earth dam, which features a central core, using SEEP/W. Jamel [3] used an artificial neural network (ANN) to verify the SEEP/W model's estimates of seepage quantity in a homogenous earth dam without a filter. The results were compared to the solutions provided by Casagrande and Dupuit. Khassaf and Madhloom [4] used SLIDE V.5.0 software to investigate seepage parameters in the centrally located Khassa Chai earth dam, focusing on varying core permeabilities and thicknesses. When Li et al. [5] used the ABAQUS finite element software to analyze the seepage of a clay core wall dam and the steady seepage condition under saturated-unsaturated conditions is simulated, they found out that the result from the GeoStudio software were the same as the ABAQUS. The experimental model was used to validate the numerical analysis. Shakir [6] utilized a finite element model to investigate seepage quantities and free surface positioning concerning varying core permeability, thickness, and location for a zoned earth dam with two core types: an inclined upstream core and a vertical low permeability core. Fakhari and Ghanbari [7] employed SEEP/W to test an embankment dam, considering two distinct core types: a vertical core and an inclined core towards the upstream side. They assessed the influences of reservoir water elevation, dam crest width, and primary core angle. Li and Liu [8] examined consistent-country and temporary seepage via a cored dam the use of Seep/W. Salem et al. [9] conducted experimental studies to analyze seepage through earth dams with internal cores. They examined the effects of core hydraulic conductivity, width, base thickness, and penetration on earth dams with and without internal cores. Their research combined experimental approaches and numerical simulations using SEEP/W to verify the experimental models. Using GeoStudio software, Zahedi and Aghazani [10] investigated earth-fill dams with diaphragm, vertical, and inclined core types, analyzing different slopes and geometries. Their study focused on seepage behavior through the dam body and the impact of core anisotropy. Jamel [3] used SEEP/W to research seepage volumes via a cored earth dam, thinking about varied upstream and downstream slopes for the dam and center. Kheiri et al. [11] investigated an embankment dam with center, cutoff wall and horizontal drain using SEEP/W, comparing cutoff wall placement and intensity influences on sub-dam seepage. Salmasi et al. [12] evaluated and contrasted vertical and upstream-inclined cores employing SEEP/W to simulate seepage and hydraulic gradients of a zoned earth dam presenting a clay middle. To probe numerous earthen dam seepage traits-homogeneous, zoned with transition filter and diaphragm with impermeable rock core Sazzad and Alam [13] used SEEP/W. As reported by Zedan et al. [14], the finite element approach changed into used for the cause of reading the stability of the Sharin Earthen Dam underneath various conditions the use of the Geostudio application The outcomes were that developing the permeability of the quilt layer leads to a lower in the outlet gradient and a boom within the permeability within the dam body. Finally, Aziz et al. [15] studied the effect of the shape of the middle on the stability of the lateral slope of the earth dam come to be the usage of the Slide 6 software program to take a look at the factor of protection of the lateral slopes of the dam. The results showed that with the useful resource of developing the lateral slopes of the middle and the top width of the dam, the thing of safety decreases [15]. Yousif [16] studied the seepage assessment thru Al-Adhaim dam by means of using the finite factors GeoSlope software program, he studied unique parameters that might manipulate the seepage and exit gradient inside the dam with the aid of the use of removing the middle, changing the center region, converting filters places and thicknesses. Studied the assessment achieved on Bhimdi earth dam that is a 21 m excessive (Maharashtra State) through converting one-of-a-type parameters which include changing berm width, role of clear out drains by using the use of the usage of Geo-Slope software program [17]. Both ANN and the ANSYS software program were used to find out the maximum quantity of strain hydrodynamic pressures because of earthquake, in which the consequences had an excessive records accuracy, through considering the effect of soil, dam and reservoir [18]. Evaluated the safety element inside the Karolinka dam's frame and foundation. Also, they studied the consequences of dam top on the dam's stability. The have a look at emerge as accomplished thru using the finite detail approach in Plaxis 3D software application. The acquired numerical outcomes show an exquisite agreement with the determined information [19]. Studied the behavior of seepage in the course of a homogeneous earthen dam with clay center changed into the usage of distinct engineering situations. The have a examine become finished the use of Slide v6 application. In this observe, three certainly one of a kind dam height, 3 notable upstream blanket lengths with 4 one-of-a-kind blanket thicknesses and 4 super cutoff depth were hired and the findings located out that the tempo of the drainage declined with the upstream blanket period, cutoff intensity, and blanket thickness expanded. In addition, the have an impact on of the upstream blanket period is better than the cutoff depth. During this, the price of filtering has become more advantageous with decrease pinnacle breadth of the dam [20].
His studies objectives to broaden sincere and expeditious equations for predicting seepage discharge and intensity of water emerging from the core in zoned earth-fill dams with an angled middle. The have a look at employs a statistical technique and synthetic neural networks (ANNs) to analyze the glide method and calculate seepage discharge and depth of water emerging from the core. The proposed equations can be used for the initial design and analysis of zoned earth-fill dams, minimizing the need for complicated and time-ingesting techniques. The findings of the examine can make contributions to enhancing the protection and balance of dams, preventing capacity screw ups, and optimizing dam layout and operation.
1.1 Numerical solution
Two numerical techniques have been extensively employed in stability evaluation: the Finite Difference Method (FDM) and the Finite Element Method (FEM). FDM is normally the primary numerical approach applied for fixing devices of differential equations, wherein preliminary and/or boundary values are given, and each spinoff within the governing equations is changed by using the usage of an algebraic expression formulated in phrases of field variables (e.G., pressure or displacement) at discrete spatial points, leaving those variables undefined within elements. FLAC (Fast Lagrangian Analysis of Continua), one of the set up software program applications applied in slope stability analysis, is rooted in the FDM. Despite being derived thru special methodologies, each FDM and FEM yield distinctly similar consequences.
1.2 Analytical solution
The seepage characteristics of diverse earth dam types, such as homogeneous, zoned with transition filters, and diaphragms with impervious rock cores, had been tested by means of Sazzad and Asmaa Jamel. ANN is employed to validate the accuracy of SEEP/W model's predictions concerning the seepage amount in a homogeneous earth dam missing a clean out. The effects have been as compared to Casagrande and Dupuit's answers [13]. Abdel-Kawy discovered that the wedged-shape center is the maximum green in lowering the quantity of seepage because of factors that have an effect on the seepage discharge and the location of the loose floor [20].
1.3 Experimental studies
Irzooki and Jamel investigated the phreatic line and seepage characteristics of a homogeneous earth dam, with and without a horizontal filter, using the Hele-Shaw model. Experiments were conducted using three different viscous oils to simulate varying soil permeabilities. Each soil type was tested with three different downstream slope angles of the dam. Various runs were performed, altering upstream slope, reservoir head, and filter length. The goal was to develop an empirical equation to determine the optimal filter length for mitigating downstream cover. Results indicated that reducing upstream reservoir head, upstream slope, and downstream slope angle increased downstream cover, while reducing filter length had the opposite effect [21]. For Salem, along with other researchers, conducted experimental studies on seepage through earth dams with an internal core. They examined the impact of core permeability, width, base thickness, and penetration, both experimentally and using SEEP/W for numerical validation [9]. Additionally, El-Hazek performed experimental and numerical modeling to study the slope stability and seepage water behavior of earth-fill dams. These studies aimed to enhance the understanding of seepage dynamics and improve dam design and safety [22].
1.4 Statistical studies
It is crucial to layout and optimize the dimensions of a dam's drainage tool to ensure the downstream shell remains dry and to prevent a boom in pore water stress inside the earth dam. A numerical example proved the ease of utilization and alertness of those equations, emphasizing their utility as an additional layout test alongside popular techniques which consist of the glide net method. Mazaheri applied GeoStudio software to model Marvak earth dam with actual cloth parameters, investigating the minimal element of protection by various drainage dimensions, fabric houses, and dam slope. Through neural network schooling on statistics acquired from Marvak dam modeling, they determined the minimal trouble of safety for horizontal drainage. Their findings highlighted the massive impact of internal friction angle of drainage fabric and dam slope at the minimal issue of protection [23]. Heidari used synthetic neural networks (ANN) to model leakage from Shahrchay dam, verifying the version's accuracy. They concluded that specific physical facts approximately the dam come to be vain for the ANN version, and model verification for every piezometer turned into completed completely using multiyear static records on dam frame and water height both upstream and downstream [24].
The method hired encompasses the software of mathematical equations, statistical techniques, and numerical strategies to investigate the movement of water thru the dam and calculate the amount of seepage. The preliminary step within the technique become formulating mathematical equations to determine seepage discharge and the intensity of water emerging from the middle in zoned earth-fill dams presenting a willing center. Development of these equations laid the foundation for objectively predicting key seepage parameters in a standardized manner. Statistical regression analyses and artificial neural networks were then utilized to model the flow process and further refine the estimation equations. These computational techniques facilitated the rigorous analysis needed to reliably correlate input variables with seepage outputs. The proposed methodology thus takes a systematic, quantitative approach integrating diverse analytical methods to accurately characterize seepage behaviors and provide designers with useful predictive tools. Proper implementation of this methodology promises to yield insights that can enhance dam safety and performance. These equations are designed to be simple and quick to use. Next, a database is created using numerical methods and finite element analysis. A set of 200 models of zoned earth fill dams with two shapes of inclined core (forward or backward) are constructed. These models are prepared with dimensions and properties that adhere to recommended safe boundary limits for stability and safety. Statistical techniques, such as multiple nonlinear regression, are then used to analyze the database and determine the efficiency of the equations in predicting seepage discharge and depth of water emerging from the core. The results are in comparison with other analysis strategies to evaluate their accuracy. The method also consists of a evaluation of preceding research on seepage thru earth dams with cores. These researches have used numerous numerical models and software program, together with SEEP W and ABAQUS, to investigate seepage portions and the behavior of the phreatic line. Finally, the methodology consists of the usage of artificial neural community (ANN) methods to evaluate the influence of various variables on seepage float calculations. The weights of every variable, consisting of dam dimensions and fabric homes, are decided the usage of the ANN technique. Overall, the methodology combines mathematical equations, statistical techniques, numerical techniques, and previous studies to investigate the seepage analysis equations for zoned earth-fill dams with a willing middle. The purpose is to provide easy and quick equations for calculating seepage discharge and depth of water rising from the middle while making sure the safety and balance of the dam.
1). Using the Geo Studio (12) program, a SEEP/W model data base for several scenarios, or distinct sets of input-output variables, is being constructed. The range of input variables is chosen in accordance with the constraints of the dam section variables listed in the references for the dam design guideline.
2). Determine the weighted impact of each enter variable at the output variable and the connection between the units of input and output variables the usage of the Artificial Neural Network (ANN) Model in SPSS software program. By contrasting the results of the Geo Studio analysis with the ANN model's results the use of a small quantity of decided on examples that aren't protected within the database that become constructed in the preceding step (1), this model is confirmed. Although The ANN model processing separates the records set into three sub-divisions-training, testing, and holdout (verification) subset-and assesses the model's overall performance the use of the 1/3 subset-which is not applied for estimating model parameters-this verification technique is done to ensure the ANN model can yield results which might be suitable.
3). Use the SPSS software to predict mathematical equations. It does this with the aid of immediately estimating the output variables for a given set of input variables the use of the more than one nonlinear regression approach for the SEEP/W evaluation consequences advanced in step (1) above.
4). Verify these equations to make sure they can provide answers that are appropriate and have a high degree of correlation.
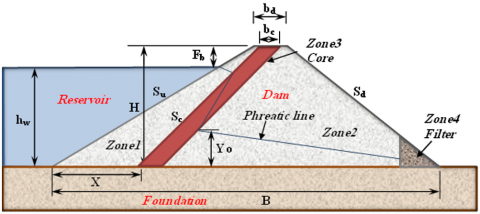
A Group of 200 varied zoned earth fill dam models has inclined cores are established to build the required database. Halve of them has forward-inclined cores and the rest has backward-inclined cores. All dam models were created with varied ranges of properties and dimensions according to the safe boundary limits recommended for side slope stability, sliding, and scouring in embankment construction designs, Figures 1 and 2.
Figure 1. Sketch for zoned earth fill dam models has forward inclined core
Figure 2. Sketch for zoned earth fill dam models has backward inclined core
As shown in two Figures above, there are four zones forming each dam model. Zone 1 and 2 (shell zones) composed of sand soil, zone 3 (inclined core) composed of mixed of sand and 25% of bentonite (clay) soils, and zone 4 (filter) right-angled triangle composed of gravel. Definitions of each variable indicated at the dam section are shown in Table 1.
1)- Appling numerical approach by way of finite element method model (Geo Studio 12 software program) for the fashions to studying the reaction of the dam to one-of-a-kind pass segment and middle dimensions and material homes, and investigating the trade in seepage discharge quantity, phreatic line form, and water stage out middle price. This evaluation includes:
(i) Two dimensional seepage flow problem.
(ii) Predicting the seepage discharge quantity and outflow height of water from core the usage of SEEP/W software program version.
2)- Calibrating the determined models using Artificial Neural Network technique (ANN) (SPSS 26 software) for assertion diverse variable impact thing.
3)- Appling statistical method model using multiple nonlinear regression method (SPSS 26 software) and predict mathematical equations for quick estimation of the seepage discharge quantity and outflow height of water from core.
4)- Verifying mathematical equations by using evaluation with determined database.
Table 1. Adopted dam models’ variables ranges
|
Item |
Range |
Description |
||||
|
Dam |
Total dam height (m) |
20-30 |
H |
20 |
25 |
30 |
|
Dam crest length (m) |
6-9 |
bd |
6 |
7 |
9 |
|
|
Free board (m) |
2-3 |
Fb |
2 |
2.5 |
3 |
|
|
Upstream slope (v:h) |
1:2-1:3 |
Su |
1:2 |
1:2.5 |
1:3 |
|
|
Downstream slope (v:h) |
1:1.5-1:2.5 |
Sd |
1:1.5 |
1:2 |
1:2.5 |
|
|
Dam shell permeability (m/sec) |
10-5-10-3 |
kd |
10-5 |
10-4 |
10-3 |
|
|
Soil type |
Sand |
|||||
|
Core |
Total core height (m) |
20-30 |
H |
20 |
25 |
30 |
|
core crest length (m) |
3-7 |
bc |
3 |
5 |
7 |
|
|
slope of core (v:h) |
1:0.25-1:0.75 |
Sc |
1:0.25 |
1:0.5 |
1:0.75 |
|
|
core permeability (m/sec) |
10-8-10-6 |
kc |
10-8 |
10-7 |
10-6 |
|
|
Core base distance (m) |
25-107 |
x |
25 |
- |
107 |
|
|
Shape of core |
|
Forward inclined |
Backward inclined |
|||
|
Soil type |
Clayey sand |
|||||
|
Filter |
Drain permeability (m/sec) |
0.05 |
kf |
0.05 |
||
|
Drain length (m) |
3 |
lf |
3 |
4 |
5 |
|
|
Drain height (m) |
2 |
hf |
2 |
|||
|
Soil type |
Gravel |
|||||
The study findings highlight the effectiveness of the developed equations in predicting seepage discharge and water depth emerging from the core in zoned earth-fill dams with inclined cores. These equations offer a simple and quick method for these calculations, eliminating the need for complex examinations. High correlation coefficients demonstrate a strong relationship between predicted and actual values, confirming the equations' reliability. Statistical techniques like artificial neural networks identified key variables influencing seepage flow, aiding optimal dam design to ensure stability and prevent failures. These equations serve as valuable tools for engineers and researchers.
4.1 Geo studio application results
It may prove useful to analyze outcomes from modeling the 200 diverse dam cross-sections (100 designs per core geometry) comprising the necessary database for this research. A commonly employed technique in porous medium flow examination is the finite element numerical approach. Using this methodology,
1). Start GeoStudio software
2). Selection seep/w, steady-state analysis type
3). From the drop-down list, choose a draw menu for:
• Draw the dimension of model by line and point order.
• Specify multi region in model.
• Select boundary condition: Head of water in upstream face, zero pressure point in downstream face and potential seepage face.
• By selecting materials, enter the characteristics of each region in terms of permeability and properties of water content W.C (volumetric water content V.W.C, residual water content R.W.C).
• Installations flux section to read the amount of seepage.
4). Starting analysis
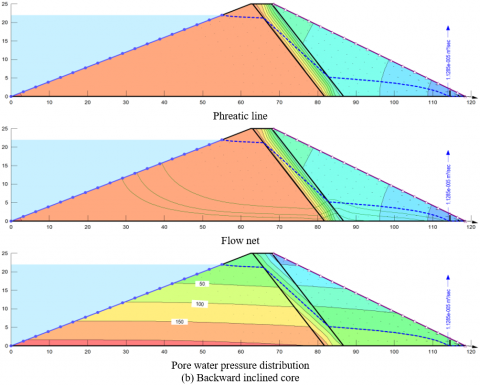
The flow body is segmented into a vast number of small triangular or square elements interconnected via nodes at which flow calculations transpire and are periodically corrected throughout iterations until attaining an acceptable error rate or predetermined iteration count. To expedite recurrent node calculations, dedicated programming or preexisting software designed for this process may be crafted. Geo Studio's (SEEP/W) software was leveraged herein for flow simulation to anticipate individual steady state seepage discharge amounts and phreatic line heights emerging from the dam core across all designs. Figure 3 depicts exemplary graphical yield recorded for two diverse models within this investigation. Capturing and systematically evaluating this large dataset promises insights applicable for refining seepage prediction equations and enhancing dam layout optimization. Proper interpretation of modeling outputs at this scale stands to further scientific understanding of inclined core seepage dynamics.
The input variables which have been adopted were used to create a fixed of 2 hundred models with numerous dimensions and houses. One hundred fashions have square middle and rest fashions have trapezoidal middle. Therefore, to construct a database of inputs and outputs variables portions, every version (case) turned into analyzed using Geo Studio software (SEEP/W) to produce the seepage discharge price and the peak of water degree out of the middle of the dam.
This software used a numerical approach (finite detail) to analyze float in pores media of the dam phase and produce phreatic line and seepage discharge after complete saturation waft. As the Geo Studio's skills of graphical illustration of the results are tremendous, the intensity of the water out of the center downstream may be monitored and record.
1). Models analyzing by Geo Studio software program shows low decrease in seepage discharge quantity for ahead inclined middle shape in examine with backward inclined core form, about 0.03% (Figure 4).
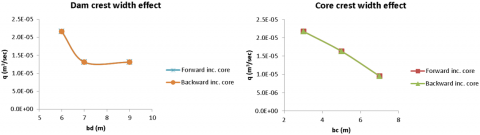
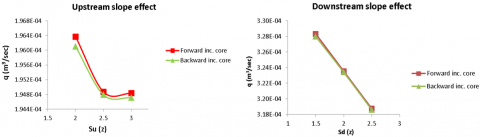
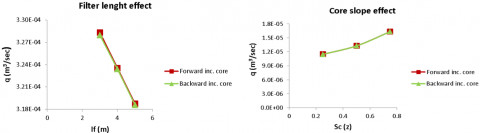
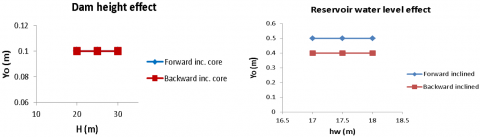
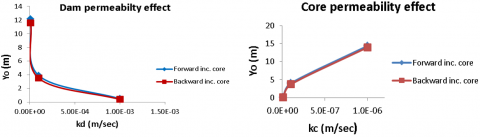
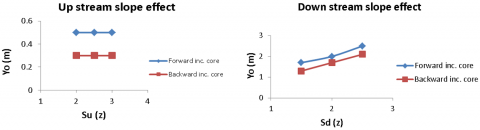
2). Also indicates direct percentage for seepage discharge with all variables (cloth houses and geometry dimensions) except for the width of the center, center slope, and filter out length it become inverse proportion (Figure 5).
3). Moreover, decreasing dam upstream slope or increasing the width of the dam crest reduces considerably the discharge to a certain extent and then its effect ceases.
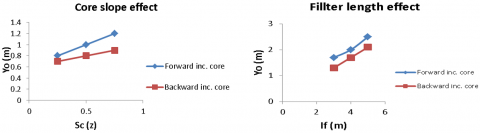
4). In addition, shows direct proportion for height of water emerging from the core with core permeability, dam downstream slope, and core slope, while inverse proportion with dam permeability, core width, and filter length. Nevertheless, effect of the dam height, reservoir water level, Dam crest width, and dam downstream slope were non-existent or almost non-existent.
Figure 3. Examples for Geo Studio software graphical output results
Figure 4. Effect of dam materials properties and dimensions on seepage discharge for two core shapes models
Figure 5. Effect of dam materials properties and dimensions on depth of water emerging from the core for two core shapes models
4.2 The ANN model
IBM SPSS 26 statistics software was leveraged in this study to ascertain the influence magnitude of each input variable on output variables. Independent inputs comprised dimensional and material property representations for the dam cross-sections, while dependent outputs involved seepage discharge and phreatic line quantification via the (ANN) model. The artificial neural network (ANN) model utilizes a pooled dataset as inputs across the input layer denoting autonomous variables, alongside required outputs in the output layer symbolizing reliant variables. The training process first involved selecting activation functions to derive each input vector's weight to intermediate hidden layer(s), along with output vector weights from these layers to the output layer for each variable. Thereupon, predicted error volumes for calculated vis-à-vis necessary outputs. Via learning algorithms, input vector weights were adapted, recalculating outputs and contrasting against needs repetitively until achieving requisite outputs. Following, an exempted dataset verified model accuracy, as exhibited below. Table 2 optimally subdivides the database for training, testing, and holdout groupings for this methodology. Proper interpretation and application of ANN modeling standards the extraction of meaningful predictor influence insights.
Table 2. Case processing summary
|
Process |
Numbers |
Percent % |
|
|
Sample |
Training |
142 |
71.0% |
|
Testing |
37 |
18.5% |
|
|
Holdout |
21 |
10.5% |
|
|
Valid |
200 |
100.0% |
|
|
Excluded |
0 |
|
|
|
Total |
200 |
|
|
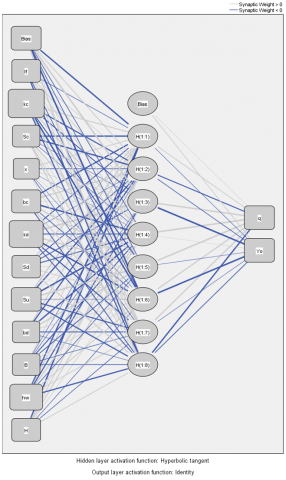
The network of the ANN model formed one hidden layer that includes eight units and a hyperbolic tangent as the default activation function as shown in Table 3. Error analysis for average and overall average error are shown in Table 4 for all three subdivision groups, and the most important is 0.022 for seepage discharge q and 0.055 for depth of phreatic line emerging from the core Yo for the holdout verifying group.
Table 3. Network information
|
Input Layer |
Covariates |
1 |
lf |
|
2 |
kc |
||
|
3 |
Sc |
||
|
4 |
x |
||
|
5 |
bc |
||
|
6 |
kd |
||
|
7 |
Sd |
||
|
8 |
Su |
||
|
9 |
bd |
||
|
10 |
B |
||
|
11 |
hw |
||
|
12 |
H |
||
|
Number of Units |
12 |
||
|
Rescaling Method for Covariates |
Standardized |
||
|
Hidden Layer(s) |
Number of Hidden Layers |
1 |
|
|
Number of Units in Hidden Layer 1a |
8 |
||
|
Activation Function |
Hyperbolic tangent |
||
|
Output Layer |
Dependent Variables |
1 |
q |
|
2 |
Yo |
||
|
Number of Units |
2 |
||
|
Rescaling Method for Scale Dependents |
Standardized |
||
|
Activation Function |
Identity |
||
|
Error Function |
Sum of Squares |
||
Table 4. Model summary
|
Training |
Sum of Squares Error |
4.139 |
|
|
Average Overall Relative Error |
0.031 |
||
|
Relative Error for Scale Dependents |
q |
0.037 |
|
|
Yo |
0.025 |
||
|
Stopping Rule Used |
1 consecutive step(s) with no decrease in error |
||
|
Training Time |
00:00:00.141 |
||
|
Testing |
Sum of Squares Error |
1.864 |
|
|
Average Overall Relative Error |
0.037 |
||
|
Relative Error for Scale Dependents |
q |
0.071 |
|
|
Yo |
0.019 |
||
|
Holdout |
Average Overall Relative Error |
0.029 |
|
|
Relative Error for Scale Dependents |
q |
0.022 |
|
|
Yo |
0.055 |
||
Table 5. Layers parameter estimates
|
Predictor |
Predicted |
||||||||||
|
Hidden Layer 1 |
Output Layer |
||||||||||
|
H(1:1) |
H(1:2) |
H(1:3) |
H(1:4) |
H(1:5) |
H(1:6) |
H(1:7) |
H(1:8) |
q |
Yo |
||
|
Input Layer |
(Bias) |
-.968- |
.220 |
2.923 |
-.119- |
-.123- |
-3.016- |
.009 |
.913 |
|
|
|
lf |
-.081- |
.079 |
.154 |
.140 |
.105 |
-.142- |
.157 |
-.403- |
|
|
|
|
kc |
.330 |
-.407- |
-.279- |
.539 |
-.373- |
-1.574- |
.904 |
-.391- |
|
|
|
|
Sc |
-.818- |
-1.126- |
-.048- |
-.069- |
.649 |
.035 |
.295 |
.518 |
|
|
|
|
x |
.228 |
-.119- |
.074 |
-.019- |
.032 |
-.042- |
-.098- |
.087 |
|
|
|
|
bc |
-.694- |
.733 |
.060 |
-1.595- |
1.551 |
-.124- |
.336 |
-.205- |
|
|
|
|
kd |
-.319- |
-.048- |
3.166 |
-.286- |
.707 |
-1.466- |
-.419- |
-.274- |
|
|
|
|
Sd |
.395 |
-.185- |
-.197- |
-.281- |
.053 |
.168 |
.000 |
.499 |
|
|
|
|
Su |
1.432 |
-.698- |
.023 |
-1.724- |
2.385 |
-.042- |
-.411- |
-.468- |
|
|
|
|
bd |
.375 |
-.599- |
.004 |
-.868- |
1.179 |
.114 |
-.222- |
-.049- |
|
|
|
|
B |
.095 |
-.060- |
-.070- |
-.324- |
-.194- |
.096 |
-.083- |
-.134- |
|
|
|
|
hw |
-.668- |
.388 |
-.450- |
.424 |
-.118- |
.264 |
.168 |
-.598- |
|
|
|
|
H |
-1.453- |
.071 |
.279 |
.358 |
.083 |
-.076- |
-.102- |
.200 |
|
|
|
|
Hidden Layer 1 |
(Bias) |
|
|
|
|
|
|
|
|
.043 |
.142 |
|
H(1:1) |
|
|
|
|
|
|
|
|
.192 |
-.057- |
|
|
H(1:2) |
|
|
|
|
|
|
|
|
-.311- |
-.107- |
|
|
H(1:3) |
|
|
|
|
|
|
|
|
1.334 |
-3.397- |
|
|
H(1:4) |
|
|
|
|
|
|
|
|
1.825 |
.017 |
|
|
H(1:5) |
|
|
|
|
|
|
|
|
1.481 |
-.047- |
|
|
H(1:6) |
|
|
|
|
|
|
|
|
.597 |
-2.86- |
|
|
H(1:7) |
|
|
|
|
|
|
|
|
.625 |
-.049- |
|
|
H(1:8) |
|
|
|
|
|
|
|
|
-.904- |
-.158- |
|
(1). To decide the connection among input and output variables and the have an impact on of every enter variable on the output variable, the SPSS software program changed into used with an Artificial Neural Network (ANN) version. This version become confirmed by using comparing effects from the ANN model with those from Geo Studio analysis using decided on instances not included in the unique database. This verification guarantees the ANN version's capability to produce dependable effects. The ANN model techniques the facts by using dividing it into education, testing, and holdout subsets, evaluating performance the usage of the holdout subset, which is not used for model parameter estimation.
(2). Predict mathematical equations the usage of the SPSS software program, which makes use of the more than one nonlinear regression method for the SEEP/W evaluation results advanced in step (1) above as a right away estimation of the output variables for a given set of enter variables.
Excluding the bias unit
Also the architecture of the ANN model network is shown in Figure 6.
Figure 6. Architecture of the ANN model network
Final weight matrices and final bias vectors for (ANN) model are shown in Table 5.
Comparison of the predicted and observed output for seepage discharge (q) are shown in Figure 7 and for phreatic line height (Yo) in Figure 8. The correlation coefficients (r2) are 95.70% for (q) and 97.8% for (Yo).
The significance of every unbiased variable at the based variables is proven in Table 6. As tested that the input variable collection of effect on the output variables are (permeability of the center, permeability of the dam, peak of water within the reservoir, upstream slope of the dam, crest width of the center, pinnacle of the dam, period of the clear out, downstream slope of the dam, base width of the dam, slope of the middle, crest width of the dam, and distance of the center base from upstream). Also, Figure 9 shows this significance evaluation.
Figure 7. Predicted and observed seepage discharge comparison
Figure 8. Predicted and observed phreatic line height emerging from the core comparison
Table 6. Independent variable importance
|
|
Importance |
Normalized Importance |
|
lf |
0.069 |
39.1% |
|
kc |
0.177 |
100.0% |
|
Sc |
0.051 |
28.9% |
|
x |
0.030 |
16.7% |
|
bc |
0.074 |
42.0% |
|
kd |
0.146 |
82.3% |
|
Sd |
0.065 |
36.9% |
|
Su |
0.084 |
47.6% |
|
bd |
0.049 |
27.6% |
|
B |
0.053 |
30.2% |
|
hw |
0.128 |
72.4% |
|
H |
0.072 |
40.9% |
Figure 9. Input variables normalized importance
4.3 Regression model
To link independent variables with dependent ones, an experimental equation is often developed using previously obtained data. These data are statistically processed to determine the best relationship form. Regression, particularly multiple nonlinear regression, is favored for its accuracy in such analyses. This study uses this method to investigate the seepage discharge (q) and phreatic line depth (Yo) from the core of zoned earth fill dams, relying on IBM SPSS 26. About 75% of the data (150 models) from flow analysis were used for regression processes for each dependent variable. With the help of the IBM SPSS 26 statistical software, 75% of the facts anticipated from water float through pour media evaluation for the pre-decided on zoned earth fill dam has ahead or backward willing core models (one hundred fifty fashions) were used simplest within the regression process for every structured variable. The required mathematical equations were received and the analysis of variance for each of them suggests excessive accuracy with correlation coefficients (r2=96.3%) for the seepage discharge (q) equation and (r2=97.1%) for phreatic line peak rising from the center (Yo) equation, Tables 7 to 12.
Table 7. Parameter estimates
|
Parameter |
Estimate |
Std. Error |
95% Confidence Interval |
|
|
Lower Bound |
Upper Bound |
|||
|
a0 |
4.676 |
5244434.136 |
-10370503.075- |
10370512.427 |
|
a1 |
1.875 |
3.183 |
-4.419- |
8.170 |
|
a2 |
3.373 |
2.014 |
-.610- |
7.356 |
|
a3 |
.259 |
.019 |
.222 |
.296 |
|
a4 |
2.784 |
1.785 |
-.745- |
6.314 |
|
a5 |
-2.760- |
1618139.958 |
-3199763.218- |
3199757.698 |
|
a6 |
-.021- |
.214 |
-.444- |
.401 |
|
a7 |
-4.062- |
3.188 |
-10.365- |
2.241 |
|
a8 |
.757 |
.068 |
.623 |
.890 |
|
a9 |
.396 |
.065 |
.268 |
.523 |
|
a10 |
-.715- |
.106 |
-.925- |
-.505- |
|
a11 |
-.045- |
.066 |
-.175- |
.085 |
|
a12 |
4.157 |
1618140.280 |
-3199756.938- |
3199765.253 |
Table 8. Parameter estimates correlations
|
|
a0 |
a1 |
a2 |
a3 |
a4 |
a5 |
a6 |
a7 |
a8 |
a9 |
a10 |
a11 |
a12 |
|
a0 |
1.000 |
-.380- |
.090 |
.235 |
-.338- |
1.000 |
-.108- |
.343 |
-.108- |
-.314- |
.074 |
.090 |
-1.000- |
|
a1 |
-.380- |
1.000 |
-.442- |
.028 |
.734 |
-.380- |
.752 |
-.744- |
.161 |
.061 |
-.438- |
-.016- |
.380 |
|
a2 |
.090 |
-.442- |
1.000 |
.054 |
.276 |
.090 |
.006 |
-.269- |
-.266- |
.090 |
.815 |
-.003- |
-.090- |
|
a3 |
.235 |
.028 |
.054 |
1.000 |
.097 |
.235 |
.092 |
-.082- |
-.185- |
-.154- |
.054 |
.015 |
-.235- |
|
a4 |
-.338- |
.734 |
.276 |
.097 |
1.000 |
-.338- |
.793 |
-.996- |
-.033- |
.095 |
.170 |
-.034- |
.338 |
|
a5 |
1.000 |
-.380- |
.090 |
.235 |
-.338- |
1.000 |
-.108- |
.343 |
-.108- |
-.314- |
.074 |
.090 |
-1.000- |
|
a6 |
-.108- |
.752 |
.006 |
.092 |
.793 |
-.108- |
1.000 |
-.803- |
.024 |
-.092- |
-.092- |
-.005- |
.108 |
|
a7 |
.343 |
-.744- |
-.269- |
-.082- |
-.996- |
.343 |
-.803- |
1.000 |
.024 |
-.130- |
-.142- |
-.002- |
-.343- |
|
a8 |
-.108- |
.161 |
-.266- |
-.185- |
-.033- |
-.108- |
.024 |
.024 |
1.000 |
.053 |
-.255- |
-.003- |
.108 |
|
a9 |
-.314- |
.061 |
.090 |
-.154- |
.095 |
-.314- |
-.092- |
-.130- |
.053 |
1.000 |
-.223- |
.020 |
.314 |
|
a10 |
.074 |
-.438- |
.815 |
.054 |
.170 |
.074 |
-.092- |
-.142- |
-.255- |
-.223- |
1.000 |
.004 |
-.074- |
|
a11 |
.090 |
-.016- |
-.003- |
.015 |
-.034- |
.090 |
-.005- |
-.002- |
-.003- |
.020 |
.004 |
1.000 |
-.090- |
|
a12 |
-1.000- |
.380 |
-.090- |
-.235- |
.338 |
-1.000- |
.108 |
-.343- |
.108 |
.314 |
-.074- |
-.090- |
1.000 |
Table 9. Analysis of variance (ANOVA)
|
Source |
Sum of Squares |
df |
Mean Squares |
|
Regression |
.000 |
13 |
.000 |
|
Residual |
.000 |
137 |
.000 |
|
Uncorrected Total |
.000 |
150 |
|
|
Corrected Total |
.000 |
149 |
|
|
Dependent variable: Q |
|||
|
R squared=1-(Residual Sum of Squares) / (Corrected Sum of Squares)=0.963. |
|||
Table 10. Parameter estimates
|
Parameter |
Estimate |
Std. Error |
95% Confidence Interval |
|
|
Lower Bound |
Upper Bound |
|||
|
a0 |
.055 |
81210.360 |
-160587.845- |
160587.956 |
|
a1 |
-9.354- |
8.259 |
-25.685- |
6.976 |
|
a2 |
8.816 |
2.359 |
4.151 |
13.480 |
|
a3 |
-.595- |
.024 |
-.642- |
-.548- |
|
a4 |
.516 |
3.810 |
-7.017- |
8.050 |
|
a5 |
-7.673- |
2121040.943 |
-4194220.237- |
4194204.890 |
|
a6 |
-1.008- |
.534 |
-2.064- |
.047 |
|
a7 |
1.526 |
6.769 |
-11.860- |
14.911 |
|
a8 |
.577 |
.017 |
.543 |
.611 |
|
a9 |
-.009- |
.080 |
-.168- |
.149 |
|
a10 |
-.439- |
.093 |
-.624- |
-.255- |
|
a11 |
-.265- |
.068 |
-.400- |
-.129- |
|
a12 |
7.763 |
2121040.308 |
-4194203.545- |
4194219.070 |
Table 11. Correlations of parameter estimates
|
|
a0 |
a1 |
a2 |
a3 |
a4 |
a5 |
a6 |
a7 |
a8 |
a9 |
a10 |
a11 |
a12 |
|
a0 |
1.000 |
.235 |
-.290- |
-.035- |
.171 |
1.000 |
.218 |
-.172- |
.042 |
-.168- |
-.158- |
.008 |
-1.00- |
|
a1 |
.235 |
1.000 |
-.803- |
.394 |
.961 |
.235 |
.964 |
-.971- |
.075 |
-.687- |
-.680- |
.000 |
-.235- |
|
a2 |
-.290- |
-.803- |
1.000 |
-.394- |
-.610- |
-.290- |
-.747- |
.640 |
-.151- |
.734 |
.651 |
-.008- |
.290 |
|
a3 |
-.035- |
.394 |
-.394- |
1.000 |
.346 |
-.035- |
.491 |
-.370- |
-.040- |
-.054- |
-.057- |
-.026- |
.035 |
|
a4 |
.171 |
.961 |
-.610- |
.346 |
1.000 |
.171 |
.931 |
-.998- |
.037 |
-.590- |
-.585- |
-.012- |
-.171- |
|
a5 |
1.000 |
.235 |
-.290- |
-.035- |
.171 |
1.000 |
.218 |
-.172- |
.042 |
-.168- |
-.158- |
.008 |
-1.00- |
|
a6 |
.218 |
.964 |
-.747- |
.491 |
.931 |
.218 |
1.000 |
-.948- |
.073 |
-.538- |
-.708- |
.009 |
-.218- |
|
a7 |
-.172- |
-.971- |
.640 |
-.370- |
-.998- |
-.172- |
-.948- |
1.000 |
-.044- |
.592 |
.608 |
-.007- |
.172 |
|
a8 |
.042 |
.075 |
-.151- |
-.040- |
.037 |
.042 |
.073 |
-.044- |
1.000 |
-.126- |
-.185- |
.010 |
-.042- |
|
a9 |
-.168- |
-.687- |
.734 |
-.054- |
-.590- |
-.168- |
-.538- |
.592 |
-.126- |
1.000 |
.445 |
.079 |
.168 |
|
a10 |
-.158- |
-.680- |
.651 |
-.057- |
-.585- |
-.158- |
-.708- |
.608 |
-.185- |
.445 |
1.000 |
.020 |
.158 |
|
a11 |
.008 |
.000 |
-.008- |
-.026- |
-.012- |
.008 |
.009 |
-.007- |
.010 |
.079 |
.020 |
1.000 |
-.008- |
|
a12 |
-1.00- |
-.235- |
.290 |
.035 |
-.171- |
-1.00- |
-.218- |
.172 |
-.042- |
.168 |
.158 |
-.008- |
1.000 |
Table 12. Analysis of variance (ANOVA)
|
Source |
Sum of Squares |
df |
Mean Squares |
|
Source |
3400.814 |
13 |
261.601 |
|
Regression |
76.535 |
137 |
.559 |
|
Residual |
3477.350 |
150 |
|
|
Uncorrected Total |
2597.132 |
149 |
|
|
Corrected Total |
|||
|
R squared=1-(Residual Sum of Squares) / (Corrected Sum of Squares)=0.971 |
|||
Figure 10. Predicted and observed seepage discharge (q) comparison
Figure 11. Predicted and observed phreatic line height emerging from core (Yo) comparison
In addition, their validity and accuracy were tested by comparing the results calculated from them with the results of the remaining 25% (50 models) data that were not included in predicting the two required equations. The correlation coefficients were (97.3%) for the seepage discharge (q) and (89.5%) for the phreatic line emerging from the core (Yo), Figures 10 and 11.
Seepage discharge equation can be written for multiple nonlinear regressions as:
q=a0 (H)a1 (hw)a2 (kd)a3 (Su)a4 (Sd)a5 (bd)a6 (B)a7 (kc)a8 (Sc)a9 (bc)a10 (x)a11 (lf)a12
And the parameters [a(0 to 12)] had been envisioned by using the use of IBM SPSS 26 software program.
Then the predicted equation in (m3/sec) is:
$q=\frac{4.676 \times H^{1.875} \times{h_w}^{3.373} \times{k_d}^{0.259} \times S_u{ }^{2.784} \times{k_c}^{0.757} \times S_c{ }^{0.396} \times{l_f}^{4.157}}{{S_d}^{2.760} \times{b_d}^{0.021} \times B^{4.062} \times b_c{ }^{0.715} \times x^{0.045}}$
Also, phreatic line height emerging from the core equation can be writes for multiple nonlinear regressions as:
Yo=a0 (H)a1 (hw)a2 (kd)a3 (Su)a4 (Sd)a5 (bd)a6 (B)a7 (kc)a8 (Sc)a9 (bc)a10 (x)a11 (lf)a12
And the parameters [a(0 to 12)] anticipated through using IBM SPSS 26 software.
Then the predicted equation in (m) is:
$Y_o=\frac{0.055 \times h_w{ }^{8.816} \times S_u{ }^{0.516} \times B^{1.526} \times K_c{ }^{0.577} \times l_f{ }^{7.763}}{H^{9.354} \times{k_d}^{0.595} \times S_d{ }^{7.673} \times{b_d}^{1.008} \times S_c^{0.009} \times b_c{ }^{0.439} \times x^{0.265}}$
The aim of this study was to develop quick and simple equations for calculating seepage discharge and estimating the depth of water emerging from the inclined core in zoned earth fill dams. A database of 200 varied dam models with forward or backward inclined cores was created. These models adhered to recommended safety limits for stability. Flow analysis was conducted using Geo Studio SEEP/W and SPSS software to calculate seepage discharge and water depth for each model. The developed equations demonstrated high accuracy in predicting seepage and water depth. efficiency in predicting the seepage discharge amount and depth of water emerging from the core, with correlation coefficients of 97.3 and 89.5, respectively, when compared to other analysis methods. Overall, this study provides a simplified and efficient method for analyzing seepage in zoned earth fill dams with inclined cores, which can help in the design and construction of these types of dams to ensure their stability and safety.
The future work for this study could include the following:
1) Analysis the use of Geo Studio software program suggests a mild decrease in seepage discharge amount for the ahead-inclined middle shape as compared to the backward-inclined middle shape, with a distinction of about 0.03%.
2) Moreover, decreasing dam upstream slope or increasing the width of the dam crest reduces considerably the discharge to a certain extent and then its effect ceases.
3) Furthermore, the height of water emerging from the core shows a direct proportional relationship with core permeability, dam downstream slope, and core slope, while an inverse proportional relationship is observed with dam permeability, core width, and filter length. The dam height, reservoir water level, dam crest width, and dam downstream slope have little to no effect.
4) Artificial neural network model (ANN) shows that is the models group number selected (200) was enough and appropriate and correlation coefficients was greater than 95%, whilst the expected results in comparison with the determined effects for each seepage discharge and phreatic line height rising from the center.
5) Independent variables normalized importance shows that the highest influence on the seepage discharge and phreatic line height emerging from the core is for the core permeability and the dam permeability, (materials properties), more than 80% and lowest influence is for the core base distance from the upstream of the dam, less than 20%.
6) Both of the predicted equations are accurate and suitable to estimate the seepage discharge and the phreatic line peak rising from the center, and equations parameters variance analyzing has a very good correlation coefficient (r2), more than 96% for both.
7) In addition, when the results that calculated from the equations compared with those observed for new set of models (50 models) the correlation coefficients were (97.3%) for the seepage discharge (q) and (89.5%) for the phreatic line emerging from the core (Yo), so they may be used with reassurance.
8) The equation predicting seepage discharge indicates a direct proportionality with several factors: the peak of the dam, the reservoir stage, the permeability of the dam, the upstream slope of the dam, the permeability of the center, the slope of the core, and the period of the filter out. Conversely, it suggests an inverse proportionality with the downstream slope of the dam, the crest width of the dam, the base width of the dam, the crest width of the middle, and the space from the middle base to the upstream thing of the dam.
9) The equation predicting the peak of the phreatic line emerging from the middle shows an immediate proportionality with the reservoir degree, the upstream slope of the dam, the base width of the dam, the permeability of the center, and the period of the clean out. Conversely, it indicates an inverse proportionality with the peak of the dam, the permeability of the dam, the downstream slope of the dam, the crest width of the dam, the slope of the middle, the width of the middle, and the space from the middle base to the upstream facet of the dam.
10) The results that obtained for seepage discharge from experimental and numerical models shows a good agreement with correlation factor (R2) equal to 99.4%. In general, experimental result values were less than numerical result values and differed by 3% to 18%.
11) There is a direct effect of the shape of the core and its location on the amount of water seeping from the reservoir through the body of the zoned earth fill dam. It was found that there was a decrease in the amount of seeping water when the shape of the core changed from rectangular to trapezoidal by 62% and increased to 79% when the core slope decreased from 1:0.25 to 1:0.75. While an increase in it occurred when using inclined core towards the back by 1% and increased to 43% when the core slope decreased from 1:0.25 to 1:0.75, and in the case of forward inclined by 3% and increased to 43% when the core slope decreased from 1:0.25 to 1:0.75.
12) In addition, this decreasing and increasing mentioned in past point in case of increasing core crest width to dam crest width ratio from 0.25 to 0.75 causes a decreasing about 20% in seepage for trapezoidal core shape. And an increasing about 4% for 1:0.25 slope, 17% for 1:0.5 slope, and decreasing about 5% for 1:0.75 slope in seepage for forward inclined core shape. Also causes an increasing about 3% for 1:0.25 and 1:0.5 slopes, and decreasing about 5% for 1:0.75 slope in seepage for backward inclined core shape.
13) Finally, increasing core crest width to dam crest width ratio from 0.25 to 0.75 causes a decreasing in seepage about 65% for rectangular, 47% to 34% for trapezoidal, 63% to 66% for forward, and 64% to 66% for backward core shapes and for all slopes.
14) By monitoring the stability of the dam's upstream surface during a rapid water drop in the reservoir, it was observed that the dam demonstrated high resistance to sliding. This stability was evident across all core shapes, except for a minor portion of the surface near the base in the rectangular and backward core shapes.
1). Constructing physical models for zoned earth fill dams with core have a cutoff penetrates the foundation to reduce seepage and improve stability and observing seepage quantities.
2). Testing other additive material specifically a Nano-material in order to improving the properties of soils available in the construction locations of earth dams, specifically the permeability of soil in order to use instead of clay soils in the core of these dams.
3). Develop quick estimation equations for zoned embankment dams with varied core shapes to calculate dam side slope sliding factor of safety for both maximum reservoir water level state (static) and rapidly drop of reservoir water level state (dynamic).
4). Develop similar equations considering the effect of the reservoir surface wave on the seepage discharge and side slope factor of safety applied on the dam.
5). Use artificial neural network model to develop a model for obtaining optimum dam section dimensions for zoned earth dams.
|
H |
Height of the dam |
|
Hw |
Height of the reservoir water |
|
Bd |
Width of the dam crest |
|
B |
Width of the dam base |
|
Bc |
Width of the dam center crest |
|
Sc |
Slope of the center |
|
Fb |
Height of the loose board |
|
Su |
Slope of the dam upstream face |
|
Sd |
Slope of the dam downstream face |
|
Kd |
Permeability of the dam soil |
|
Kc |
Permeability of the center soil |
|
Kf |
Permeability of the filter |
|
Lf |
Length of the filter out |
|
Hf |
Height of the filter |
|
x |
Distance of the core base from the upstream face |
|
Yo |
Height of the phreatic line emerging from the core |
[1] Hasani, H., Mamizadeh, J., Karimi, H. (2013). Stability of slope and seepage analysis in earth fills dams using numerical models (Case study: Ilam Dam-Iran). World Applied Sciences Journal, 21(9): 1398-1402. https://doi.org/10.5829/idosi.wasj.2013.21.9.1313
[2] Mohammadi, M., Barani, G.A., Ghaderi, K., Haghighatandish, S. (2013). Optimization of earth dams clay core dimensions using evolutionary algorithms. European Journal of Experimental Biology, 3(3): 350-361.
[3] Jamel, A.A.J. (2018). Investigation and estimation of seepage discharge through homogenous earth dam with core by using SEEP/W model and artificial neural network. Diyala Journal of Engineering Sciences, 11(3): 54-61. https://doi.org/10.26367/DJES/VOL.11/NO.3/9
[4] Khassaf, S.I., Madhloom, A.M. (2017). Effect of impervious core on seepage through zoned earth dam (Case study: Khassa Chai dam). International Journal of Scientific & Engineering Research, 8(2): 1053-1063.
[5] Li, H., Zhao, F., Li, J. (2019). Seepage analysis of clay core wall dam based on ABAQUS. IOP Conference Series: Earth and Environmental Science, 384(1): 012015. https://doi.org/10.1088/1755-1315/384/1/012015
[6] Shakir, R.R. (2011). Effect of an impervious core constructed into a large earth dam on the quantity of seepage. Thi-Qar University Journal of Engineering Science, 2(2): 1-17. https://doi.org/10.31663/utjes.v2i2.120
[7] Fakhari, A., Ghanbari, A. (2013). Note: A simple method for calculating the seepage from earth dams with clay core. Journal of GeoEngineering, 8(1): 27-32.
[8] Li, Q., Liu, J. (2010). Numerical analysis of the seepage field in core-dam. School of Civil Engineering and Architecture, Southwest Petroleum University, Chengdu, China.
[9] Salem, M.N., Eldeeb, H.M., Nofal, S.A. (2019). Analysis of seepage through earth dams with internal core. International Journal of Engineering Research & Technology, 8(1): 768-777. https://doi.org/10.17577/IJERTV8IS080168
[10] Zahedi, P., Aghazani, H.F. (2018). The effect of clay core specifications on the seepage behavior of an earthfill dam. In 5th International Symposium on Dam Safety.
[11] Kheiri, G., Javdanian, H., Shams, G. (2020). A numerical modeling study on the seepage under embankment dams. Modeling Earth Systems and Environment, 6: 1075-1087. https://doi.org/10.1007/s40808-020-00742-9
[12] Salmasi, F., Norouzi, R., Abraham, J., Nourani, B., Samadi, S. (2020). Effect of inclined clay core on embankment dam seepage and stability through LEM and FEM. Geotechnical and Geological Engineering, 38: 6571-6586. https://doi.org/10.1007/s10706-020-01455-7
[13] Sazzad, M., Alam, S. (2021). Numerical investigation of seepage through earth dam. In 5th International Conference on Advances in Civil Engineering (ICACE).
[14] Zedan, A.J., Faris, M.R., Bdaiwi, A.K. (2022). Performance assessment of Shirin earth dam in Iraq under various operational conditions. Tikrit Journal of Engineering Sciences, 29(2): 61-74. http://doi.org/10.25130/tjes.29.2.8
[15] Aziz, Y., Ibrahim, A., MohammedAmin, O.K. (2023). Effect of core geometry on earth dam slope stability. Tikrit Journal of Engineering Sciences, 30(2): 41-45. http://doi.org/10.25130/tjes.30.2.5
[16] Yousif, N.S. (2007). Seepage analysis of earth dams by finite elements. M.Sc. Thesis, Collage of Engineering, University of Kufa, Iraq. https://doi.org/10.30684/etj.2017.127329
[17] Tatewar, S.P., Pawade, L.N. (2012). Stability analysis of earth dam by GeoStudio software. International Journal of Civil Engineering and Technology, 3(2): 437-446.
[18] Al-Suhaili, R.H., Ali, A.A., Behaya, S.A. (2014). Artificial neural network modeling for dynamic analysis of a dam-reservoir-foundation system. International Journal of Engineering Research and Applications, 4(1): 121-143.
[19] Bredy, S., Jandora, J. (2020). Effect of dam height on the stability of earth dam (Case study: Karolinka dam). Journal of Engineering, 26(3): 117-126. https://doi.org/10.31026/j.eng.2020.03.10
[20] Abdel-Kawy, A.O., AboulAtta, N.M., El-Molla, D.A. (2021). Effects of core characteristics on seepage through earth dams. Water Practice & Technology, 16(4): 1248-1264. https://doi.org/10.2166/wpt.2021.053
[21] Irzooki, R.H., Jamel, A.A. (2012). Experimental study of characteristics of top seepage line through homogenous earth dam using Hele-Shaw model. International Review of Civil Engineering (IRECE), 3(6): 480.
[22] El-Hazek, A.N., Abdel-Mageed, N.B., Hadid, M.H. (2020). Numerical and experimental modelling of slope stability and seepage water of earthfill dam. Journal of Water and Land Development, 44: 55-64. https://doi.org/10.24425%2F%20jwld.2019.127046
[23] Mazaheri, A., Komasi, M., Mohammadzadeh, A., Beiranvand, B. (2019). Optimization of horizontal drain dimensions in heterogeneous earth dams using Artificial Neural Network (ANN): A case study on Marvak dam. Journal of Applied Research in Water and Wastewater, 6(2): 109-116. https://doi.org/10.22126/arww.2019.1403
[24] Heidari, S.A., Kalantari, B. (2017). Case study: Method artificial neural network for earthfill dams seepage analysis: Shahrchay dam in Iran. Electronic Journal of Geotechnical Engineering, 22: 1387-1396.