Ohood K. Al-Marj![]() | Saja M. Naeem*
| Saja M. Naeem*![]() | Hanadi Abdulridha Lateef
| Hanadi Abdulridha Lateef![]()
© 2025 The authors. This article is published by IIETA and is licensed under the CC BY 4.0 license (http://creativecommons.org/licenses/by/4.0/).
OPEN ACCESS
The world's climate change and its hydrological effects, which affect water balance and shortage, are major concerns for the semiarid regions. Temperature and precipitation variations would have an impact on aquaculture, farming, and agriculture. Adverse effects may also extend to the quality of water storage facilities used for human use. The values of water storage in the future were dynamically visualized using the System Thinking Software STELLA 9.0.2. This software simulates the primary elements of water balance during the specified time- period using a variety of tools, such as causal loops, model equations, stocks and flow diagrams, and built-in functions. This simulated model can be used to predict the water storage as well as to apply strategies to the management of conservation of water resources.
climate change, modeling, prediction, STELLA, water balance, water deficit
Since water for agriculture and other uses is becoming scarcer due to population growth, there has been an increase in water demand [1]. Only around 2.5% of the earth's surface is freshwater, despite water making up around 71% of it. About 30% of that, freshwater is subterranean, while about 69% is trapped in glaciers and ice caps. As a result, less than 1% of the entire water supply is available for human consumption and use [2-5].
In any hydrological basin, rainfall and evaporation are essential components of the hydrological cycle as well as of the climatic and environmental systems [6-8].
A complex interaction between natural soil and structural features, changing climatic conditions, and hydrological cycle influences determines the hydrological conditions and temperature present in any hydrological basin [9].
Water budgets offer a way to assess the sustainability and accessibility of a water storage [10]. The water budget equation shows variation in storage of water as well as the relative quantities of inflow and outflow. Depending on the water balance approach, a quantitative assessment of water resources and their changes may made [11, 12].
In hydrology, the water balance analysed using the law of mass conservation. This states that for every arbitrary volume and period, a change in water storage will balance the difference between total intake and production [13]. Assessing the impacts of human-caused modifications to the regime of lakes, streams, and groundwater basins requires an understanding of the water budget [14].
The input side of water budget estimations considers precipitation, while the output side takes into account evaporation, runoff, transpiration from plants and infiltration. Reaching the most accurate assessment of the circumstances is its aim [11, 15].
Over time, a general deficit of water resources was caused by the continuous lack of rainfall. However, the impacted area is social, economic, and environmental systems were greatly impacted by the decrease in flow rate of the water surface. Sometimes, when local circumstances are coupled with a regional drought, the detrimental effects of the aforementioned will be amplified [16].
A period of below-average precipitation in a certain location is known as a drought. Insufficient precipitation, in the form of rain or snow, can lead to a reduction in soil moisture or groundwater, a decrease in stream flow, harm to crops, and an overall scarcity of water [17].
The effects of drought, one of the most expensive natural disasters in the world, are felt strongly by the environment, agriculture, economy, and human activity. A drought's effects were cumulative over a long period and a wide geographic area, setting it apart from other natural disasters [18].
Long stretches of dry weather will undoubtedly extend the spread of desertification in the Middle East, where it has already been documented in many locations and will affect those who were previously thought to be immune to it [19].
Understanding and handling water resources requires the use of water storage modelling, especially in areas with scarce water supplies or those dealing with serious water management issues. It is essential for enhancing the water storage system's sustainability, design, and effectiveness [20].
Below are the biggest challenges of current water storage modelling programs:
Models relying on satellite data, like GRACE, often have limited spatial and temporal resolution, which can miss localized water storage changes, making them less effective for regional or short-term water management [21].
Current models often oversimplify complex procedures like surface water, soil moisture, and groundwater storage, leading to inaccurate predictions and evaluations of climate change or human activity effects [22].
Water storage models rely on limited or inconsistent information, such as groundwater extraction and precipitation data, which can be inconsistent across regions, leading to questionable results and data gaps [23].
Climate models used for water storage often have high uncertainty in predicting temperature and precipitation patterns, making it difficult to make precise predictions about long-term changes in water storage [24].
Computational difficulties in integrated systems and high-resolution models can hinder access to cutting-edge computing infrastructure, making fully distributed hydrological models impractical for some applications [25].
Models often overlook human factors like urbanization, agricultural practices, and water management regulations, making them less applicable for practical decision-making and excluding adaptive management techniques and dynamic regulations [26].
Insufficient calibration and validation of water storage models can lead to inaccurate projections and impact model reliability, particularly in areas with limited in-situ monitoring networks [27].
By examining vast datasets to find trends and forecast system behaviours, data-driven techniques—especially those that make use of machine learning—have improved the precision of water storage estimates:
Wang et al. [28] addressed the limits of low-resolution data by using a limited point-mass modelling approach with a data-driven regularization matrix to enhance the spatial precision of water storage estimates.
Zhou et al. [29] created a machine learning model to create detailed profiles of soil water storage capacity by estimating soil moisture from meteorological data.
Kraft et al. [30] simulated global hydrological cycles, such as snow, soil moisture, and groundwater storage dynamics, by combining machine learning and physical modelling.
Water Storage Modeling with STELLA Software: Structural Thinking and Experiential Learning Laboratory with Animation, or STELLA, is a dynamic modelling application that lets users build and model intricate systems, such as networks for water distribution and storage:
Sher et al. [31] developed a model using STELLA to replicate the water demand, supply, and storage of Keenjhar Lake, aiming to assess the sustainable use of water resources.
Tapia et al. [32] used to simulate the impact of climate change on the Rio Yaqui Basin's water balance in Sonora, Mexico, offering predictions for future water storage scenarios under various climate circumstances.
Ouyang et al. [33] created a model based on STELLA to estimate farm pond water budgets and hydrological processes, proving the software's usefulness in agricultural water management.
The goal of this study is to analyze and comprehend the spatial and temporal variations in water storage values while creating a precise mathematical or numerical model using (the Structural Thinking and Experiential Learning Laboratory with Animation, Stella) program to depict water storage in a particular region (Basra City as a case study). Creating a thorough model that incorporates hydrological and climatic data is the primary goal, with an emphasis on utilizing contemporary modelling techniques to forecast future changes in water storage.
Analyzing the effects of recharge and consumption/loss processes (evaporation and human use) on the sources of water balance (surface runoff and rainfall). Monitoring shifts in water storage values caused by fabricated and natural phenomena, such as climate change or agricultural expansion.
Recommending water resource management strategies based on modelling findings, which reduces the likelihood of water scarcity and encourages the sustainable use of water storage. The proposed model would rely on integrating field and reference data with modern statistical analysis and programming techniques to generate extremely precise findings and help decision-makers manage water resources.
2.1 Modeling water storage with STELLA
Addressing issues including rising water demand, climate variability, and erratic hydrological patterns requires effective management of water resources. Reservoirs, aquifers, and dispersed networks are examples of water storage systems that are essential to guaranteeing consistent water supply for ecological, industrial, agricultural, and residential purposes. Researchers and policymakers may assess performance, comprehend behavior, and create the best possible solutions for sustainable resource management by modelling these systems [24].
Because of its user-friendly graphical interface and capacity to depict intricate interdependencies, the dynamic systems modelling program STELLA provides a strong platform for simulating water storage systems. STELLA enables users to create and examine dynamic models that mimic actual water storage processes by fusing stocks, fluxes, and feedback loops. These models can simulate all-important elements including inflows, outflows, evaporation losses, and operating regulations under various circumstances [31].
In order to investigate storage dynamics and evaluate the effects of variables such as climatic variability and management tactics, this study focuses on creating a water storage model using STELLA.
2.2 Study area and data collection
2.2.1 Study area
An important centre for the infrastructure and economy of the country is Basra, which is situated in southern Iraq close to the Persian Gulf. Its hydrological significance is highlighted by its advantageous location along the Shatt al-Arab River, which was created by the meeting of the Tigris and Euphrates rivers.
Spatial position:
Located near the southernmost tip of Iraq, Basra shares borders with Iran to the east and Kuwait to the south. The city's position as a major port is made possible by its closeness to the Persian Gulf, which greatly boosts Iraq's maritime trade and oil exports [34].
Important hydrological factors:
Basra relies on the Shatt al-Arab River as its main supply of water for industrial, agricultural, and residential purposes. Reduced freshwater inflows, increasing salinity from seawater intrusion and pollution from industrial and agricultural processes are some of the problems the river faces. The local economy and public health are impacted by the deterioration in water quality caused by these problems.
Issues with water storage:
The infrastructure for water storage in Basra consists of treatment facilities and reservoirs intended to control and provide water to the city's residents. However, inefficiency, limited capacity, and maintenance problems are common problems for these facilities. A sustainable water supply for the area requires comprehensive management techniques due to water shortages and quality issues brought on by ageing infrastructure and environmental issues.
For Basra's growth and the welfare of its citizens, these hydrological issues must be resolved. Achieving a sustainable water future for the city requires modernizing infrastructure and putting into practice efficient water management techniques [35].
2.2.2 Data collection
The basis for comprehending the water balance in a particular area is meteorological data. The information is utilized to:
Calculate Inflows: Rainfall has a direct impact on aquifer and reservoir inflows.
Estimate Losses: Evaporation and evapotranspiration losses are modelled using temperature, solar radiation, and wind data.
simulate Seasonal Variability: Historical and current data from weather stations are used to simulate how storage is affected by seasonal fluctuations like monsoons or dry spells.
Forecast Future Events: Scenario analysis, such as the effects of climate change on water storage systems, is made possible by long-term meteorological data [28, 31, 34].
The meteorological data source for this research was:
Ground-based stations, which are accurate, location-specific observations provided by Basra weather stations.
Considerations for Gathering Data
Data Quality: Verify that the information is correct, dependable, and error-free. Verify measurements against historical records and calibrate instruments on a regular basis.
Data Gaps: Use interpolation techniques to fill in the missing data.
Spatial Coverage: To account for regional variations in weather, make sure there is adequate spatial coverage by combining data from several stations.
Numerous atmospheric characteristics that are essential to modelling water storage are tracked and recorded by meteorological stations:
Precipitation: Information on rainfall is essential for evaluating water storage system inflow.
For this model, rainfall recorded values from Basra metrological stations were collected for 12 months during the period (2014-2023) in the Table 1 and Table 2.
Table 1. The values of average monthly rainfall (mm) of Basra’s stations for the period (2014-2023)
|
Month/Year |
Jan. |
Feb. |
Mar. |
Apr. |
May |
Jun. |
Jul. |
Aug. |
Sep. |
Oct. |
Nov. |
Dec. |
|
2014 |
62.8 |
12.5 |
16.4 |
7.6 |
3.6 |
0 |
0 |
0 |
0 |
0 |
29.5 |
28 |
|
2015 |
45.7 |
12.2 |
13 |
6.8 |
3.3 |
0 |
0 |
0 |
0 |
0 |
29.2 |
26.1 |
|
2016 |
12.4 |
12 |
12.8 |
6.32 |
3.2 |
0 |
0 |
0 |
0 |
0 |
28.6 |
24.8 |
|
2017 |
2.4 |
11.5 |
11.45 |
5.76 |
2.4 |
0 |
0 |
0 |
0 |
0 |
27.4 |
23.8 |
|
2018 |
9.7 |
11.24 |
10.78 |
5.42 |
2.7 |
0 |
0 |
0 |
0 |
0 |
25.8 |
22 |
|
2019 |
8.8 |
11.1 |
9.6 |
5.1 |
2.1 |
0 |
0 |
0 |
0 |
0 |
23.6 |
21.8 |
|
2020 |
2.16 |
10.6 |
9.2 |
4.7 |
2.4 |
0 |
0 |
0 |
0 |
0 |
23.2 |
19.6 |
|
2021 |
1.22 |
10.78 |
8.5 |
4.2 |
2.3 |
0 |
0 |
0 |
0 |
0 |
24 |
16.77 |
|
2022 |
5.56 |
10.8 |
7.3 |
4.3 |
2.1 |
0 |
0 |
0 |
0 |
0 |
16.78 |
12.78 |
|
2023 |
9.6 |
8.2 |
6 |
4.4 |
2 |
0 |
0 |
0 |
0 |
0 |
17 |
13.5 |
Table 2. The summary statistical of rainfall recorded data
|
Month |
Average |
Maximum |
Minimum |
Standard Deviation |
|
Jan. |
20.3 |
62.8 |
1.22 |
19.8 |
|
Feb. |
11.09 |
12.5 |
8.2 |
1.14 |
|
Mar. |
10.5 |
16.4 |
6 |
2.9 |
|
Apr. |
5.46 |
7.6 |
4.2 |
1.09 |
|
May |
2.65 |
3.6 |
2 |
0.5 |
|
Jun. |
0 |
0 |
0 |
0 |
|
Jul. |
0 |
0 |
0 |
0 |
|
Aug. |
0 |
0 |
0 |
0 |
|
Sep. |
0 |
0 |
0 |
0 |
|
Oct. |
0 |
0 |
0 |
0 |
|
Nov. |
4.38 |
29.5 |
16.78 |
4.38 |
|
Dec. |
4.92 |
28 |
12.8 |
4.92 |
A vital part of the hydrological cycle, rainfall supports water supply and agriculture. A consistent decrease in rainfall was revealed by the analysis of the data, with annual averages for the rainy season [November–May] declining from 2017 to 2023. Additionally, the data indicates sporadic dry spells, particularly during the [June–October] period for each year, when the area received no rainfall.
A mix of human and climate influences probably causes this declining tendency. Natural rainfall patterns are disturbed by urbanization and local deforestation, while global warming has exacerbated weather anomalies.
Temperature: evaporation rates are influenced by air temperature, which also affects storage quantities [18].
For this model, the temperature recorded values from Basra metrological stations collected for 12 months during the period (2014-2023) in the Table 3 and Table 4.
One important indicator of climatic patterns and their effects on the environment and human activity was temperature trends. Basra City's temperature data is separated into three categories to provide a clearer view of how temperatures spread out and change over time. The categories are as follows:
1. Below 20℃: Generally regarded as cool or moderate temperatures, these are frequently connected to winter or cooler seasons [January and February].
2. Temperatures in the range of 20℃ to 29℃ regarded as moderate to warm and frequently seen as comfortable [March, April, November, and December].
3. 30℃ to 49℃: This range of temperatures denotes hot to intense heat conditions, which are frequently problematic for agriculture, ecosystems, and human health [May–October].
Table 3. The values of average monthly temperature (℃) of Basra’s stations for the period (2014-2023)
|
Month/Year |
Jan. |
Feb. |
Mar. |
Apr. |
May |
Jun. |
Jul. |
Aug. |
Sep. |
Oct. |
Nov. |
Dec. |
|
2014 |
12.9 |
15 |
21.2 |
27.8 |
37.6 |
37.8 |
46.4 |
47.7 |
41.5 |
29.2 |
18.8 |
20.3 |
|
2015 |
13.1 |
15.4 |
21.8 |
28.1 |
38.2 |
37.79 |
46.5 |
47.8 |
41.8 |
29.5 |
19.3 |
20.8 |
|
2016 |
13.21 |
15.6 |
22.2 |
28.2 |
38.6 |
38.2 |
46.54 |
48.2 |
41.88 |
29.75 |
19.7 |
21.3 |
|
2017 |
13.4 |
16.4 |
23.1 |
28.1 |
38.76 |
38.38 |
46.65 |
48.32 |
42.1 |
30 |
20.7 |
21.8 |
|
2018 |
13.48 |
16.8 |
23.7 |
28.75 |
40.1 |
38.6 |
46.7 |
48.76 |
42.4 |
30.1 |
20.8 |
22.12 |
|
2019 |
13.57 |
17.21 |
25.5 |
29.2 |
40.7 |
38.8 |
46.76 |
48.8 |
42.46 |
30.15 |
20.7 |
22.56 |
|
2020 |
13.78 |
17.38 |
26 |
29.4 |
41.7 |
40.2 |
46.79 |
49.3 |
42.5 |
30.16 |
21.3 |
22.35 |
|
2021 |
13.8 |
17.56 |
31.7 |
29.3 |
42 |
40.6 |
46.78 |
49.4 |
42.53 |
30.08 |
21.8 |
22.23 |
|
2022 |
13.86 |
16.73 |
31 |
29.7 |
41.8 |
43.7 |
46.9 |
48.65 |
42.7 |
29.78 |
22.6 |
23.1 |
|
2023 |
13.9 |
17.81 |
31 |
30.2 |
43.6 |
44.6 |
46.87 |
48.58 |
42.6 |
29.8 |
23.5 |
22.89 |
Table 4. The summary statistical of temperature recorded data
|
Month |
Average |
Maximum |
Minimum |
Standard Deviation |
|
Jan. |
13.5 |
13.9 |
12.9 |
0.3 |
|
Feb. |
16.59 |
17.8 |
15 |
0.9 |
|
Mar. |
25.72 |
31.7 |
21.2 |
3.88 |
|
Apr. |
28.87 |
30.2 |
27.8 |
0.76 |
|
May |
40.3 |
43.4 |
37.6 |
189 |
|
Jun. |
39.8 |
44.6 |
37.7 |
2.33 |
|
Jul |
46.6 |
46.9 |
46.4 |
0.16 |
|
Aug |
48.5 |
49.4 |
47.7 |
0.54 |
|
Sep |
42.2 |
42.7 |
41.5 |
0.38 |
|
Oct |
29.8 |
30.16 |
29.2 |
0.3 |
|
Nov |
20.9 |
23.5 |
18.8 |
1.38 |
|
Dec |
21.9 |
23.1 |
20.3 |
0.86 |
Table 5. The values of mean monthly percentage of annual month light hours for the stations in Basra City during the period (2014-2023)
|
Month/Year |
Jan. |
Feb. |
Mar. |
Apr. |
May |
Jun. |
Jul. |
Aug. |
Sep. |
Oct. |
Nov. |
Dec. |
|
2014 |
7.45 |
8.06 |
8.67 |
10.8 |
7.46 |
9.95 |
8.97 |
8.73 |
8.85 |
6.9 |
7.45 |
6.62 |
|
2015 |
7.58 |
8.02 |
8.72 |
10.68 |
7.56 |
9.87 |
9.08 |
8.78 |
8.82 |
6.98 |
7.41 |
6.61 |
|
2016 |
7.78 |
7.97 |
8.77 |
10.48 |
7.61 |
9.84 |
9.1 |
8.86 |
8.78 |
7.1 |
7.38 |
6.63 |
|
2017 |
7.72 |
7.93 |
8.78 |
10.59 |
7.7 |
9.81 |
9.15 |
8.95 |
8.79 |
7.11 |
7.32 |
6.65 |
|
2018 |
7.8 |
7.89 |
8.79 |
10.64 |
7.75 |
9.76 |
9.16 |
9.08 |
8.84 |
7.14 |
7.28 |
6.65 |
|
2019 |
7.85 |
7.87 |
8.79 |
10.74 |
7.78 |
9.75 |
9.15 |
9.1 |
8.81 |
7.2 |
7.25 |
6.63 |
|
2020 |
7.82 |
7.86 |
8.76 |
10.79 |
7.8 |
9.83 |
9.16 |
9.08 |
8.71 |
7.25 |
7.22 |
6.46 |
|
2021 |
7.78 |
7.86 |
8.74 |
10.86 |
7.8 |
10 |
9.17 |
9.03 |
8.56 |
7.18 |
7.15 |
6.52 |
|
2022 |
7.64 |
7.87 |
8.72 |
10.9 |
7.79 |
10.1 |
9.18 |
9.01 |
8.52 |
7.32 |
7.13 |
6.37 |
|
2023 |
7.53 |
7.88 |
8.7 |
11.2 |
7.7 |
10.2 |
9.2 |
8.87 |
8.6 |
7.38 |
6.89 |
6.39 |
Table 6. The summary statistical of solar radiation recorded data
|
Month |
Average |
Maximum |
Minimum |
Standard Deviation |
|
Jan. |
7.7 |
7.8 |
7.5 |
0.13 |
|
Feb. |
7.9 |
8.1 |
7.9 |
0.06 |
|
Mar. |
8.7 |
8.8 |
8.7 |
0.03 |
|
Apr. |
10.7 |
11.2 |
10.5 |
0.18 |
|
May |
7.6 |
7.8 |
7.5 |
0.11 |
|
Jun. |
9.9 |
10.2 |
9.8 |
0.14 |
|
Jul. |
9.1 |
9.2 |
8.9 |
0.06 |
|
Aug. |
8.9 |
9.1 |
8.7 |
0.12 |
|
Sep. |
8.7 |
8.8 |
8.5 |
0.12 |
|
Oct. |
7.2 |
7.4 |
6.9 |
0.14 |
|
Nov. |
7.2 |
7.5 |
6.8 |
0.15 |
|
Dec. |
6.5 |
6.6 |
6.4 |
0.1 |
Sunshine hours: The amount of sunshine has a significant impact on plant transpiration, evaporation rates, and total water availability, among other hydrological processes (refer to Table 5 and Table 6) [33].
Two types of sunshine periods were identified from the data:
•Higher evaporation, which lowered storage levels, was associated with longer sunshine periods (9-10 hours).
•Moderate sunshine durations (7-8 hours) generated a stabilizing effect with minimal impact on water levels.
2.3 Water balance
Because of growing development, urbanization, and agricultural output, freshwater shortages are predicted, and the amount of water flux across catchments is determined by water balance. Precipitation, surface runoff, and evapotranspiration are components of surface hydrology. Groundwater recharge is calculated using water balance and changes in soil moisture storage as a basis. The increased variability of the water supply necessitates an analysis of both extremes (water surplus and deficit). The following formula, describe (Water Supply) [8]:
Storage change (ds / dt) = Input - Output (1)
ds / dt = P-E T-R-G (2)
where, input- For the general case the input of the water balance equation will be precipitation [rainfall, snow, etc.] while the output will be evapotranspiration ET, the runoff R and infiltration to groundwater basin G [36].
2.4 STELLA program in water storage modeling
2.4.1 Description
Researchers, planners, and educators can better understand how water is stored, managed, and used over time by using the STELLA program, which is very effective in modeling and simulating water storage systems. It depicts the interrelated stocks, flows, and feedback loops that make up a water storage system, including reservoirs, inflows, outflows, and evaporation.
The application assists users in analyzing the dynamics of water balance, assessing system performance under various circumstances, and testing various management approaches to guarantee sustainable water supplies by displaying these interactions [36].
2.4.2 Essential elements for modeling water storage
Stocks: Aquifers and reservoirs are examples of stocks, which stand for water storage.
Flows: Record the water's inflow (rivers, rainfall) and outflow (evaporation, consumption, and irrigation).
Variables: Incorporate influencing elements such as demand fluctuations, seasonal variations, or the effects of climate change.
Feedback Loops: Emphasize interactions, like how evaporation lessened by lower water levels.
2.4.3 Advantages of using STELLA for water storage modeling
STELLA offers water storage modeling for better decision-making by allowing users to explore various situations, simplifying system visualization, and allowing users to construct "what-if" scenarios to evaluate the effects of management strategies, climatic conditions, and infrastructure investments on water availability.
STELLA is a teaching tool for sustainable resource management and water storage dynamics, enabling dynamic time analysis and easy design and exploration for water resource managers and non-specialists without programming experience.
STELLA integrates environmental factors like climate, human activities, and natural events for comprehensive assessments. It also incorporates feedback loops to understand the cascading effects of system changes [37-39].
2.4.4 Predicted model of water storage
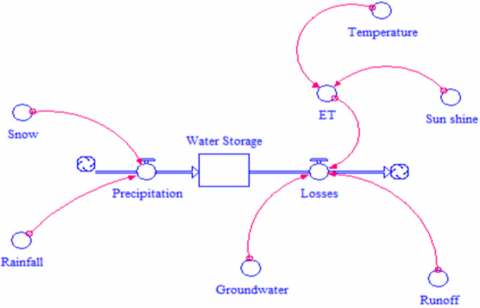
Figure 1 represents the general model, which can calculate and predict the water storage (water surplus and deficit) for any region and may be changed according to its conditions of it.
Figure 1. The general model of water storage
|
refers to the output of water balance equation, which is the water storage. |
|
|
refers to either inflow or outflow of the equation, that is refer to the precipitation (inflow) if it directed to the stock while refer to the losses if it directed out of stock. |
|
|
represents any factor of either inflow or outflow, which is connected with it by the connector [36]. |
|
|
represents the connector. |
Figure 2. The predicted model of water storage for Basra City
The Basra governorate was selected as the study area for this model because of its homogeneous geographical makeup, three weather stations that provide high-precision data for the model's application, and the obvious temporal variation of its climate, which makes it possible to see the factors influencing the water storage calculation. As a result, the following model developed to determine water storage over the period from 2014 until 2023 and for each month of the year, as illustrated in Figure 2.
The predicted model and input data:
The main input data, which are so necessary to construct predicted model of water storage by Stella program for Basra City as case study collected during the period (2014-2023):
Inflow: the monthly average values of rainfall in (mm) for three metrological stations in Basra City were the only resource of inflow to the model.
Outflow: refers to the amounts of water which losses through the following:
Evapotranspiration ET: The symbol ETBC denotes Blaney–Criddle-driven ET values in (mm. month−1) in the equation that uses the daily average air temperature parameter T, whereas the symbol p is used to define the mean monthly percentage of annual month light hours
$E T_{B C}=k p(0.457 T+8.13)$ (3)
In the given equation, the coefficient, k calculated by [34]:
$k=0.0311 T+0.24$ (4)
For the model calculation
$E T=k * p * C$ (5)
where,
$C=[0.457 T+8.13]$ (6)
while k & p as above in Eq. (3).
Therefore, the monthly values of temperature in (℃) and the mean monthly percentage of annual month light hours were collected from the same metrological stations in Basra City for the study period.
Runoff R: In light of the SCS-CN approach, which created by Soil Conservation Services (SCS) of the USA in 1969 and is a straightforward, reliable, and stable conceptual method for estimating direct runoff depth based on storm rainfall depth and catchment-specific characteristics [40]. Runoff in the study area was calculated for the three stations during the period (2014–2023).
Groundwater: Using the cumulative rainfall departure (CRD) approach, the direct recharge as a percentage of rainfall was calculated. As a result, Basra City's groundwater recharge came from 20% of the rainfall [40].
Stock: It refers to water storage which is calculated by Eq. (2).
3.1 Calibration and validation of the model
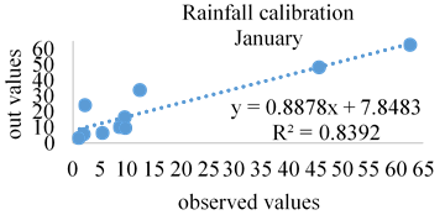
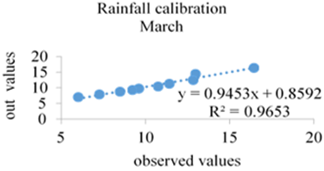
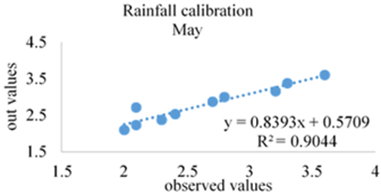
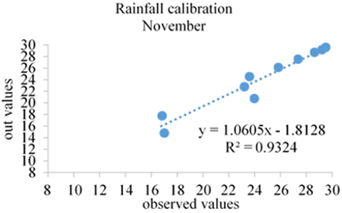
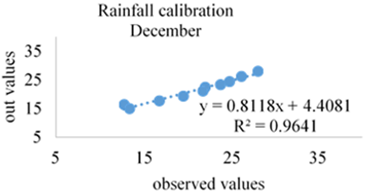
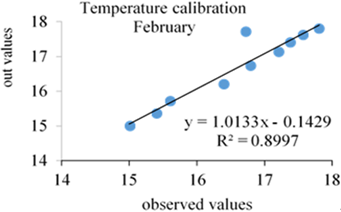
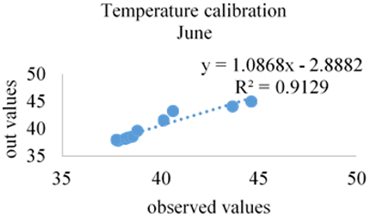
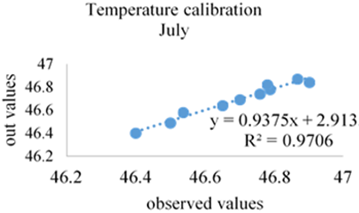
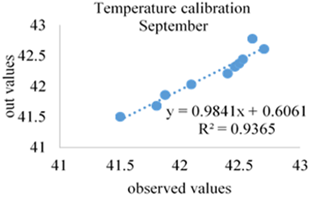
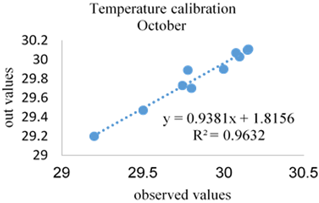
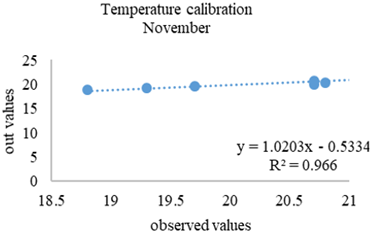
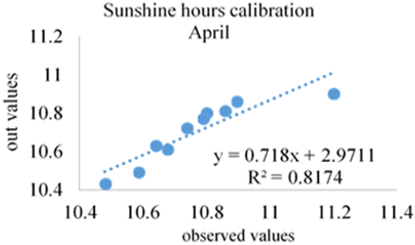
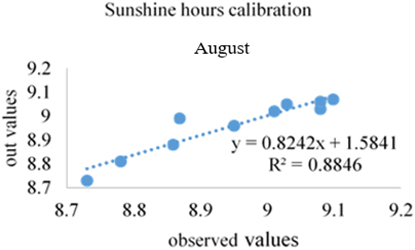
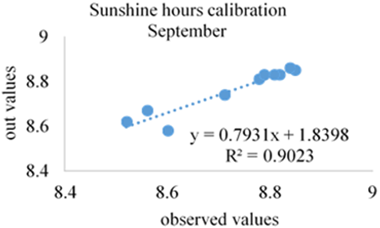
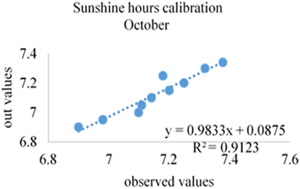
Comparing the observed values of metrological stations for several independent data points that directly affect the amount of water storage with their corresponding values computed using the water storage model allowed for the calibration and validation of the water storage model. Where the data included the average monthly rainfall, temperature, and number of hours of sunshine for every month from 2014 to 2023. The developed model was deemed ready to carry out the procedure of forecasting water storage for roughly fifty future years until 2075 after generating an acceptable model with square root values (R2) ranging between (0.81-0.96) as illustrated in Figures 3-45.
Calibration and validation of the model for rainfall data (Figures 3-9):
Figure 3. January rainfall calibration
Figure 4. February rainfall calibration
Figure 5. March rainfall calibration
Figure 6. April rainfall calibration
Figure 7. May rainfall calibration
Figure 8. November rainfall calibration
Figure 9. December rainfall calibration
The model represents fitted matching for dry month where the values of rainfall equal zero.
Calibration and validation of the model for temperature data (Figures 10-21):
Figure 10. January temperature calibration
Figure 11. February temperature calibration
Figure 12. March temperature calibration
Figure 13. April temperature calibration
Figure 14. May temperature calibration
Figure 15. June temperature calibration
Figure 16. July temperature calibration
Figure 17. August temperature calibration
Figure 18. September temperature calibration
Figure 19. October temperature calibration
Figure 20. November temperature calibration
Figure 21. December temperature calibration
Calibration and validation of the model for sunshine hours are shown in Figures 22-33.
Figure 22. January sunshine hours calibration
Figure 23. February sunshine hours calibration
Figure 24. March sunshine hours calibration
Figure 25. April sunshine hours calibration
Figure 26. May sunshine hours calibration
Figure 27. June sunshine hours calibration
Figure 28. July sunshine hours calibration
Figure 29. August sunshine hours calibration
Figure 30. September sunshine hours calibration
Figure 31. October sunshine hours calibration
Figure 32. November sunshine hours calibration
Figure 33. December sunshine hours calibration
Figure 34. Prediction of water storage values for January
Figure 35. Prediction of water storage values for February
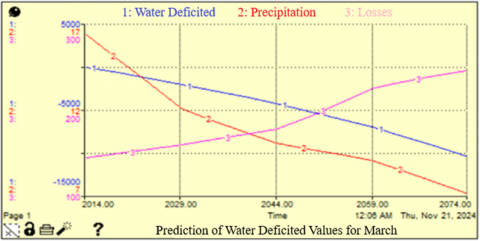
Figure 36. Prediction of water storage values for March
Figure 37. Prediction of water storage values for April
Figure 38. Prediction of water storage values for May
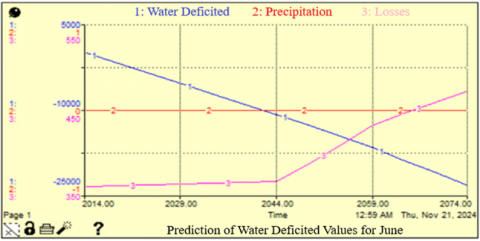
Figure 39. Prediction of water storage values for June
Figure 40. Prediction of water storage values for July
Figure 41. Prediction of water storage values for August
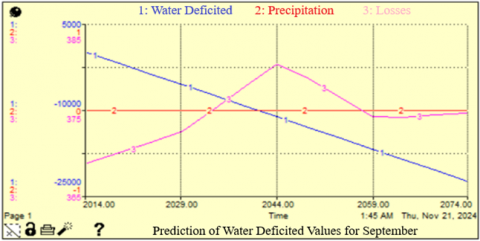
Figure 42. Prediction of water storage values for September
Figure 43. Prediction of water storage values for October
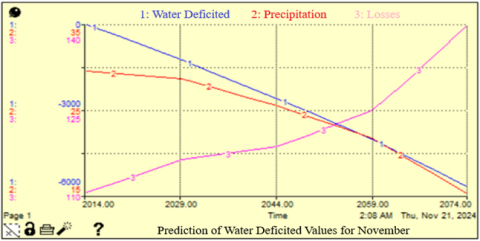
Figure 44. Prediction of water storage values for November
Figure 45. Prediction of water storage values for December
Its effect on evaporation and evapotranspiration is determined by Eq. (3), which computes evapotranspiration as a percentage of monthly sunshine hours to the total number of hours in a year, depending on temperature and sunshine hours. Such that this percentage is calibrated as, the other independent data set and regarded as independent data.
3.2 Predicted model
In this study, the future values of water storage can be determined by application of the predicted model of Basra City for each month, which showed in the figures for all months of the year until 2075.
It is evident from the expected model results that Basra City's water storage changed during the research period, resulting in a water deficit. Since the high temperatures are in contrast to the low rainfall levels, there is no water excess. In other words, the water deficit was at its lowest in January—roughly 3231.67 mm—and at its highest in August—roughly 28622.45 mm at 2075.
This implies that Basra may have a severe drought in the future.
Because of its arid environment, reliance on shared river systems (such as the Tigris and Euphrates), and rising urbanization, Basra, a major urban and commercial center in southern Iraq, confronts substantial issues in managing its water resources. Researchers have advanced scientific knowledge in two crucial areas by looking at water storage modeling in this area:
Better Regional Water Balance Analysis: By addressing Basra's complex water dynamics, it is possible to discover variations in inflow, outflow, and storage, leading to the development of local solutions and techniques that may be applied to other semi-arid and urbanized areas. Developments in Modeling Methods: By focusing on scenario planning, multi-source input validation, and calibration for extreme situations, Basra's insights have improved modeling frameworks for hydrological systems.
Knowledge gained from Basra's water storage research improved knowledge of regional water balance:
Quantitative insights: Information on precipitation, evaporation, groundwater recharge, and withdrawals is incorporated into studies on Basra's water storage. Understanding the water stress and sustainability thresholds in the area requires these data.
Emphasizing salinity challenges: Basra's proximity to the Shatt al-Arab and its interplay with seawater intrusion has taught us important lessons about how to manage the effects of salinity on the amount of accessible freshwater.
Seasonal variability: The studies have emphasised the importance of seasonal variations in river flows and how they interact with infrastructure for water storage or man-made reservoirs.
Hydrological modeling improvements and scenario analysis and data integration studies on Basra's water storage have examined the effects of potential future events including climate change, and rising water demand.
Although recent research on Basra's water storage modelling has yielded insightful findings, it is limited by data constraints, model uncertainties, and a lack of socioeconomic and environmental element integration.
Although recent research on Basra's water storage modelling has yielded insightful findings, it is limited by data constraints, model uncertainties, and a lack of integration of socioeconomic and environmental elements. Improving data quality, honing modelling strategies, and tackling transboundary and urbanization issues should be the top priorities of future study. For Basra and beyond to achieve sustainable water management, an interdisciplinary strategy combining hydrology, climate science, economics, and policy analysis will be crucial.
The prediction model employed in this study is a dynamic model that may be used to determine how much water storage changes depending on the climate in any location or basin.
As demonstrated in the model for the city of Basra, the model can be used to implement a variety of strategies or treatment plans to address unfavorable change values in water storage, such as a water deficit. One such strategy is to alter the values of the model's primary drivers, such as temperature or rainfall.
[1] Al-Sudani, H.I.Z. (2019). Temperature–potential evapotranspiration relationship in Iraq using Thornthwaite method. Journal of University of Babylon for Engineering Sciences, 27(1): 16-25.
[2] Majeed, H.T., Mahmood, D.A., Mahdi, Z.S. (2022). Variation and change of hydro-climatological parameters in Iraq for the period 1980-2019. Environment Asia, 15(3): 14-24. https://doi.org/10.14456/ea.2022.44
[3] Gleick, P.H. (1993). Water in Crisis (Vol. 100). New York: Oxford University Press.
[4] Shiklomanov, I.A. (1991). The world’s water resources. In Proceedings of the International Symposium to Commemorate, 25: 93-126.
[5] UNESCO. (2003). Water for People, Water for Life: The United Nations World Water Development Report. World Water Assessment Programme (United Nations).
[6] Nassif, W.G., Jasim, F.H., Al-Taai, O.T. (2021). Analysis of air temperature, relative humidity and evaporation over Iraq using ECMWF reanalysis. Indian Journal of Ecology, 48(2): 446-452.
[7] Al-Sudani, H.I. (2020). Estimation of water surplus and natural groundwater recharge in Iraq. Journal of University of Babylon for Pure and Applied Sciences, 28(1): 226-236.
[8] Nassif, W.G., Ahmed, M.M., Al-Taai, O.T. (2021). Influence of precipitation and evaporation on water balance in Iraq. Indian Journal of Ecology, 48, 117-123.
[9] Al-Sudani, H.I.Z. (2018). Calculating of groundwater recharge using meteorological water balance and water level fluctuation in Khan Al-Baghdadi Area. Iraqi Journal of Science, 59(1B): 349-359. https://doi.org/10.24996/ijs.2018.59.1B.13
[10] Al-Saedi, Z J., Saeed, A.A. (2021). Estimating a water budget by using remote sensing and GIS technique for the Rabea Basin/Northwest Iraq. Bulletin of Pure & Applied Sciences-Geology, 40(1): 10-17. https://doi.org/10.5958/2320-3234.2021.00002.0
[11] Al-Sudani, H.I.Z. (2018). Study of morphometric properties and water balance using Thornthwaite method in Khanaqin Basin, east of Iraq. Journal of University of Babylon for Engineering Sciences, 26(3): 165-175.
[12] Al-Sudani, H.I.Z. (2019). Derivation mathematical equations for future calculation of potential evapotranspiration in Iraq, a review of application of Thornthwaite evapotranspiration. Iraqi Journal of Science, 60(5): 1037-1048. https://doi.org/10.24996/ijs.2019.60.5.13
[13] Rahi, K.A., Halihan, T. (2018). Salinity evolution of the Tigris River. Regional Environmental Change, 18(7): 2117-2127. https://doi.org/10.1007/s10113-018-1344-4
[14] Mohajerani, H., Zema, D.A., Lucas-Borja, M.E., Casper, M. (2021). Understanding the water balance and its estimation methods. In Precipitation, pp. 193-221. https://doi.org/10.1016/B978-0-12-822699-5.00019-7
[15] Hadi, A.M., Mohammed, A.K., Jumaah, H.J., Ameen, M.H., Kalantar, B., Rizeei, H.M., Al-Sharify, Z.T.A. (2022). GIS-based rainfall analysis using remotely sensed data in Kirkuk Province, Iraq: Rainfall analysis. Tikrit Journal of Engineering Sciences, 29(4): 48-55. http://doi.org/10.25130/tjes.29.4.6
[16] Mahmood-Agha, O.M., Zakaria, S.M., AL-Zakar, S.H. (2023). The impact of meteorological drought on rainwater harvesting in Al-Khoser Basin, Iraq. Tikrit Journal of Engineering Sciences, 30(3): 100-112. http://doi.org/10.25130/tjes.30.3.11
[17] Hasan, I.F., Saeed, Y.N. (2020). Trend analysis of hydrological drought for selected rivers in Iraq. Tikrit Journal of Engineering Sciences, 27(1): 51-57. http://doi.org/10.25130/tjes.27.1.07
[18] Karami, N. (2019). The modality of climate change in the Middle East: drought or drying up? The Journal of Interrupted Studies, 2(1): 118-140. https://doi.org/10.1163/25430149-00201003
[19] Muhammad, S.A., Al-Dabbas, M. (2022). Climatic water balance comparison for selected areas in the middle of Iraq. Iraqi Journal of Science, 63(10): 4328-4341. https://doi.org/10.24996/ijs.2022.63.10.19
[20] Loucks, D.P., van Beek, E. (2017). Water Resources Systems Planning and Management: An Introduction to Methods, Models, and Applications. Springer.
[21] Famiglietti, J.S., Rodell, M. (2013). Water in the balance. Science, 340(6138): 1300-1301. https://doi.org/10.1126/science.1236460
[22] Scanlon, B.R., Ruddell, B.L., Reed, P.M., Hook, R.I., Zheng, C., Tidwell, V.C., Siebert, S. (2017). The food‐energy‐water nexus: Transforming science for society. Water Resources Research, 53(5): 3550-3556. https://doi.org/10.1002/2017WR020889
[23] Gleeson, T., VanderSteen, J., Sophocleous, M.A., Taniguchi, M., Alley, W.M., Allen, D.M., Zhou, Y. (2010). Groundwater sustainability strategies. Nature Geoscience, 3(6): 378-379. https://doi.org/10.1038/ngeo881
[24] James, T., Murray, T., Selmes, N., Scharrer, K., O’Leary, M. (2014). Buoyant flexure and basal crevassing in dynamic mass loss at Helheim glacier. Nature Geoscience, 7: 593-596. https://doi.org/10.1038/ngeo2204
[25] Clark, M.P., Nijssen, B., Lundquist, J.D., Kavetski, D., et al. (2015). A unified approach for process‐based hydrologic modeling: 2. Model implementation and case studies. Water Resources Research, 51(4): 2515-2542. https://doi.org/10.1002/2015WR017200
[26] Hejazi, M.I., Edmonds, J., Clarke, L., Kyle, P., et al. (2014). Integrated assessment of global water scarcity over the 21st century under multiple climate change mitigation policies. Hydrology and Earth System Sciences, 18(8): 2859-2883. https://doi.org/10.5194/hess-18-2859-2014
[27] Rodell, M., Velicogna, I., Famiglietti, J.S. (2009). Satellite-based estimates of groundwater depletion in India. Nature, 460(7258): 999-1002. https://doi.org/10.1038/nature08238
[28] Wang, W., Shen, Y., Chen, Q., Wang, F. (2024). A data-driven method for enhancing spatial resolution in estimating terrestrial water storage changes from satellite gravimetry. IEEE Geoscience and Remote Sensing Letters, 21: 1503105. https://doi.org/10.1109/LGRS.2024.3397816
[29] Zhou, J., Briciu-Burghina, C., Regan, F., Ali, M.I. (2023). A data-driven approach for building the profile of water storage capacity of soils. Sensors, 23(12): 5599. https://doi.org/10.3390/s23125599
[30] Kraft, B., Jung, M., Körner, M., Koirala, S., Reichstein, M. (2021). Towards hybrid modeling of the global hydrological cycle. Hydrology and Earth System Sciences Discussions, 26: 15791614. https://doi.org/10.5194/hess-26-1579-2022
[31] Sher, S., Waseem, M., Waqas, M.M., Rehman, K., Ilyas, M., Waqas, H.A., Kebede Leta, M. (2022). An integrated hydrological modelling approach to evaluate the capacity of Keenjhar lake by using STELLA. Hydrology, 9(5): 90. https://doi.org/10.3390/hydrology9050090
[32] Tapia, E.M., Minjarez, I., Espinoza, I., Minjarez, C. (2014). Use of Stella Software for the modelling of climate change impacts on water balance for the Rio Yaqui Basin, Sonora, Mexico. European Scientific Journal, 10(14): 351-360.
[33] Ouyang, Y., Paz, J.O., Feng, G., Read, J.J., Adeli, A., Jenkins, J.N. (2017). A model to estimate hydrological processes and water budget in an irrigation farm pond. Water Resources Management, 31: 2225-2241. https://doi.org/10.1007/s11269-017-1639-0
[34] Almuktar, S., Hamdan, A.N.A., Scholz, M. (2020). Assessment of the effluents of Basra City main water treatment plants for drinking and irrigation purposes. Water, 12(12): 3334. https://doi.org/10.3390/w12123334
[35] Reinink-Smith, L.M., Carter, R. (2022). Late Holocene development of Bubiyan Island, Kuwait. Quaternary Research, 109: 16-38. https://doi.org/10.1017/qua.2022.3
[36] XMILE – An open standard for system dynamics models. https://blog.iseesystems.com/news-announcements/xmile-faq/.
[37] Ford, A. (2010). Modeling the Environment (Vol. 488). Washington, DC: Island Press.
[38] Sterman, J.D. (2000). Business Dynamics: Systems Thinking and Modeling for a Complex World. MacGraw-Hill Company.
[39] Mashaly, A.F., Fernald, A.G. (2020). Identifying capabilities and potentials of system dynamics in hydrology and water resources as a promising modeling approach for water management. Water, 12(5): 1432. https://doi.org/10.3390/w12051432
[40] Al-Aboodi, A.H., Hassan, A.A., Abbas, S.A. (2018). Estimation of stormwater runoff generated in Basrah province roads for different rainfall recurrence intervals. Technology, 10(1): 922-932.