Fardous N. Jassim*![]() | Sarmad A. Abbas
| Sarmad A. Abbas![]()
© 2024 The authors. This article is published by IIETA and is licensed under the CC BY 4.0 license (http://creativecommons.org/licenses/by/4.0/).
OPEN ACCESS
Grain size distribution is commonly employed to describe sediment transport, depositional environment, sedimentary, and geochemistry. This study aims to investigate the statistical parameters of grain size in the Tigris River, Iraq, to knowledge of the sediment properties of the river. 146 samples were collected from the Tigris River's bed in Kut City, Iraq. Subsequently, the samples were collected and analyzed using a sieve and hydrometer technique. Statistical parameters and distribution of sand, silt, and clay were determined. ArcGIS software version 10.8 was used to create Triangulated Irregular Network (TIN) maps for these sediment particle distributions and statistical parameters. The analysis results samples revealed that the river bed material was composed of sand, representing the highest value (84.31%), followed by silt (12.51%), and then clay (3.18%). Three soil classifications were dependent in this study: USDA soil, Folk soil, and Blott and Pye soil classifications, where sand, silty sand, and very slightly clayey slightly silty sand are the dominant classes for river bed of these classifications, respectively. Statistically, the sediments' average median and mean sizes were 2.6 phi and 2.52 phi, respectively. These indicated fine sand was the majority type of river bed. In addition, the skewness parameter referred to most river sediment being fine-skewed with 36.3%. The kurtosis parameter revealed that the very leptokurtic predominated of bed river at 47.26%. The conclusions indicated a variation in the distribution and grain size of sediment in the study area, which can be attributed to different hydrodynamic processes. The implications of these results suggest that the methodology can be applied in other reaches of the Tigris River and other basins for a comprehensive analysis of sediment grain size distribution. Advanced methodologies are recommended to strengthen future research and applications since comparing results that will be obtained in different ways may provide additional insight into the processes involved.
bed material distribution, Tigris River, grain size analysis, sediment transport, Triangulated Irregular Network (TIN), skewness, kurtosis, sorting
Rivers are crucial ecosystems that provide sufficient water resources essential for the life of humans, agricultural irrigation, and pollution control [1, 2]. It is a dynamic system that operates under the influence of hydraulic and sediment transport mechanisms. Over time, the river suffers changes in its channel cross-section, increased or decreased load of sediment, deposition, and erosion. These changes affect the stability of the river banks and can even lead to changes in morphology [3]. The study of rivers involves a significant topic, sediment properties, which have garnered concerns from workers in biological sciences, geomorphology, hydraulics engineering, hydrology, and environmental sciences. Sediment properties can be classified into two main properties: the physical characteristics, such as the distribution of particle sizes and mineral composition, and the chemical attributes, such as the pollutants and chemical compounds absorbed by the sediment [4]. Sediment in rivers refers to the total quantity of sediment that has been carried through each cross-section over a specific period. When this occurs, it will not only influence the shape of the river but also lead to instability of the river channel, resulting in significant harm to the hydraulic structures along the river. Additionally, it will reduce the capacity of the channel to carry floodwater downstream effectively [3, 5].
Grain size is an essential characteristic of sediment that dramatically influences its physical and mechanical properties, as well as their potential applications. It also provides valuable insights into their origins, deposition processes, and the aquatic environments they inhabit in rivers [6, 7]. Moreover, analysing sediment grain size and its textural characteristics provides significant insights into deposition processes and hydrodynamic conditions. It offers essential insights for ecological conservation by providing habitat suitability, resource availability, water quality, and nutrient cycling [8]. The source material and the processes of transportation have an impact on the distribution and composition of sediment grain sizes. Grain sizes vary greatly depending on the type of sediment and environmental conditions [9, 10]. Different methods were employed for the determination of grain size involving sieve and hydrometer analysis, sedimentation, as well as measurement by Coulter counter, laser granulometry, and X-ray sedigraph [7]. Based on the analysis of sediment grain size, we could assess the mean grain size, degree of sorting, skewness, and kurtosis parameters [11]. Analyzing the spatial and variation distribution of the average grain size, sorting, and skewness is a technique for determining the routes of sediment transport. The changes in sediment grain sizes give useful details on the sediment's composition and characteristics, enabling distinguishing between different sediment types. Furthermore, these characteristics contribute to the interpretation of sediment distribution, the analysis of transport mechanisms, and the identification of deposition patterns [12].
Based on the sorting parameter of the samples, the sediment particles that have the same size are classified as well sorted, in contrast to sediment particles that have various sizes, which are classified as poorly sorted. The Skewness parameter assesses the degree to which the distribution of sediment particles deviates from symmetry. These show either positive or negative skewness depending on the size of the sediment. A positive skewness is linked to the presence of fine sand, whereas a negative skewness is linked to the presence of coarse sand [13]. Concerning kurtosis parameter is not affected by the environment, as skewness. In addition, it does not provide any information about the deposition or erosion processes of the sediment [14]. Mesokurtic gives the peakedness degree of a normal distribution curve. A sharper peak indicates leptokurtic, while a flatter peak gives platykurtic [15].
In 1984, Al-Ansari and Toma [16] conducted a study on the bed features of the Tigris River, specifically between the Alma and Suraliya bridges. A total of 109 sediment samples were collected from the riverbed. The results showed that the overall riverbed area consisted predominantly of sand and clay. The statistical parameters of the sediments revealed a decrease in the median and mean values towards the islands. Furthermore, the sediments demonstrate a well-sorted, fine-skewed distribution and a kurtosis ranging from Platykurtic to mesokurtic.
Al-Ansari et al. [17] studied the sediment bed of the Mosul reservoir in Iraq and collected 56 samples from it. After analysis, these samples contained gravel (3.8%), sand (15%), silt (55.5%), and clay (25.7%). However, sand percentages are highest in the northern reservoir zone where the River Tigris enters and gradually decrease toward the dam site. Silt decreases and clay increases near the dam. Statistical parameters showed that sediment median and mean sizes were 2.81 and 6.1 phi. Poorly sorted, and nearly symmetrical in sorting and skewness parameters, as well as kurtosis parameter was leptokurtic, very leptokurtic, and mesocratic sediments. It concluded that the Tigris River entrance and side tributary valleys have had the greatest impact on sediment distribution and characteristics.
Another study was carried out on the sediment bed of the Tigris River in Baghdad, covering a distance of around 18 kilometers by Al-Ansari et al. [18]. In total, 46 bed samples were analyzed. The results illustrated that the river bed was predominantly fine sand (90.74%). Moreover, the mean and median sediment sizes were 2.49 phi and 2.58 phi, respectively. Statistically, the parameters of the river bed particles were classified as Leptokurtic, fine-skewed, and moderately sorted.
Hassan et al. [19] carried out a study of the Dukan Dam Reservoir, which is located on the Lesser Zab River, a tributary of the Tigris River. Sediment samples were collected from thirty-two locations of the reservoir. The results revealed that the bed of the reservoir consists mainly of 48% silt, followed by 23% clay, 15% gravel, and 14% sand, respectively. Statistically, the sorting parameter showed that the sediments were very poorly sorted. For the skewness parameter, sediment particle distribution was strongly coarse skewed. Finally, the kurtosis parameter of the reservoir bed material was mesokurtic.
The literature survey in the introduction showed that limited studies were conducted to analyze sediment characteristics and distribution along the Tigris River in the Iraqi borders. These studies were carried out at different locations on this river, but no studies in this region despite its significance. The aim to fill the knowledge gap in this area, the sediment's grain size and distribution were analyzed using statistical parameters for the Tigris River D/S Kut barrage. The current study covers this region and offers the first attempt to look into the distribution of grain sizes.
2.1 Study area
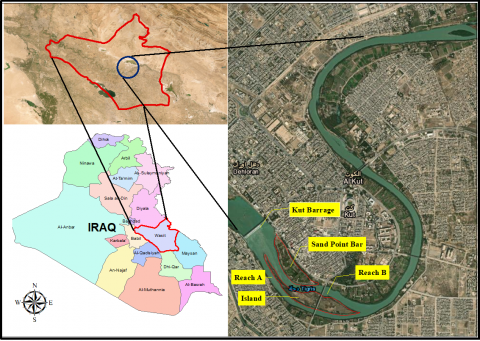
Kut barrage is the oldest and longest barrage on the largest river in Iraq, which was built on the Tigris River in Wasit Governorate, Iraq, in 1939 by the British firm Balfour Beatty. It consists of fifty-six gates and with a length of 550 meters. The Kut barrage is a crucial irrigation facility on the Tigris River, serving as the primary regulator of water distribution among the governorates of Wasit, Dhi-Qar, and Maysan. Furthermore, it ensures the protection and stability of irrigation projects on the Dujaila project, as well as the Garraf River. The study area of this research starts from Downstream (D.S) Kut Barrage and extends for 10 kilometers, as seen in Figure 1. The specified location lies within the latitude coordinates of 32º 29’ 049’’ N and 32º 31’ 041’’ N, and the longitude coordinates of 45º 49’ 009” E and 45º 51’ 003” E.
Figure 1. Study area location
2.2 Data collection and analysis
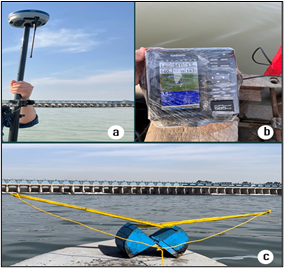
One hundred forty-six sediment samples from forty-eight cross-sections were collected. There was a range of 100 to 250 meters between each cross-section. For every cross-section, three samples were taken from the left, center, and right. Additionally, samples were taken from the island's beginning and end. The number and location of sampling verticals should be selected based on the required accuracy of the measurements. The Interagency Committee on Water Resources presents and briefly discusses the prevalent methods employed [20]. This study selected the sampling verticals at a quarter, one-half, and three-quarters of the stream's width at each cross-section. The locations of the samples collected from the entire bottom across the Tigris River were projected on the satellite image using Arc/GIS software, as illustrated in Figure 2. The work was conducted from January to March 2023, using a boat equipped with GPS STONEX S900A and an echo sounder GPSMAP 585 plus to define the absolute x, y, and z coordinates of the sample locations in the Tigris River. A Van Veen Grab sampler was used to collect bed material samples, and one kg of the sample was collected from the riverbed at each sampling location. Figure 3 illustrates the instruments used for collecting these samples.
Figure 2. Bed material sample’s locations
Figure 3. Instruments of collecting sediment samples: (a) GPSSTONEX S900A; (b) echo sounder GPSMAP 585 plus; (c) Van Veen Grab sampler
Figure 4. Details of laboratory works
(a). Right bed material sample
(b). Center bed material sample
(c). Left bed material sample
Figure 5. Accumulative curves right, center, and left of cross-section 1
The van Veen Grab was manufactured from stainless steel. The water needed stability during sample collection, and the boat had to be positioned at the location specified. The Van Veen Grab had to be carefully lowered into the river and connected to the cord used for its drop. Moreover, this method is simple and provides a good sample. Throughout the drop, the two buckets remained open via a hook. Upon contact of the grab with the river bed, the tension on the hook decreases. Then, the hook was drawn out, and the buckets closed automatically [21]. The samples were kept in robust plastic bags and stored in containers. These samples were dried in an oven at 105℃ for 12 hours before sieving. sieving process of the samples was completed using a series of sieves with sizes of 4.75, 2, 0.85, 0.425, 0.25, 0.106, and 0.075mm. For ten minutes, the entire set was put on the mechanical shaker. The sediment sample was shaken, and then an electronic digital scale was used to weigh the sample retained on each sieve and pan. based on ASTM D 422 specifications [22]. The silt and clay particles smaller than 0.075mm were analyzed using hydrometer analysis. Subsequently, 50g of sediment was treated with a sodium hexametaphosphate solution at 40g/L. The hydrometer readings obtained percent finer particle size according to ASTM D422 [22]. All tests were done at the laboratories of the Engineering College/Civil Engineering Department of Wasit University, as illustrated in Figure 4. Figure 5 displays accumulative curves of bed material of cross-section 1 (Right, Center, Left).
2.3 Data analysis
The sediment grain size is expressed in the phi (φ) scale, which was established by Folk and Ward in 1957 [23]. Where: sediment particle size (φ), and sediment particle diameter (d) (mm).
$\varphi=-\log _2 d$
The average grain size refers to the mean value of the grain sizes, which is determined by applying the following equation:
$M=\frac{\varphi_{16}+\varphi_{50}+\varphi_{8 4}}{3}$ (1)
The sorting or spread of particle sizes around the mean is represented by the standard deviation. The determination of sorting was applying a mathematical approach that involves calculating the sorting using the following equation [23]. Table 1 shows the range of sorting degree values.
$S=\frac{\varphi_{84}-\varphi_{16}}{4}+\frac{\varphi_{95}-\varphi_5}{6.6}$ (2)
Table 1. Relation of grain size with sorting degree [23]
|
S |
Sorting Degree |
|
Less than 0.35 |
Very Well Sorted |
|
0.35 to 0.50 |
Well Sorted |
|
0.50 to 1.00 |
Moderately Sorted |
|
1.00 to 2.00 |
Poorly Sorted |
|
1.00 to 2.00 |
Poorly Sorted |
|
2.00 to 4.00 |
Very Poorly Sorted |
|
More than 4.00 |
Extremely Poorly Sorted |
The parameters consider the symmetry or preferred spread to one side of the average, known as skewness. The determination of skewness relies on the value of the standard deviation. The distribution is negative if there is an excess of large particles in a grain size distribution. In contrast, the distribution is positive if there are excess fine particles. The skewness can be determined using the equation below [24]. Values limit of skewness degree illustrated in Table 2.
$S k=\frac{\varphi_{84}+\varphi_{16}-2 \varphi_{50}}{2\left(\varphi_{84}-\varphi_{16}\right)}+\frac{\varphi_{95}+\varphi_5+2 \varphi_{50}}{2\left(\varphi_{95}-\varphi_5\right)}$ (3)
Table 2. Relation of grain size with skewness degree [23]
|
SK |
Skewness Degree |
|
1.00 to 0.30 |
Strongly Skewed |
|
0.30 to 0.10 |
Fine Skewed |
|
0.10 to-0.10 |
Symmetrical |
|
- 0.10 to-0.30 |
Coarse Skewed |
|
- 0.30 to-1.00 |
Strongly Skewed |
Kurtosis refers to the concentration degree of the grains relative to the mean value. The Eq. (4) is used to calculate kurtosis [23]. Table 3 presents the range values of the kurtosis degree.
$K=\frac{\left(\varphi_{95}-\varphi_5\right)}{2.44\left(\varphi_{75}-\varphi_{25}\right)}$ (4)
Table 3. Relation of grain size with kurtosis of degree [23]
|
K |
Kurtosis Degree |
|
Less than 0.67 |
Very Platykurtic |
|
0.67 to 0.90 |
Platy-Kurtic |
|
0.90 to 1.11 |
Mesokurtic |
|
1.11 to 1.50 |
Leptokurtic |
|
More than 1.50 |
Very Leptokurtic |
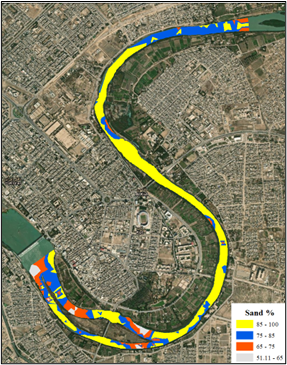
Figure 6. Sand distribution of study reach bed
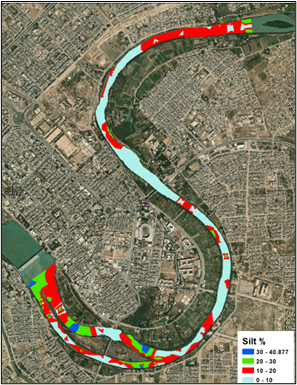
Figure 7. Silt distribution of study reach bed
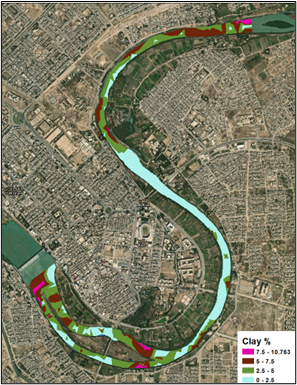
Figure 8. Clay distribution of study reach bed
In the cumulative frequency curve $\emptyset_5, \emptyset_{16}, \emptyset_{25}, \emptyset_{50}, \emptyset_{75}, \emptyset_{84}, \emptyset_{95}$ reprecent the 5th, 16th, 25th, 50th, 75th, 84th and 95th percentiles, respectively.
After completing the analysis samples and adding them to ArcGIS, a Triangulated Irregular Network (TIN) was generated using 3D analyst tools and data management in ArcGIS software version 10.8. It is a prominent platform in the GIS field, mainly utilised in civil engineering due to its adaptability and sophisticated spatial analysis capabilities. The main justification for its implementation is the comprehensive and robustness suite of tools that enable the efficient and accurate creation, management, and analysis of geospatial data [25].
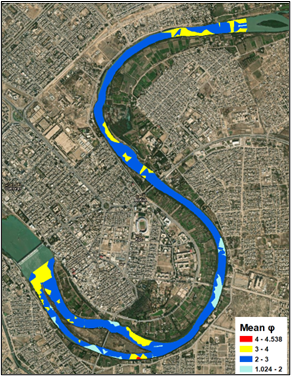
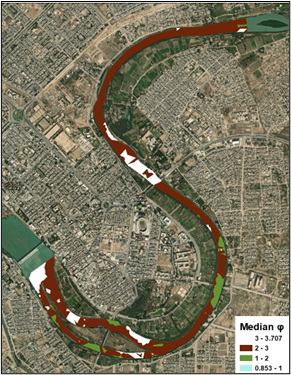
TIN maps were generated for the percentage distribution of sand, silt, and clay along the specified area (see Figures 6-8). They were also designed to show the distribution of statistical parameters, such as skewness, kurtosis, mean, median, sorting, and so on, as shown in Figures 9-13.
Figure 9. Mean distribution of study reach bed
Figure 10. Median distribution of study reach bed
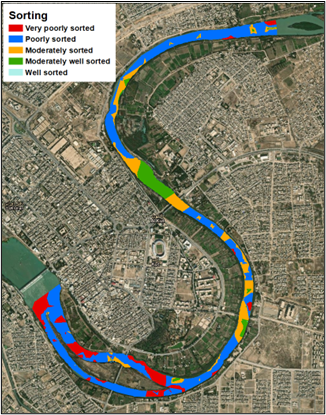
Figure 11. Sorting parameter distribution of study reach bed
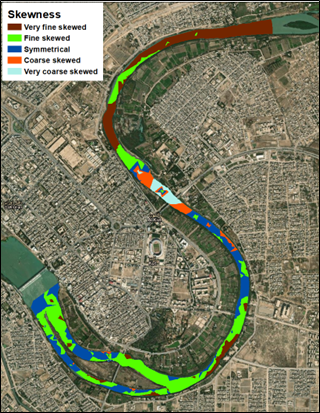
Figure 12. Skewness parameter distribution of study reach
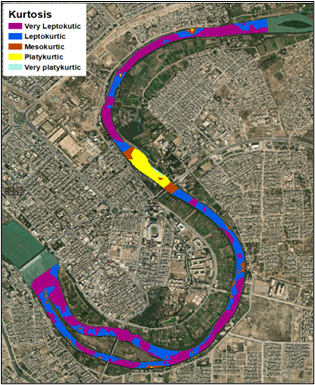
Figure 13. Kurtosis parameter distribution of study reach bed
Grain size analysis is a valuable method for obtaining more significant knowledge of the origin of sediment, its history of transportation, and the depositional environments.
Generally, the river bed of the studied reach is predominantly composed of sand, at 84.31%, followed by silt and clay at 12.51% and 3.18%, respectively. Figures 6-8 illustrate the distribution of sand, silt, and clay of the studied. reach, respectively, depending on the results of grain size analysis.
Table 4. USDA soil classification of the study reach samples
|
USDA Class |
No. of Samples |
Percentage % |
|
Sand |
74 |
50.68 |
|
Loamy Sand |
40 |
27.4 |
|
Sandy Loam |
31 |
21.23 |
|
Loam |
1 |
0.685 |
Table 5. Folk soil classification of the study reach samples
|
Folk Class |
No. of Samples |
Percentage % |
|
Sand |
60 |
41.1 |
|
Silty Sand |
79 |
54.11 |
|
Muddy Sand |
7 |
4.79 |
Table 6. Blott and Pye soil classification of the study reach
|
Blott & Pye Class |
No. of Samples |
Percentage % |
|
sand |
3 |
2.1 |
|
silty sand |
2 |
1.37 |
|
slightly silty slightly clayey sand |
16 |
10.95 |
|
very slightly silty very slightly clayey sand |
12 |
8.22 |
|
very slightly silty sand |
29 |
19.86 |
|
very slightly clayey silty sand |
5 |
3.43 |
|
very slightly clayey slightly silty sand |
42 |
28.767 |
|
slightly silty sand |
14 |
9.59 |
|
slightly clayey silty sand |
23 |
15.75 |
According to Table 4, textural classification by the United States Department of Agriculture (USDA) [26], the predominant sediment in the bed river is sand (50.68%), followed by loamy sand (27.4%), sandy loam (21.23%), and loam (0.685%).
Different results were obtained when Folk's classification was used [24]. The main components of sediment samples were sand 41%, followed by silty sand 54%, and the remaining 4.79% muddy sand, as seen in Table 5.
Blott and Pye [27] illustrated a more recent and detailed classification in Table 6, where 28.767% of the samples were very slightly clayey slightly silty sand. These are followed by 19.86% very slightly silty sand, 15.75% slightly clayey silty sand, 10.95% slightly silty slightly clayey sand, 9.59 slightly silty sand, 8.22 very slightly silty very slightly clayey sand, 3.43% very slightly clayey silty sand, 2.1% sand, and 1.37 silty sand.
The results of statistical parameters analysis were used to describe the distribution of sediment grain sizes. These parameters involve mean and median values, sorting, skewness, and kurtosis parameter.
The bed material of the D.S. Kut barrage consisted mainly of grain size, with a mean ranging from 1.024 to 4.538 phi and a median from 0.853 to 3.707 phi, as shown in Figures 9 and 10. The sediment samples' analysis revealed that the study reach's median grain size and average mean were 2.52 phi and 2.6 phi, respectively.
The river is divided into two channels around the big island, which extends approximately 2km. This division changes the flow pattern and disturbs the sediments. The mean range is (1.024-4.538), and the median is (1-3.707phi) along the two channels.
Generally, there are changes in the sediment mean size that can be recognized at specific locations in the river. For the distribution of the mean along the river bed, see Figures 9 and 10. The mean values of the start and end island are 3 and 2.5 phi, respectively, and the median of these are 2.93 and 2.6 phi, respectively, indicating grain size decreases toward the islands. This is because most of the deposition is from suspended material, in addition to the decrease of flow velocity within the island's vicinity. Furthermore, water's current speed significantly impacts sediment grain size [11].
According to a comparison with previous studies, the sediments on the Tigris River bed were coarser. This is because coarse sediments have been trapped within the Adhaim reservoir, which was built on the Adhaim tributary in 1999. Because of this, the bed's grain size decreased [18].
The study area is classified into five classes, as revealed in Table 7. The majority of sediment sorting classes are poorly sorted, with 39.73% of the deposited sediments, followed by 23.97% moderately sorted, 23.287 very poorly sorted, 10.27 moderately well-sorted, and the remaining sediments were well-sorted forms only 2.74%. Poorly sorted sediments were distributed along the study area.
Although most were poorly sorted along the study area, moderately sorted to moderately well-sorted were distributed along the meander. Very poorly sorted appeared at the start and end of the study area as well as along two channels created by the island as seen in Figure 11. It is attributed to the random accumulation of particle size and it was affected by the morphology of the river. Moreover, it can be revealed that poor sorting was caused by variable current velocity, so the accumulated sediment grains would be relatively various distributions. In other words, sorting is poor, and the sediments are fine in low-energy environments. while coarse sediments with well sorting in a high-energy environment [28].
The skewness statistical values indicate the sediment's sources and transport direction [29]. They are calculated to determine the grain size distribution's degree of symmetry or asymmetry. The energy conditions of the depositing environment can be connected to the sign of skewness. Skewness is the sediment grain size parameter most sensitive to variations in the depositing medium's energy [12].
In the study region, the river bed sediment samples varied from very coarse skewed to very fine skewed, as shown in Figure 12. The fine-skewed (positive skewed) predominated the study area and represented 36.3% of the total deposited sediments of the river bed, as shown in Table 8. The fine skewed were distributed in the first part and limited locations in the second part of the river bed. very fine skews were 28.1% concentrated in the second part and regions adjacent to the river banks of the first part, as illustrated in Figure 12. The study area's positive skew implies a relatively low flow velocity, which can significantly impact sediment transport. Consequently, it means an environment with low energy where sedimentation develops. On the other hand, because the physical effects are minimal when the skewness is small, the region can be categorised as one where sedimentation is dominant [24]. The symmetrical constituted 30.14% of the total sediment, concentrated in the first half of the reach only.
Table 7. The sorting parameter of the river bed samples
|
Type of Sorting |
No. of Samples |
Percentage % |
|
Very well sorted |
0 |
0 |
|
Well sorted |
4 |
2.74 |
|
Moderately well sorted |
15 |
10.27 |
|
Moderately sorted |
35 |
23.97 |
|
Poorly sorted |
58 |
39.73 |
|
Very poorly sorted |
34 |
23.287 |
|
Extremely poorly sorted |
0 |
0 |
Table 8. The skewness parameter of the riverbed sample
|
Type of Skewness |
No. of Samples |
Percentage % |
|
Very fine skewed |
41 |
28.1 |
|
Fine skewed |
53 |
36.3 |
|
Symmetrical |
44 |
30.14 |
|
Coarse skewed |
5 |
3.42 |
|
Very coarse skewed |
3 |
2.06 |
Table 9. Kurtosis parameter of the river bed samples
|
Type of Kurtosis |
No. of Samples |
Percentage% |
|
Very platykurtic |
1 |
0.68 |
|
Platykurtic |
6 |
4.11 |
|
Mesokurtic |
22 |
15.07 |
|
Leptokurtic |
48 |
32.876 |
|
Very leptokurtic |
69 |
47.26 |
|
Extremely leptokurtic |
0 |
0 |
The presence of mesokurtic sediment demonstrated that the energy environment here is typically uniform. The remaining coarse skewed and very coarse skewed (negative skewed) were 3.42% and 2.06%, respectively. These were concentrated only in the middle of the study area. Negative skewness detects the erosion (non-deposition) process. This area's erosion appears to be a high-energy environment. The sediments are fine and showed positive skewness in a low-energy environment. while coarse sediments usually have positive or negative skewness in high-energy environments [28].
A statistical parameter called kurtosis is used to describe the distribution of particle sizes in a sediment sample. It shows how the distribution is shaped; a distribution with more extreme values or heavier tails is given by positive kurtosis, whereas a distribution with fewer extreme values or lighter tails than a standard distribution is indicated by negative kurtosis [15]. It provides a distribution's degree of peakiness based on a normal curve (mesokurtic). A steeper peak indicates leptokurtic, while a flatter peak indicates platykurtic [12].
The kurtosis parameter is not influenced by environmental factors, unlike skewness, and does not provide insights into the depositional or erosional characteristics of sedimentary sites [14].
The calculation of the kurtosis statistical parameter illustrated that the predominant sediments deposited in the downstream Kut barrage bed are leptokurtic at 47.26%, distributed along the study area. In contrast, the very platykurtic type had the lowest distribution at 0.68%. The mesokurtic and platykurtic types represented 15.07% and 4.11% of the total deposited sediments, respectively. These types are mainly concentrated in the half area of the study.
The leptokurtic percentage was 32.876%, predominantly seen along the reach except in the middle of the reach study. Table 9 and Figure 13 illustrate all these details. greater uniformity and better grain size sorting are indicated by sediment deposits found in high-energy environments, which typically exhibit distributions with platykurtic (low kurtosis). In contrast, distributions with leptokurtic (higher kurtosis) are frequently found in sediments that accumulate in low-energy environments, indicating less well-sorted grain sizes [12]. As a result, the current study area can be classified as a low-energy environment, which contributes to the long study reach dominance of very leptokurtic grains. Conversely, the center of the study area is typically platykurtic because of the high-energy environments.
The findings of this study have important implications for determining and analysing sediment distribution and transport mechanisms, supporting sustainable development strategies. In addition, they provide essential information for decision-makers in water resource management and promote environmental health and safety. Concerning, river morphology may be locally influenced by sediment transport, which provides varying sediment grain sizes.
There are some limitations to the study. The quality of the in-field data collected and the GPS's accuracy are major factors in the data's accuracy. Furthermore, because the methodology was used in this specific reach, it must be applicable in other areas in order to provide comprehensive information.
This study was carried out on the sediments of the riverbed for the Tigris River starting from downstream of Kut Barrage, extending approximately 10 kilometers. based on the results obtained in this study, the Blott and Pye, USDA, and Folk soil classifications were used to distribute sediment grain size. The main classes that dominated each classification were sand, silty sand, and very slightly clayey slightly silty sand for USDA, Folk, and Blott, and Pye soil classifications, respectively. It was noticed that sand dominated the cover of most river bed at 84.31%, followed by silt and clay at 12.51% and 3.18%, respectively. Through statistical parameter analysis of sediment particle size, it was determined the average mean and median particle size of the river 2.6 phi and 2.52 phi, respectively. These indicated that fine sand was the majority type of river bed.
Concerning the sorting values of the river bed, mostly sediment grain size was sorted as poorly sorted at 39.73% of the river bed sediment and distributed along the study reach.
The results of the skewness parameter referred to the sediment of the river as primarily fine-skewed (coarse sediment materials) with 36.3%. It is distributed mainly in the first part and limited locations in the second part of the river reach. Concerning kurtosis, the analysis results revealed that the very leptokurtic classes predominated at 47.26%. They were seen along the reach except in the middle part.it is indicated that the distribution of sediment particle size and variation in the river can be attributed to various hydrodynamic processes.
The results of this study support sustainable development strategies by providing significant implications for analysing and determining sediment distribution and transport mechanisms. They also support environmental health and safety and give decision-makers essential data for managing water resources.
Further research suggests that the methodology can be applied in other reaches of the Tigris River and other basins for a comprehensive analysis of sediment grain size distribution. Advanced methodologies, such as Principal Component Analysis, CM image, multivariate statistics, end-member modeling analysis, and combining hierarchical cluster analysis, are recommended to strengthen future research and applications since comparing results that will be obtained in different ways may provide additional insight into the processes involved.
This paper includes part of the partial fulfillment of Ph.D. dissertation in Civil Engineering/Water Resources at the University of Basrah which is being supervised by Prof. Dr. Sarmad A. Abbass, includes this paper. The authors express their deepest gratitude to the Engineering College/Civil Engineering Department of the University of Wasit for encouraging this study.
|
d |
Sediment grain diameter, mm |
|
M |
Mean grain size |
|
S |
Sorting parameter |
|
Sk |
Skewness parameter |
|
K |
Kurtosis parameter |
|
TIN |
Triangulated Irregular Network |
|
USDA |
United States Department of Agriculture |
|
ASTM |
American Society for Testing and Materials |
|
GIS |
Geographic information system |
|
Greek symbols |
|
|
$\varphi$ |
Sediment grain size, phi |
[1] Wang, Y., He, Y., Zhan, J., Li, Z. (2022). Identification of soil particle size distribution in different sedimentary environments at river basin scale by fractal dimension. Scientific Reports, 12(1): 10960. https://doi.org/10.1038/s41598-022-15141-6
[2] Kiat, C.C., Ab Ghani, A., Abdullah, R., Zakaria, N.A. (2008). Sediment transport modeling for Kulim River-A case study. Journal of Hydro-environment Research, 2(1): 47-59. https://doi.org/10.1016/j.jher.2008.04.002
[3] Al-Hadeethi, R., Hacham, W.S. (2023). Reducing energy consumption in Iraqi campuses with passive building strategies: A case study at Al-Khwarizmi College of Engineering. International Journal of Energy Production and Management, 8(3): 177-186. https://doi.org/10.18280/ijepm.080306
[4] Xu, J. (2000). Grain-size characteristics of suspended sediment in the Yellow River, China. Catena, 38(3): 243-263. https://doi.org/10.1016/s0341-8162(99)00070-3
[5] Mohammed-Ali, W.S., Khaleel, E.H. (2023). Assessing the feasibility of an explicit numerical model for simulating water surface profiles over weirs. Mathematical Modelling of Engineering Problems, 10(3): 1025-1030. https://doi.org/10.18280/mmep.100337
[6] Duquesne, A., Carozza, J.M. (2023). Improving grain size analysis to characterize sedimentary processes in a low-energy river: A case study of the Charente River (Southwest France). Applied Sciences, 13(14): 8061. https://doi.org/10.3390/app13148061
[7] Blott, S.J., Pye, K. (2001). Gradistat: A grain size distribution and statistics package for the analysis of unconsolidated sediments. Earth Surface Processes and Landforms, 26(11): 1237-1248. https://doi.org/10.1002/esp.261
[8] Perera, U.L.H.P., Ratnayake, A.S., Weerasingha, W.A.D.B., Subasinghe, H.C.S., Wijewardhana, T.D.U. (2023). Grain size distribution of modern beach sediments in Sri Lanka. Anthropocene Coasts, 6(1): 10. https://doi.org/10.1007/s44218-023-00025-7
[9] Allen, J.R. (2012). Principles of physical sedimentology. Springer Science & Business Media. https://doi.org/10.1007/978-1-4613-2545-1
[10] Putra, P.S., Nugroho, S.H. (2017). Distribusi sedimen permukaan dasar laut perairan sumba, nusa tenggara timur. OLDI (Oseanologi dan Limnologi di Indonesia), 2(3): 49-63. https://doi.org/10.14203/oldi.2017.v2i3.118
[11] Muhardi, M., Nurrahman, Y.A., Risko, R., Muliadi, M., Rahayu, K., Susiati, H. (2022). Statistical parameters analysis of sediment grain size from Raya River Bengkayang regency, west Borneo. Bulletin of The Marine Geology, 36(2): 380938. https://doi.org/10.32693/bomg.36.2.2021.726
[12] Mutaqin, B.W., Isnain, M.N., Ningsih, R.L., Darmawan, H., Suratman. (2024). Grain size and sedimentation process in the Anak Krakatau coastal area of Indonesia. Results in Earth Sciences, 2: 100018. https://doi.org/10.1016/j.rines.2024.100018
[13] Duane, D.B. (1964). Significance of skewness in recent sediments, western Pamlico Sound, North Carolina. Journal of Sedimentary Research, 34(4): 864-874. https://doi.org/10.1306/74D711B8-2B21-11D7-8648000102C1865D
[14] Friedman, G.M. (1961). Distinction between dune, beach, and river sands from their textural characteristics. Journal of Sedimentary Research, 31(4): 514-529. https://doi.org/10.1306/74D70BCD-2B21-11D7-8648000102C1865D
[15] Friedman, G.M. (1962). On sorting, sorting coefficients, and the lognormality of the grain-size distribution of sandstones. The Journal of Geology, 70(6): 737-753. https://doi.org/10.1086/jg.70.6.30066373
[16] Al-Ansari, N.A., Toma, A. (1984). Bed characteristics of the river Tigris within Baghdad. Journal of Water Resources, 3(1): 1-23. https://www.researchgate.net/publication/282337042
[17] Al-Ansari, N., Issa, I.E., Sherwani, G., Knutsson, S. (2013). Sedimentation in the Mosul reservoir of northern Iraq. Journal of Environmental Hydrology, 21(7): 1-10. https://doi.org/10.4236/eng.2013.510094
[18] Al-Ansari, N., Ali, A.A., Al-Suhail, Q., Knutsson, S. (2015). Flow of river Tigris and its effect on the bed sediment within Baghdad, Iraq. Open Engineering, 5(1): 465-477. https://doi.org/10.1515/eng-2015-0054
[19] Hassan, R., Al-Ansari, N., Ali, S.S., Ali, A.A., Abdullah, T., Knutsson, S. (2016). Dukan dam reservoir bed sediment, Kurdistan Region, Iraq. Engineering, 8(9): 582-596. https://doi.org/10.4236/eng.2016.89054
[20] Khassaf, S.I., Hassan, A.A. (2014). Three-dimensional sediment transport modeling for the upstream of Al-Amarah Barrage. International Journal of Engineering Research & Technology, 3(6): 848-855. https://www.researchgate.net/publication/309565449.
[21] Eijkelkamp Soil & Water. (2018). Van Veen Grab Sampler. (2018). https://aqualab.com.au/van-veen-grab-sampler/.
[22] ASTM International. (2014). Standard test method for particle-size analysis of soils. ASTM Standards. https://doi.org/10.1520/D0422-63R07
[23] Folk, R.L., Ward, W.C. (1957). Brazos River Bar (Texas): A study in the significance of grain size parameters. Journal of Sedimentary Research, 27(1): 3-26. https://doi.org/10.1306/74d70646-2b21-11d7-8648000102c1865d
[24] Folk, R.L. (1980). Petrology of Sedimentary Rocks. Hemphill Publishing Company. http://hdl.handle.net/2152/22930.
[25] Hernán Jimenez-Palomino, W., Miguel Soto-Juscamayta, L., Henrry Ccatamayo-Barrios, J., Leonardo Bendezú-Prado, J., Berrocal-Argumedo, K., Agustín Esparta-Sanchez, J., Margarita Maldonado-Llacua, G., Cesar Mayorga-Rojas, J., Alberto Romero-Baylon, A. (2024). Implementation of a GIS for the conservation of irrigation canals: Using ArcGIS and Python for automation. Mathematical Modelling of Engineering Problems, 11(9): 2337-2346. https://doi.org/10.18280/mmep.110907
[26] Baillie, I.C. (2001). Book review: Soil Survey Staff. 1999, Soil Taxonomy. A basic system of soil classification for making and interpreting soil surveys. In Agricultural Handbook 436, Natural Resources Conservation Service, USDA, Washington DC, USA, pp. 57-60. https://doi.org/10.1111/j.1475-2743.2001.tb00008.x
[27] Blott, S.J., Pye, K. (2012). Particle size scales and classification of sediment types based on particle size distributions: Review and recommended procedures. Sedimentology, 59(7): 2071-2096. https://doi.org/10.1111/j.1365-3091.2012.01335.x
[28] Kim, S., Ahn, J., Kim, H., Kwon, H., Kim, G., Shin, D., Yang, D. (2018). The distribution characteristics of grain size and organic matters of surface sediments from the Nakdong-Goryeong mid-watershed. Journal of Environmental Science International, 27(6): 411-423. https://doi.org/10.5322/JESI.2018.27.5.281
[29] Román, J.P., Achab, M. (1999). Grain-size trends associated with sediment transport patterns in Cadiz Bay (southwest Iberian Peninsula). Boletin-Instituto Espanol De Oceanografia, 15(1/4): 269-282. https://api.core.ac.uk/oai/oai:repositorio.ieo.es:10508/1284.