Basim M. Al-Zaidi*![]() | Jamal S. Makki
| Jamal S. Makki![]() | Alaa Alsharaballi
| Alaa Alsharaballi![]()
© 2024 The authors. This article is published by IIETA and is licensed under the CC BY 4.0 license (http://creativecommons.org/licenses/by/4.0/).
OPEN ACCESS
This paper employed a hydraulic model to investigate the transient flow and its hydrodynamic effects in a failed water supply pumping pipeline system during a sudden and unplanned power outage. The model was developed and then properly calibrated to make the system more efficient in locating and determining the change in pressure and discharge throughout the length of the pipeline. The simulation of the transient process was utilized using the method of characteristics. The model was conducted on a practical problem in a hydraulic system of pipelines and pumping station of a water supply- pumping station, which is possessed by Nasiriyah Water Supply Project No.1 The Giant Nasiriyah Water Project (GNWP), Thi-Qar, Iraq, where the power outage is the most common and unsolved problem. The project transmits water for more than 77 km to supply more than 800 thousand inhabitants in the dry areas in southern Iraq with drinking water. The pressure variation and flowrate change at different points for the system with the different timings shutting down were analyzed. The study results showed that the sudden shutdown of the pump generates fluid transients with high-pressure variations and flowrate in different locations and times. The characteristics of pumping under the transient conditions showed high fluctuations during the movement between the pump shut-off point and mass flow points, and the magnitudes of the fluctuations decreased with the fading of the impact of the water hammer. The results also indicated that the studied system is experiencing high-pressure pulsations in the discharge of the pumping system in addition to negative pressures, and consequently threatening problems of collapses and severe cavitations are expected along the pipeline in the system. This study may help to prevent the pipeline pumping system from hazards due to transient pressure fluctuations using the most principal recommendations for engineering solutions.
pump failure, hydraulic transients, pumping pipeline, power outage
Transient flow is the father of water hammering (Hydraulic shock) and a significant issue in the pumping pipeline systems. It drastically deteriorates the pipelines of the pumping system, causing great damage to the hydraulic in addition to loss of life and power generation facilities and thus needs to be identified in a proper approach. The mechanism of designing and performing any piping system always requires an analysis of transient conditions as well as an analysis of the steady-state operating conditions [1]. Thus, they are essential issues to determine the total force acting within the pipeline, and this force comes from summing the pressures of the steady case and transient case (i.e., the unsteady condition) [2-5]. The transient flow is more important when a rapid change in flowrate occurs due to flow control systems such as instantaneous valve closure or pump stoppages [4]. The changes in flowrate and velocity resulted in a pressure wave in the pipeline system [2]. This pressure wave is the best description of the water hammer phenomenon or hydraulic shock [6]. Therefore, the water hammer is the pressure surge that is generated due to a sudden stop in flow or abrupt change its direction and then the operational conditions of the system [3, 7]. The water hammer effect has been a rising problem in pumping pipeline systems since the 1930s [8], and thus it is a significant issue that should be well studied in the designing of pumping pipeline systems [1, 9]. The fluid transient is characterized as an unsteady flow in a pipeline that results in a change in the flowrate regime [10]. The most common sources of the water hummer in the pumping pipeline systems are pump shutdown due to power failure, actions of opening or closing the valve either fully or partially, and the automatic operation of control instruments; these factors create a high-pressure wave in the pipeline systems, e.g., in the domestic water supply systems [11, 12].
The pump is an essential part of the hydraulic engineering system [13]. Power outage to the electric facilities of the pumping unit from the source of energy is the most common problem in emerging countries such as Iraq where power shutdown arises occasionally and consequently to the pump due to unplanned sudden power outages. The water hammer analysis is complex due to the high loss by friction as a comparison to the sudden changes in pressure by abrupt decreases in the flow velocity [14]. The pressure transients through the power failure of the pump are considered in pipeline design which could cause pipeline rupture due to entrapping air, and then convert the pressure in the pipeline away from the allowed value of working pressure [15, 16].
Water hammer by power failure of the pump has been observed by researchers for many years, and numerous studies have been conducted for studying the transient flow in this aspect. Worldwide there are several transient flow models have been proposed in the designing, analyzing, and providing safe operation approach of the pumping pipeline systems [11, 17-25]. Lu et al. [26] studied the transient flow of the pump after power failure. They presented a numerical study involving of power-off transient of a centrifugal pump and aimed to control the speed of the pump during power-off the pump using a system of torque balance equations. The study stated that the internal flow of a centrifugal pump drastically changed during the transition process of power failure. The study concluded that the process of power failure resulted in a massive change in the direction of speed and flow rate and the flow regime inside the pump became very complicated. Stokes et al. [27] studied the pressure wave in a pipeline due instantaneous shutdown of the pump in the system. The study investigated the movement of the pressure surge of negative value along the system from the pump and the pipeline end. The study assumed a sudden drop to zero value in flow velocity at the pump led to getting the minimum pressure at the pump, and then along the system. Burrows [28] presented a real case study that reported a failure system of pumping pipelines. The study stated that the system suffered from cracks due to several factors, one of these factors was the wave of pressure that was generated due to the shutdown of the pump. The study concluded that the pump shutdown led to generating air space at points of high elevation which enhanced the pressure transients.
Another cause of generating the water hammer is the sudden valve closure in the pipeline system. Kwon and Lee [29] presented data from a transient flow model simulated by the sudden closure of a valve. The study provided a comparison between three models which are the characteristics, the symmetrical, and the implicit scheme with good agreement. Boye and Samuel [10] presented a conceptual design study utilizing a numerical method using the application of a transient solver of a pipeline system with a 52 km length of crude oil and explored different common events of transient flow, e.g., sudden valve closure and instantaneous pump shutdown. The study suggested that a valve closure time of 15 seconds during the pumping of the crude oil with no load added was efficient for the system and an effective pressure relief device and the use of pressure relief valves in the system reduces the hydraulic pressure by about 80%. The study also stated that the impact of transient flow due to suddenly stopped pumps of 5 sec time efficiency caused cavitation and wave pressure propagation and inconsequence serious pipe problems could occur such as deflection and rupture of pipe during this flow condition.
In the analysis of the transient flow in pumping pipeline systems due to power failure, many researchers have attempted to simulate transient flow in pipeline systems with different methods. Feng et al. [30] presented a simulation study applying software to transient flow resulting from power failure, the study used a developed function that iteratively solves the equation of momentum for determining the angular velocity of the pump during the failure. The study stated that the parameters of the used centrifugal pump highly change with time during the process of the power failure, also there a dramatic fluctuation in pressure followed by periodic changes in the pressure generating high-pressure surges in the flow and oscillation in the pumping system. The transient flow has four modes after the power failure which are pump, turbine, braking, and runaway mode. The study showed that the flow became more complex due to the change in flow direction. The results indicated that the change in pressure extended for about 0.2 sec occurred after getting the peak value of the reverse rotational speed. The study results showed that the predicted characteristic curves of the pump by the numerical model were in good agreement with the data. Larsen and Burrows [31] presented a numerical model to study the impact of air columns at the points of high elevation in the pipeline due to pump shutdown by computing the pressure wave and comparing them with field data collected from three different pumping stations of the sewer pipeline. The study found that air pockets can lead to excessive pressure and then collapse the pipeline. Also, the study showed that the air spaces led to mitigating the pressure crossing in the system and thus must be accounted for in the numerical model.
Transient flow in water pipelines can be appropriately analyzed and predicted by use of the method of characteristics (MOC), which is one of the most accurate of Eulerian methods in the simulation of nonlinear equations, even though it requires multiple steps or estimations to simulate a particular problem in transient flow in pipes [2, 14]. The method of characteristics is widely used in modeling and solving the fluid transients in complex systems of pipelines with high feasibility in giving more information about the systems. Moreover, the MOC can also initially be developed to analyze transient flow conditions in oil pipes where equations of water hammer derived by this method are sufficiently applied to the water pipeline system [7]. It was shown that water pipeline transient may be calculated directly by these methods since experimental configurations were given by adequate comparison with field data [32]. Salmasi and Abraham [33] adapted the MOC to study the water hammer phenomenon with the variation of several variables using a numerical model. These variables are the roughness of the pipe material, head of the reservoir, pipe diameter, length of the pipe, and wave velocity. The results showed that these variables play a vital role in the pressure fluctuations. The study also stated that high fluctuations occur at the end of the pipeline and thus the ending section of the pipe is a critical zone for system design. Saikia and Sarma [34] provided a numerical model depending on the method of characteristics MOC for the simulation of the approach of the water hammer. The model estimated the results of the pressure head of a long pipeline for time closure the downstream with tank upstream. The accuracy of the model was examined by comparison with data obtained by other investigations [3]. The study examined three different methods with an example of application. The study concluded that the behavior of the system is not influenced by the nature of the pump and systems close to the source which are more important in designing the system than determent the surge pressures. Aljanabi et al. [35] presented a study about the impact of some factors such as pump shutdown, time closure of the valve, junction of line branch, pump shut-down, and line friction on pressure wave in the pipeline system. The study presented an unsteady model applying both the method of characteristics MOC and the friction factor of Barr's explicit for the solution of the transient flow of the water hammer. The study stated that both methods give accurate results accounting for the effect of friction in solving transient pressure and flow in a water pipe system.
In the context of eliminating the risk in the water pipelines during the pump failure, Pozos-Estrada et al. [36] presented a study that helped to prevent the expected accident that may occur in the pumping pipeline system caused by a pump shutdown in the water pumping system in Mexico resulting from a power failure. The case led to a burst of pipe of PCC type. The study provided a solution using the water hammer analysis to discover the air pocket impact on the pressure wave that generates the pipe rupture in the pumping pipeline system. Arefi et al. [37] presented a study about a large-scale water transmission pipeline of 31 km long, the model examined first steady conditions in the pipeline and then the transient generated by the pump shutdown. The study stated that the pressures of negative values cause problems in the pipeline such as cavitation and water column separation. The results denoted that using a piece of device such as air valves alone is not adequate to eliminate the risk in the water pipelines during the pump failure. The study stated that the best way to prevent the effect of the vacuum pressure and reduce the pipeline risk is by putting devices in the right places in the pipeline such as hydropneumatic tanks. The study concluded that in the case of the flow being stopped due to the pump failure the more suitable approach, as a comparison to the exit of air created in the system, is providing the flow with tanks.
Although several studies have been conducted on pumping pipeline systems during the transition process, the focus on pumping pipeline systems under the transient flow under power failure is relatively limited and requires further investigations. Moreover, building a hydraulic model with high flexibility in spatial and temporal prediction of flow properties along the system is one of the gaps this study aims to address. Iraq is home to the greatest rivers, i.e., the Tigris and Euphrates. Nevertheless, the quality of water in the southern region of the country is very low due to the intensive use of water for irrigation and increase the in soil salinity. Thus, it is necessary to pump and transport the potable water for long distances using pipelines and pumping stations. Nasiriyah Water Supply Project, which is locally known as the Giant Nasiriyah Water Project (GNWP), was constructed in 2003, is one of these projects that used to supply water for more than 77 km. Water transportation in these pipelines depends mainly on the pumping stations that use electric power in operation. The problem of unplanned outages of electric power in Iraq is an unsolved dilemma even though the high value of using the power to pump and transport water that Iraq's people use is dependent. Moreover, the pumping, transportation, and distribution of drinking water (i.e., potable water) are all utilized using a pumping pipeline system throughout the whole country. Thus, the power shortages are essential in production, transport, and energy infrastructure components in the country in particularly hot weather areas in the south of Iraq. The Nasiriyah Water Supply Project (GNWP) in Thi-Qar province is one of the largest water supply projects in the south region of Iraq. The project services more than 800,000 people in these areas who suffer from a scarcity of drinking water using a water treatment plant facility with a size of 10,000 m3/hr. The project now suffering from sudden and unplanned power outages. The arising problem in the transients analysis in water pipelines is efficiently managed on the computer by using the solution of the method using equations of water hammer. The objective also here is to analyze the transient pressure along the pipeline in a failed water supply pumping pipeline system generated by a simultaneous sudden power failure to the pumps due to the power outage. Moreover, determining and locating the change in pressure and discharge along the pipeline system using a proper numerical model and how affects the efficiency of the system and then suggesting the engineering solutions for a safe operations approach is one of the scopes of this study.
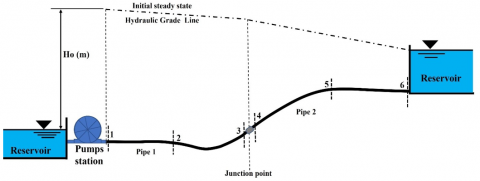
A numerical model of transient flow in a pumping pipeline system was proposed in this study. The model is about a hydraulic system consisting of an intake structure, a pump, and an outflow structure as shown in Figure 1. Two pipes in series are connected between the two reservoirs. The pumping station consists of two pumps that work as one pump. The presented model has several assumptions and simplifications as follows:
Figure 1. Schematic of the modeled pumping system
The model governing equations are the conservation of flow mass and momentum equation for 1D transient flow in elastic pipe [14, 27]:
Continuity equation:
$\frac{\partial H}{\partial t}+\frac{a^2}{g A} \frac{\partial Q}{\partial x}=0$ (1)
The momentum equation:
$\frac{\partial Q}{\partial t}+g A \frac{\partial H}{\partial x}+f \frac{Q|Q|}{2 D A}=0$ (2)
where, H is pressure head, A denotes the cross-sectional area of the pipe, g is the acceleration of gravity, t is time, a is wave celerity, Q is the flowrate, x is streamwise distance, f is friction factor, and D is the diameter of the pipe.
The wave speed a propagation for the transient flow condition in the pipe is computed from the following formula:
$a=\sqrt{\frac{\frac{k}{\rho}}{1+\left(\frac{k}{E}\right)\left(\frac{D}{e}\right)}}$ (3)
where, K denotes the bulk modulus of fluid elasticity, $\rho$ is the fluid density, E denotes the Young Modulus of elasticity of the pipe, and e is the pipe wall thickness.
The equations of continuity and momentum (Eqs. (1) and (2)) were simultaneously solved in a discretized form with the aid of the computer using transient flow software. The derivation of the transient equations and method of characteristics (MOC) are presented in Streeter and Wylie [2] and Chaudhry [14] standard text classic textbooks provided the method of characteristics as the numerical method to solve equations on a computer. The method of characteristics is the most accurate and widely used in analyzing the fluid transient because of its ability to simulate complex systems with more stability [2, 33]. The numerical model based on the MOC presented by Chaudhry [14] was demonstrated to be effective and highly accurate results to be efficiently applied in the design of pumping pipelines accounting for pump failure. In this study, the model provided by the previous study [14] is used in the simulation. The method of characteristics is a numerical solution of unsteady flow equations in pipelines where the two partial differential equations are converted into ordinary differential equations finding a moving coordinate system and then solved by the finite difference method to calculate the values of discharge and head with time at each internal node in the grid. The advantage of using MOC is that all the variation of head and discharge moves at the same rate of wave celerity. The two compatibility equations can be applied to any intersection point (Q, H) in the interior grid in the pipeline. The pressure head at the pump at section (1, i) is computed as [14]:
$H_{P_{i, 1}}=H_{s u c}+H_P-\Delta H_{P_v}$ (4)
where, Hsuc is the water surface height in the tank, Hp pumping head at the end of the time increment, and ΔHpv is the head loss in the flow valve at the end of the time step. The head loss at the valve is determined by Chaudhry [14]. In the reverse flow in the transient condition, an absolute value of discharge is used:
$\Delta H_{P_v}=C_v Q_{P_{i, 1}}^2=C_v Q_{P_{i, 1}}\left|Q_{P_{i, 1}}\right|$ (5)
Cv is the coefficient of valve head loss.
The deaccelerating pump torque is represented by the form:
$\alpha_P-C_6 \beta_P=\alpha+C_6 \beta$ (6)
where, α and αP are the rated speed of the pump and the rated speed at the end of the time increment respectively, the term of rated means the value at the point of max efficiency of the pump characteristics curve, β is the torque and βp is the torque at the end of the time increment, and C6 is constant.
The pipe discharge at section (i, 1) is determined using the equation of characteristics (-ve) as follows [14]:
$Q_{P_{i,1}}=C_n+C_a H_{P_{i,1}}$ (7)
where, Cn and Ca are constants.
To develop the boundary conditions for the pump which are necessary to assess the pump characteristics indicated by differential equations that describe the change in velocity of the pump with time after power shutdown. These equations are simultaneously solved in the model. The axis of the pipe is considered a datum for hydraulic levels. The solution of the transient flow along the pipe starts with steady-state conditions (time = 0), where known initial values of Q and H are at commutation nodes. The flow at the pump at the end of the time increment is computed by the equation of continuity with no flow change between the section (i, 1) and the reservoir as follows [14]:
$Q_{P_{i, 1}}=Q_P$ (8)
where, Qp indicates the pump flowrate at the end of the time interval.
The boundary conditions are the head at the reservoir, the discharge at the dead downstream end, and the head discharge relationship, series junction, and downstream reservoir, which are represented by Eqs. (4)-(8). Moreover, the pump characteristic curve (H-Q) curve was used as a boundary condition for the pumping system. In the current study, the model code was written using MATLAB version R.2018 to solve the governing system of equations numerically using the Newton-Raphson method with spatial and temporal are 0.5 m and 0.25 sec respectively based on the method of characteristics, and this one of the features that give the proposed model the ability to capture the variations in the system, i.e., high numerical resolution in space intervals and time scale. The model also offers animations and graphs for displaying the results. The model then applied is to study and analyze the transient flow condition in the pumping pipeline system after the validation phase.
The validation phase of the model was implemented using the available data of a pumping pipeline system similar in design to that modeled in this study. A very simple simulation of hydraulic transient with the different scenarios is carried out to validate the model. The system contains an upstream water source and two pumps are operating at rated conditions, two pipes in series have a reservoir downstream (see Figure 1). The system is divided into several nodal points distributed along the pipeline. Figure 1 also presents the computational field for an assumed pipeline system consisting of a reservoir, two pipes connected by a junction, and a reservoir at the downstream end. The data used in model validation are presented by previous studies that were selected as a benchmark [14, 23]. These data which represent the properties of the modeled system are shown in Table 1.
Table 1. Input parameters to the model during validation
|
Symbol |
Description |
Value(s) |
Unit |
|
Np |
Number of pumps |
2 |
- |
|
ηp |
Pump efficiency |
84 |
% |
|
L1 |
Length of the pipe 1 |
550 |
m |
|
L2 |
Length of the pipe 2 |
450 |
m |
|
D1 |
Diameter of pipe 1 |
0.75 |
m |
|
D2 |
Diameter of pipe 2 |
0.6 |
m |
|
a1 |
Wave celerity in pipe 1 |
900 |
m/s |
|
a2 |
Wave celerity in pipe 2 |
1100 |
m/s |
|
f1 |
Friction coefficient of pipe 1 |
0.01 |
- |
|
f2 |
Friction coefficient of pipe 2 |
0.012 |
- |
|
QR |
Rated discharge |
0.25 |
m3/s |
|
HR |
Rated pump head |
60 |
m |
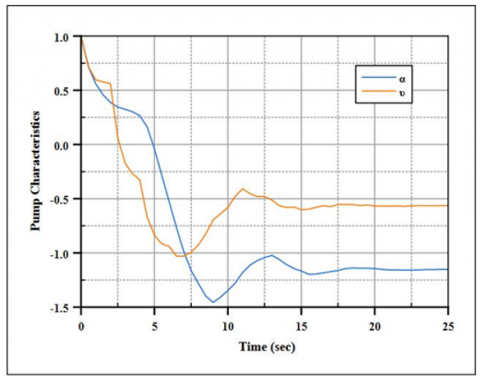
The objective here is to analyze two different kinds of transients which are transient conditions and power failure. The transient conditions result from a power shutdown in both pumps that occurred at the same time. These analyses are simulated by transition conditions followed by pump failure for a required time (e.g., 25 sec). Figure 2 shows the computed parameters at nodal points at the pump (first node on L1), end of pipe one L1 (L1_(N+1)), first node on pipe two L2 (L2_(1)), and the end of pipe two L2 (L2_(N+1)) versus computational time, i.e., 25 sec, where L refers to the pipe length. The entrance loss coefficient is 0.2. The value of the pump rated speed is 1100 rpm, the rated moment of inertia WR2 for each pump is equal to 16.85 Kg m2, and the section head of the pump is designed to be 60 m. The specific weight of water is 9810 N/m3. In this validation run, 0.25 sec was used as a size of time step. The parameters of the pump parameters highly fluctuated with time during the failure of the power.
It is important to determine the change in the head of the pump and flowrate during 15 sec after the pump failure. Thus, the results showed that the value of variable α becomes negative at 5 sec from the pump failure while the other variable v becomes negative earlier at 3 sec.
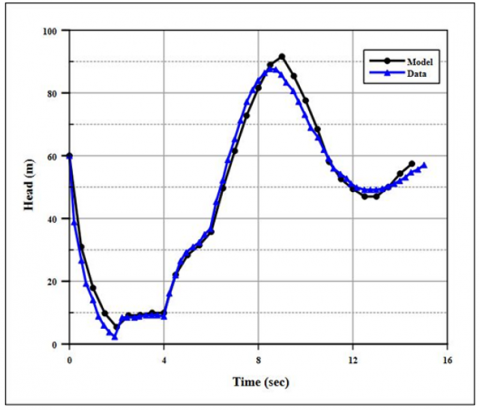
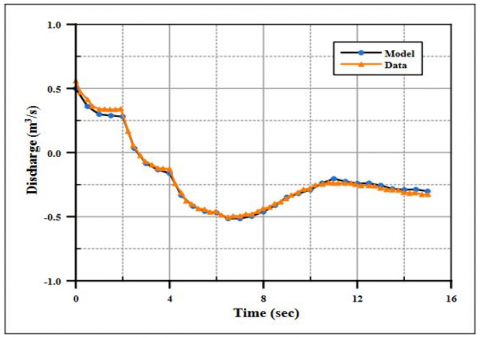
The results of the model of the pressure change along the pipeline and the available data from a previous study as a benchmark [23] are compared as shown in Figure 3. The black line with a circle represents the results of the model and the blue line with a triangular represents the available data. The model gives good agreement with the field data.
Figure 2. Pump characteristic parameters during a power failure, the computed parameters at the pump (first node on L1), end of L1 (L1_(N+1)), first node on L2 (L2_(1)), and the end of L2 (L2_(N+1)) versus computational time
Figure 3. Comparison between model results and data for 15 sec, the black line is the model results and the blue line is the data
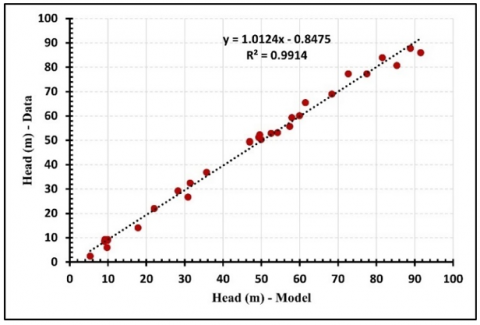
To enhance the credibility of the results during model validation, the proposed model was run for different times of simulation and compared with the field data. Figure 4 shows the results of the comparison between model results and data for the pressure head including statistical measures of fit (the black dot line). The comparison indicated that the model coincided with the provided data in high agreement.
Figure 5 shows the discharge variation along the pipeline for the values of the model results versus the data as a comparison [23]. The black line with the circle is the model results and the red line with triangles is the available data. The model was in good agreement with the available data.
Figure 4. Model results versus data of pressure head for different simulation times
Figure 5. Comparison between the model results of the discharge and data for 15 sec, the black line is the model results and the red line is the data
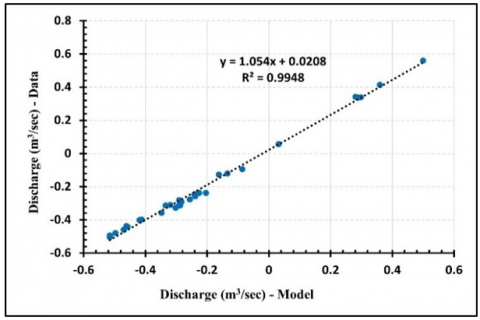
Figure 6. Model results versus data of the discharge for different simulation times
Figure 6 presents the results of the comparison between the model and data for the discharge and for different times of simulation including statistical measures (the black dot line) for quantifying agreement during the model validation. A good fit was obtained between the results of the model and the data.
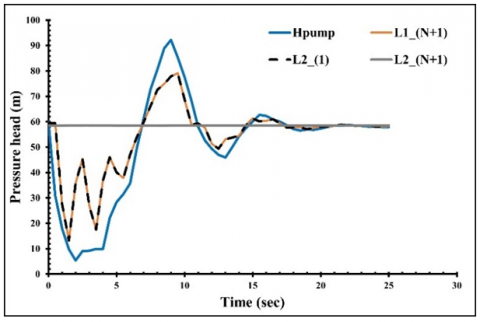
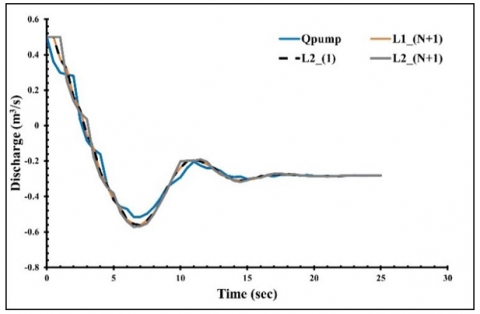
The model can provide the change in head and flowrate at any node for the pump shutdown. Figure 7 presents the model results of the pressure head along the system, and the drop of the head after 6.5 sec. Figure 8 shows the results of the discharge along the pumping system, the discharge at the last node is negative after 3.5 sec while it was negative after 3 sec for the rest of the nodes. The value of the discharge becomes constant at the end of the time. The period of the pump failure may be divided into three clear substages, the first stage extends from the pump shutdown into the value of discharge becomes equal to zero at 2.65 sec because at the running the pump loses the power supply suddenly but the impellers still perform and slow down gradually due to the inertia. In the second stage, the pressure at the pump drops gradually due to the power outage then the head of the pump becomes lower than the static head in the pipe and water flows backward thus making the pressure in the pipe escalate and becomes unstable and appears water hummer effect. As a consequence, the pump speed reduces and slows down and the flowrate changes rapidly. In the third stage, the rotating of the pump continues to stop, but the backwater reverses the rotation of the blades of the pump.
Figure 7. Computed pressure head at pump (first node on L1), end of L1 (L1_(N+1)), first node on L2 (L2_(1)) and on end of L2 (L2_(N+1)) versus computational time of 25 sec
Figure 8. Computed discharge at pump (first node on L1), end of L1 (L1_(N+1)), first node on L2 (L2_(1)) and on end of L2 (L2_(N+1)) versus computational time of 25 sec
The model results give a high agreement with the simulations presented with the data provided by the selected benchmark studies. After the validation, then the model is applied to the water-pumping pipeline system of the GNWP.
4.1 Field data
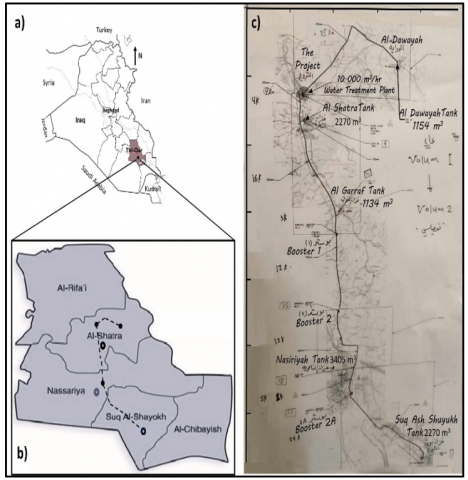
The provided data in this study is based on the technical data of a pumping pipeline system for municipal uses, in Nasiriyah City, Iraq. The model was run to explore the values of pressure and flowrate at several locations in the water pumping pipeline system of the GNWP, Nasiriyah City, Iraq. The system transmits water with specific gravity (S.G) ≈ 1.0 using a water treatment plant with a size of 10,000 m3/hr. The water pumping pipeline of GNWP in Thi-Qar is located in the southeast of Iraq (see Figure 9). Figure 9 shows also the layout of the system of pumping pipeline system. The project starts from Shatra city, north of Nasiriyah city, and it pumps towards the south and ends at Suq Ash Shuyukh city. Also, the project has a branch moving toward the northeast of Al Dawayah city for a length of 25 km. The pumping station was set based on the convenient facilities, the demanded flowrate, and the required head. The project has also four boosters along the line to protect the system from the water hammer. The pump station is situated close to the tanks as shown in the layout. In each station, two pumps have been installed in parallel to give the required flowrate and head in the pipeline. The water then pumps from these tanks on the bottom corner on the right into the main pipeline to another station with tanks. There are four tanks along the pipeline. The proposed studied pipeline has two segments each segment 513 m long with a pipeline of the same diameter. Because of the flat area, the slope of the pipeline is mild and there are no points of high elevations (i.e., no changes in slope of the pipe).
Figure 9. (a) The location of the Nasiriyah Water Supply Project in Iraq, (b) The map of Thi Qar city, and c) The layout of the project
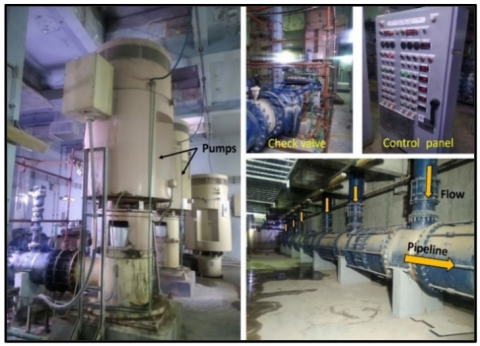
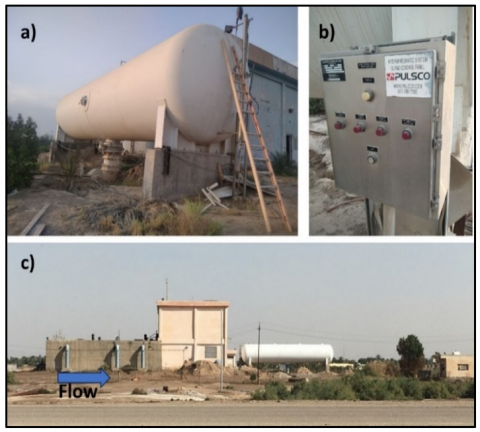
Figures 10 and 11 show the system equipment tank and pumps and surge tanks, it is important to mention here there is no high change in elevation along the pipeline since the flat land where the pipe crosses. Because in the pipeline, particularly at uphill points, there is either negative pressure (vacuum pressure) at these points in the case of the breaking separation of water columns or positive pressure, high pressure in the case of rejoint. Thus, there are two kinds of pressure negative pressure and high pressure. The outside pressure is atmospheric pressure and this will may cause a collapse of the pipeline.
Figure 10. The pump station, pipeline, and control panel at the main pumping station
Figure 11. (a) Surge tanks at the main pump station, (b) Control panel, and (c) Pump station and surge tank at Garraf station
Table 2 presents the field data used in the model. The data was provided by the GNWP office during the time of preparing this study.
The type of pump is a centrifugal pump, this kind of pump is more affected by water hummer [34]. The design discharge of the pumps ranges from 250-750 m3/hr. The thickness of the pipe wall is about 1.7 cm, and the types of used pipes are wrought iron and cast iron. The friction factors of these kinds of pipes range between 0.01 and 0.012 [38].
Table 2. Input data to the model
|
Symbol |
Description |
Value(s) |
Unit |
|
Np |
Number of pumps |
2 |
- |
|
ηp |
Pump efficiency |
93 |
% |
|
L1 |
Length of the pipe 1 |
513 |
m |
|
L2 |
Length of the pipe 2 |
513 |
m |
|
D1 |
Diameter of pipe 1 |
1200 |
mm |
|
D2 |
Diameter of pipe 2 |
1000 |
mm |
|
a1 |
Wave celerity in pipe 1 |
900 |
m/s |
|
a2 |
Wave celerity in pipe 2 |
1100 |
m/s |
|
f1 |
Friction coefficient of pipe 1 |
0.01 |
-- |
|
f2 |
Friction coefficient of pipe 2 |
0.012 |
-- |
|
QR |
Rated discharge |
332 |
m3/hr |
|
HR |
Rated pump head |
475 |
m |
4.2 Model results
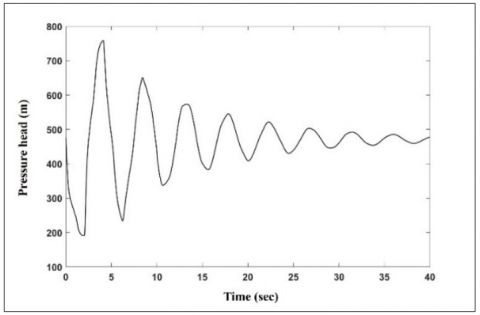
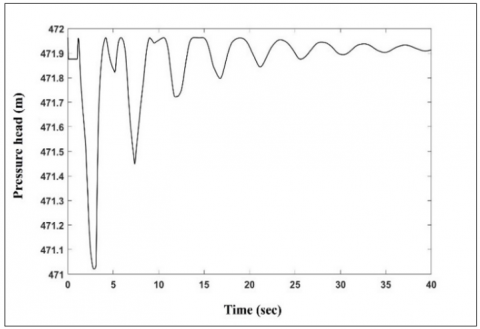
In this study, the authors considered the pressure pulse in the pipeline caused by an unexpected and sudden pump outage in the pipeline system. The objective here is to analyze the hydraulic system under transient operation conditions. The model was developed and then properly calibrated to make the system more efficient in locating and determining the change in pressure and discharge throughout the length of the pipeline. Figure 12 shows pressure variation at the pump at a computational time of 40 sec, i.e., during 40 sec transient time after pump shutdown. The results showed that the variation in pressure head was rapid at the first 10 sec then the change decreased gradually till the end of the computed time.
Figure 12. Pressure variation at the pump at a computational time of 40 sec
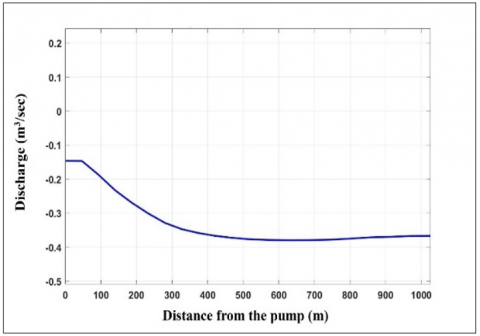
Figure 13. Discharge variation at the pump computational time of 40 sec
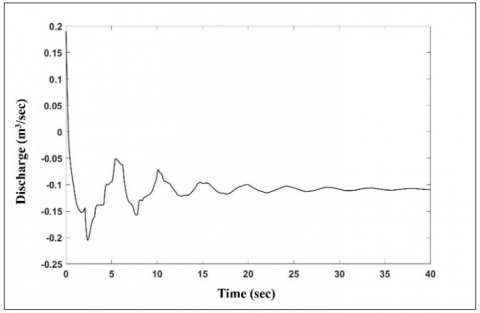
Based on the energy equation, any alteration in flow velocity yields a change in pressure, and inconsequence cases water hammer. Figure 13 presents the discharge variation at the pump computational time of 40 sec after the pump failure. The change in the flowrate is stepping at the beginning of the computed time, then the change becomes nonuniform till 10 sec after the pump shutdown. Then the change in the flow rate becomes low and uniform till the end of the computed time.
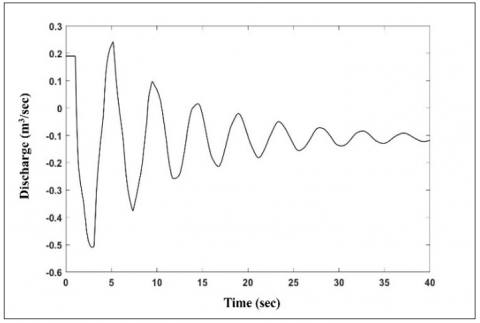
Figure 14. Pressure variation at the downstream end for the computation time of 40 sec
Figure 15. Discharge variation at the downstream end for the computation time of 40 sec
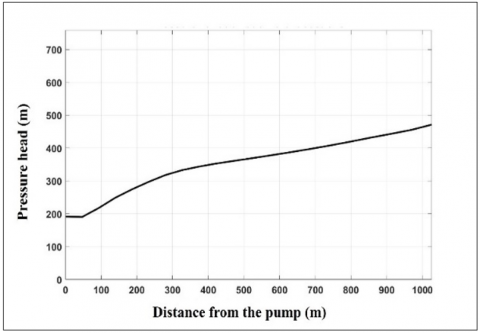
Figure 16. Min pressure variation at different sections along the pipeline at time 1.865 sec
Figure 17. Min discharge variation at different sections along the pipeline at time 1.865 sec
Figures 14 and 15 present the change in pressure and discharge at the downstream end of the system. The results showed that a rapid drop in the pressure head at the beginning of the time with a min value happened at this short time, then the head variation around the initial value with slight change till the end of the period. The changes generate high pulsations of pressure in the discharge of the pumping system. Therefore, for the discharge, the change in the discharge was rapid at the beginning of the time then the variation changed slowly at the end of time. The results showed that the pressure and flowrate were proportionally large at the beginning of the time after the pump shutdown. It is clear from the results that the downstream end of the system is more affected by the transient resulting from the power failure. Thus, this part of the system should be more protected against pressure variations. The study results are in agreement with the results that were revealed in the literature review [30, 36, 37].
It is important to explore the lowest values of the pressure and flowrate along the pipeline during the system failure. This low value resulted in the minimum head for the pipeline. Figure 16 shows the min value of the pressure head along the system. The variation of the curve starts with a constant value, and it increases in a steep slope, and then it becomes mild until the downstream end. Figure 17 shows the minimum values of the flowrate along the system. The flowrate decreases steeply at the beginning of the time then the slope of the change becomes low till the end of the time. The results revealed that the model sufficiently predicted the values of the minimum head at the pump.
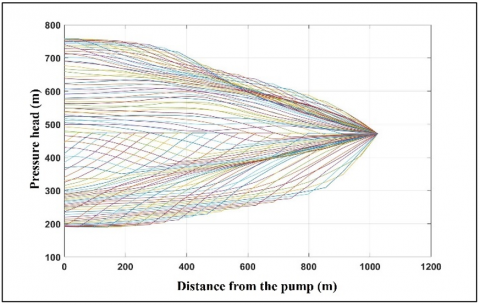
Figure 18. Variation of the head along the pipeline at the pump shut-down with a time of 5 sec of selected time
Figure 19. Variation of the head along the pipeline at the pump shut-down with a time of 40 sec
Figure 20. Variation of the head along the pipeline at the pump shut-down of computation time of 5 sec
Figure 21. Variation of the discharge along the pipeline at the pump shut-down with time 5 sec of selected time
Figure 22. Variation of the discharge along the pipeline at the pump shut down for the time of 40 sec
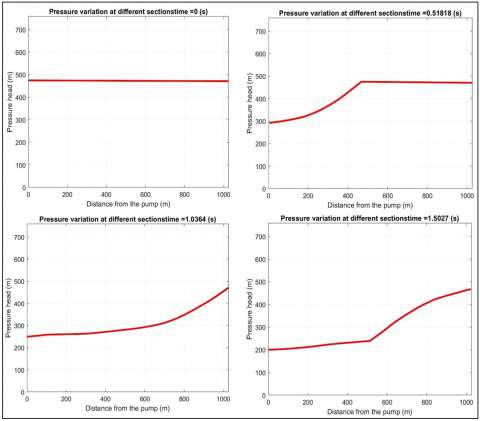
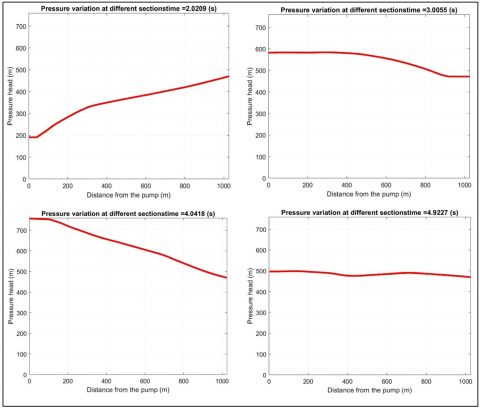
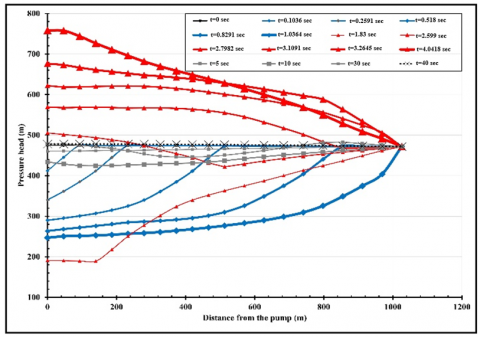
To show the pressure variation and discharge change with the time along the pumping pipeline system, the model was run for a short time of computation is 5 sec. Figure 18 shows the variation of the head along the pipeline at the pump shut-down for a computation time of 5 sec and for selected times of 0, 0.5, 1, 1.5, 2, 3, 4, and 5 sec. Figures 19 and 20 indicate the variation of heads and flowrates at pump shutdown with changeable time intervals at each node along the pipeline. The results demonstrated that there is a dramatic modification in head and flowrate, based on time and position. A decrease in the flow of the pipelines happened downstream. Also, the results showed that head discharge downstream of the pump is highly affected by the transient flow. The pressure wave travels along the pipeline and creates a high load for the system. The situation becomes worse in the case of a water hammer since cavitation (bubble flow) happens several times and causes a significant impact on subsequent fluid transients in the system and inconsequence collapse of the pipeline may occur.
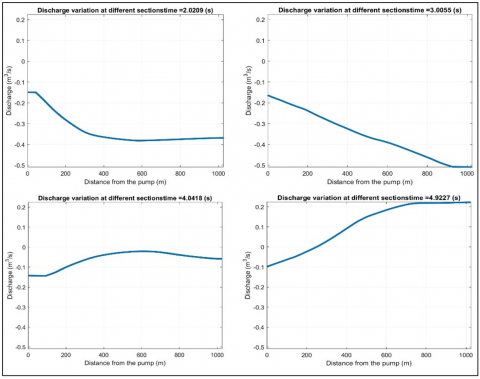
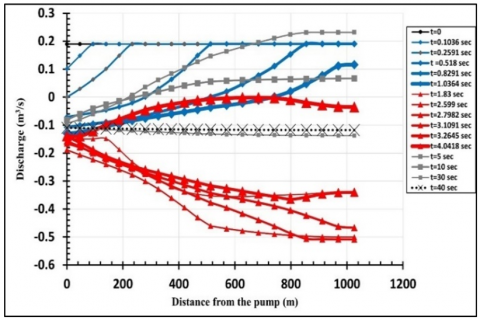
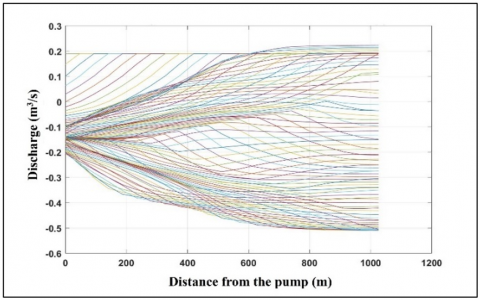
Figure 21 shows the discharge distribution along the pipeline at the pump shut-down for a computation time of 5 sec and for selected times of 0, 0.5, 1, 1.5, 2, 3, 4, and 5 sec. Figures 22 and 23 indicate the variation of heads and flowrates at pump shutdown for variable time intervals at all nodes along the pipeline. The results show that there is a dramatic variation in pressure and flowrate, based on location and time. Also, the results showed that the head discharge downstream of the pump is more impacted by the transient flow. The computed results of the model are very similar and coincident to those obtained in the previous investigations [30, 33, 37], this proves the accuracy and reliability of the proposed model.
Figure 23. Variation of the discharge along the pipeline at the pump shut down for a time of 5 sec
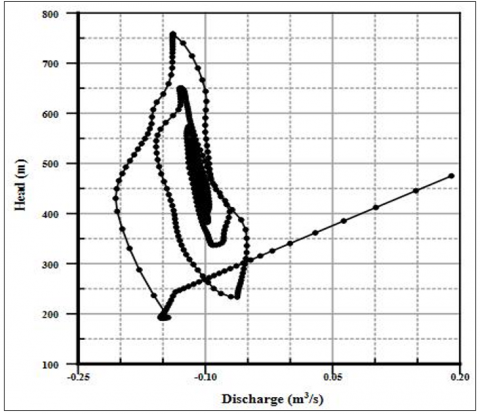
Figure 24. Q-H curve of the pump under the transient conditions
It is important to mention here the pump characteristics are usually provided at normal flow conditions. However, during the transient flow conditions, the pump operates abnormally. Thus, it is essential to provide the pump characteristics during the transient flow. The pumping characteristics represented by the H-Q curve are obtained as shown in Figure 24 to relate the flowrate of the pump to the required head under the transient conditions. As shown in the results, because of the inertia, the pump is running after the power failure and it will take some time depending on the inertia and the pump. Thus, the pump still rotates after the power outage, and the discharge decreases to reach zero value and the head also decreases, and then the reverse flow starts and increases the head again. The H-Q curve finally spins around the shutoff point of the pump with oscillation and the rotating radius decreases when the impact of the water hammer is mitigated, and then the fluctuations move to the mass flow points. The maximum value of the head, i.e., the surge pressure, is about 760 m and the minimum value reaches 195 m these values are rounded between discharges (-0.15 and -0.1) m3/s.
The study results are in agreement with previous studies in the aspect of the pumping characteristics under transient conditions [37, 39].
It is noteworthy that one of the practical implications of these issues is when the pump fails, the system cannot maintain the pressure head within the desired limits, thus putting a valve fitting close to the pump can reduce the effects of the reverse flow after the pump failure. Engineering solutions such as adequate surge protection, and a check valve can help to prevent the water hammer impact during the pump failure. Moreover, one of the practical implications results from the identified issues, is that the sudden change in pressure leads to a drop in the system efficiency and results in a hydraulic failure. Thus, providing the system with multi-valve protection may protect the system from hammering. Moreover, the pressure control devices (e.g., surge tanks) can partially protect the pipeline from pressure surges. Thus, a surge protection system is important to alleviate pressure waves at a transient state because of the high positive and negative pressures created while all pumps tripped simultaneously.
A hydraulic model of a fluid transient was developed and validated at a field scale to study the impacts of hydraulic shock (water hammer) on the water-pumping pipeline system caused by the sudden loss of power of the pump. The provided model consists of a pumping pipeline system that can investigate the impact of transient events on the characteristics of the hydraulic system. The model uses the method of characteristics in analyzing fluid transients. The model gave good agreement with the available data from various benchmark studies during the validation face. The model then was applied to study the hydraulic transients in a failed water supply pumping pipeline system due to a power outage in the Giant Nasiriyah Water Project (GNWP), Nasiriyah City, Iraq, where pump failure due to power outage is the most common and unsolved problem in this emerging country. The investigation was effectively accomplished for a long time to establish the pressure variation with time. To get further investigation of the simulation, the model simulation was provided two times during the period of the pump outage which are 5 sec, and 40 sec. The pressure variation and flowrate vibration at various points with the different times of shutting down were analyzed for the system. The study results showed that the sudden shutdown of the pump generates fluid transient events that involve large pressure variations and flowrate with high values occurring during the first 15 sec of the time. The results indicated that the impact of the new regime of the transient flow during pump outage within 5 sec was significant on the system, which caused to extension of the pressure pulse along the system. The abrupt power failure causes water hammering due to the changes in velocity and pressure head, and this is simulated as a pressure wave and transient flow occurring along the system. The results showed decreasing flowrate and sudden changes in pressure head along the pipeline and with time. The variation of heads and flowrates at pump shutdown for variable time intervals (0.5 sec-increment) at all nodes along the pipeline showed that there is a dramatic variation in pressure and flowrate, based on location and time. Also, the results showed that the head discharge downstream of the pump is more impacted by the transient flow, i.e., the transient events are more severe close to the pump station. The pumping characteristics, i.e., (H-Q) curve, under the transient conditions, showed high fluctuations during the movement between the pump shut-off point and mass flow points. The maximum value of the head reached 760 m and the minimum value was 195 m, these values were rounded between reversed discharges (- 0.15 and - 0.1) m3/s. The magnitudes of the fluctuations decreased when the impact of the water hammer faded with time. The results of the present study are quite accurate and remarkably similar with some negligible differences to those investigated by benchmark studies. In conclusion, understanding of context of the water hammer during accidental flow change can help reduce the amount of damage to pressurized systems, thus this study may help to design and manage water supply systems that can withstand the transient pressure in the case of pump failure. In the long-distance pipeline, a system of multi-valve protection may be provided to protect the system from hammering. The pressure control devices (e.g., surge tanks) can partially protect the pipeline from pressure surges. To prevent generating a negative pressure, it is essential to install equipment such as hydropneumatics tanks or proper water feeding tanks in the right places at the high points along the pipeline, and then reduce the pipeline risk. The results proposed in this paper can be referenced and applied to the engineering design of a similar pumping pipeline system, e.g., oil pumping pipeline systems, where the crude oil is pumped and transported for long distances in Iraq using pumping stations.
[1] Dutta, N., Palanisamy, K., Subramaniam, U., Padmanaban, S., Holm-Nielsen, J.B., Blaabjerg, F., Almakhles, D.J. (2020). Identification of water hammering for centrifugal pump drive systems. Applied Sciences, 10(8): 2683. https://doi.org/10.3390/app10082683
[2] Streeter, V.L., Wylie, E.B. (1967). Hydraulic Transients. McGraw-Hill, New York.
[3] Streeter, V.L. (1969). Water hammer analysis. Journal of the Hydraulics Division, 95(6). https://doi.org/10.1061/JYCEAJ.0002199
[4] Boulos, P.F., Karney, B.W., Wood, D.J., Lingireddy, S. (2005). Hydraulic transient guidelines for protecting water distribution systems. Journal-American Water Works Association, 97(5): 111-124. https://doi.org/10.1002/j.1551-8833.2005.tb10892.x
[5] Al-Zaidi, B.M., Makki, J.S., Al-Umar, M.H., Ismaeel, A.J. (2023). Modeling the impact of pipeline topography on the performance of pumping system. Mathematical Modelling of Engineering Problems, 10(1): 250-258. https://doi.org/10.18280/mmep.100129
[6] Vardy, A.E. (2023). On sources of damping in water-hammer. Water, 15(3): 385. https://doi.org/10.3390/w15030385
[7] Wylie, E.B., Streeter, V.L. (1993). Fluid Transients in the System. Prentice-Hall, Inc. Englewood Cliffs, NJ, pp. 436. https://doi.org/10.1017/S0022112094210716
[8] Bergant, A., Simpson, A.R., Tijsseling, A.S. (2006). Water hammer with column separation: A historical review. Journal of Fluids and Structures, 22(2): 135-171. https://doi.org/10.1016/j.jfluidstructs.2005.08.008
[9] Parmakian J. (1963). Water Hammer Analysis. Dover Publications Inc., New York.
[10] Boye, T.E., Samuel, O.D. (2020). Computer-based method of design and modeling of transient flow in crude oil pipeline system. Journal of Engineering Research, 8(3): 219-239. https://doi.org/10.36909/jer.v8i3.6651
[11] Han, Y., Shi, W., Xu, H., Wang, J., Zhou, L. (2022). Effects of closing times and laws on water hammer in a ball valve pipeline. Water, 14(9): 1497. https://doi.org/10.3390/w14091497
[12] Al-Zaidi, B.M., Ismaeel, A.J. (2022). Effect of hydraulic characteristics on fluid transients analysis under different types of control valves. Journal of Ecological Engineering, 23(12): 111-123. https://doi.org/10.12911/22998993/154731
[13] Volk, M. (2013). Pump Characteristics and Applications (3rd ed.). CRC Press, Boca Raton. https://doi.org/10.1201/b15559
[14] Chaudhry, M.H. (2014). Applied Hydraulic Transient. Springer New York, NY, pp. 31-42. https://doi.org/10.1007/978-1-4614-8538-4
[15] Tasca, E., Besharat, M., Ramos, H.M., Luvizotto Jr, E., Karney, B. (2023). Exploring the sensitivity of the transient response following power failure to air valve and pipeline characteristics. Water, 15(19): 3476. https://doi.org/10.3390/w15193476
[16] Lupa, S.I., Gagnon, M., Muntean, S., Abdul-Nour, G. (2022). The impact of water hammer on hydraulic power units. Energies, 15(4): 1526. https://doi.org/10.3390/en15041526
[17] Ali, N.A., Abozeud, G., Darweesh, M.S. (2013). Studying of water hammer in water supply pipes network with different abnormal operation conditions (case study-Assiut city network). Journal of Engineering Sciences, 41(6): 2036-2054. https://doi.org/10.21608/jesaun.2013.114945
[18] Kodura, A. (2016). An analysis of the impact of valve closure time on the course of water hammer. Archives of Hydro-Engineering and Environmental Mechanics, 63(1): 35-45. https://doi.org/10.1515/heem-2016-0003
[19] Martin, A., Delgado-Aguiñaga, J.A., Puig, V. (2022). Control of transients in drinking water networks. Control Engineering Practice, 119: 104986. https://doi.org/10.1016/j.conengprac.2021.104986
[20] Nerella, R., Rathnam, E.V. (2015). Fluid transients and wave propagation in pressurized conduits due to valve closure. Procedia Engineering, 127: 1158-1164. https://doi.org/10.1016/j.proeng.2015.11.454
[21] Pires, L.F.G., Ladeia, R.C., Barreto, C. (2004). Transient flow analysis of fast valve closure in short pipelines. In Proceedings of the 2004 International Pipeline Conference, Calgary, Alberta, Canada, pp. 1997-2003. https://doi.org/10.1115/IPC2004-0347
[22] Ramos, H., Beta⁁ mio de Almeida, A. (2002). Parametric analysis of water-hammer effects in small hydro schemes. Journal of Hydraulic Engineering, 128(7): 689-696. https://doi.org/10.1061/(ASCE)0733-9429(2002)128:7(689)
[23] Rohani, M., Afshar, M.H. (2010). Simulation of transient flow caused by pump failure: Point-implicit method of characteristics. Annals of Nuclear Energy, 37(12): 1742-1750. https://doi.org/10.1016/j.anucene.2010.07.004
[24] Uyanık, M.C., Bozkuş, Z. (2024). Introducing a newly developed computer software to analyze fluid transients in pressurized pipeline systems. Arabian Journal for Science and Engineering, 49: 13769-13785. https://doi.org/10.1007/s13369-023-08702-y
[25] Carmona-Paredes, R.B., Pozos-Estrada, O., Carmona-Paredes, L.G., Sánchez-Huerta, A., Rodal-Canales, E.A., Carmona-Paredes, G.J. (2019). Protecting a pumping pipeline system from low-pressure transients by using air pockets: A case study. Water, 11(9): 1786. https://doi.org/10.3390/w11091786
[26] Lu, L., Ren, Z., Wang, Z., Zhou, W., Li, S., Dai, J., Yang, C., Dang, M. (2024). A study on the transient characteristics of the power-off transition process of a double-volute centrifugal pump. Water, 16(12): 1707. https://doi.org/10.3390/w16121707
[27] Stokes, Y.M., Miller, A., Hocking, G. (2016). Pressure drop in pipelines due to pump trip event. Anziam Journal, 57: M163-M204. https://doi.org/10.21914/anziamj.v57i0.10277
[28] Burrows, R. (2003). A cautionary note on the operation of pumping mains without appropriate surge control and the potentially detrimental impact of small air pockets. In Proc., Pumps, Electromechanical Devices and Systems (PEDS) Applied to Urban Water Management 2003, pp. 22-25.
[29] Kwon, H.J., Lee, J.J. (2008). Computer and experimental models of transient flow in a pipe involving backflow preventers. Journal of Hydraulic Engineering, 134(4): 426-434. https://doi.org/10.1061/(ASCE)0733-9429(2008)134:4(426)
[30] Feng, J., Ge, Z., Zhang, Y., Zhu, G., Wu, G., Lu, J., Luo, X. (2021). Numerical investigation on characteristics of transient process in centrifugal pumps during power failure. Renewable Energy, 170: 267-276. https://doi.org/10.1016/j.renene.2021.01.104
[31] Larsen, T., Burrows, R. (1992). Measurements and computations of transients in pumped sewer plastic mains. Pipeline Systems, 7: 117-123. https://doi.org/10.1007/978-94-017-2677-1_10
[32] Starikov, D.P., Rybakov, E.A., Gromakov, E.I. (2015). The pipeline oil pumping engineering based on the plant wide control technology. IOP Conference Series: Materials Science and Engineering, 81(1): 012111. https://doi.org/10.1088/1757-899X/81/1/012111
[33] Salmasi, F., Abraham, J. (2021). The method of characteristics applied to the sensitivity analysis for water hammer problems. New Approaches in Engineering Research, 9: 50-63. https://doi.org/10.9734/bpi/naer/v9/11010D
[34] Saikia, M.D., Sarma, A.K. (2006). Numerical modeling of water hammer with variable friction factor. Journal of Engineering and Applied Sciences, 1(4): 35-40.
[35] Aljanabi, S.H. (2010). Numerical modeling of transient flow in long oil pipeline system. Engineering & Technology, 28(16): 5346-5357. https://doi.org/10.30684/etj.28.16.17
[36] Pozos-Estrada, O., Sánchez-Huerta, A., Breña-Naranjo, J.A., Pedrozo-Acuña, A. (2016). Failure analysis of a water supply pumping pipeline system. Water, 8(9): 395. https://doi.org/10.3390/w8090395
[37] Arefi, M.H., Ghaeini-Hessaroeyeh, M., Memarzadeh, R. (2021). Numerical modeling of water hammer in long water transmission pipeline. Applied Water Science, 11(8): 1-10. https://doi.org/10.1007/s13201-021-01471-9
[38] Street, R.L., Watters, G.Z., Vennard, J.K. (1996). Elementary of Fluid Mechanics, 7th edition. John Wiley & Sons, Inc.
[39] Yang, S., Wu, D., Wu, P., Wang, L. (2016). Investigation of the transient characteristics of the pump system using the MOC-CFD coupled method. In 16th International Symposium on Transport Phenomena and Dynamics of Rotating Machinery, Honolulu, US. https://hal.archives-ouvertes.fr/hal-01887483.