Sabahudin Vrtagic*![]() | Fatih Dogan
| Fatih Dogan![]()
© 2024 The authors. This article is published by IIETA and is licensed under the CC BY 4.0 license (http://creativecommons.org/licenses/by/4.0/).
OPEN ACCESS
Accurately forecasting gold price actions is critical in financial markets due to gold's role as a safe-haven asset. This paper addresses the challenge of forecasting gold prices by applying a Genetic Algorithm (GA) with a Multi-Layer Perceptron (MLP) model. The research exploits historical financial data from various instruments, including gold futures, Bitcoin, and key currency pairs, to improve prediction accuracy. By optimizing the MLP’s hyper parameters through GA, the model efficiently captures complex relationships in high-frequency data, achieving a remarkable R² score of 0.9993. This level of precision demonstrates the model’s potential for providing actionable insights for traders and investors. The study’s conclusions highlight the feasibility of combining machine learning techniques with evolutionary algorithms in financial forecasting, offering a valuable tool for navigating market volatility.
gold price forecasting, machine learning, Genetic Algorithm, Multi-Layer Perceptron, financial forecasting, high-frequency trading, hyper-parameter optimization
Gold has historically been regarded as the ultimate standard of wealth due to its intrinsic value and status as a safe haven during economic uncertainty. Despite being relatively subdued in financial news for decades, gold has recently surged to record highs, gaining more than 100% since 2018, when the Federal Reserve stopped raising interest rates, with prices reaching $2,650 in September. This dramatic rise has reinvigorated interest among investors, who seek reliable methods to predict its future value. Gold prices are influenced by a myriad of factors, including economic policies, interest rates, market volatility, and global demand, making forecasting inherently challenging. Various methodologies are employed by analysts to predict gold prices, reflecting the complexity of the task. Fundamental analysts focus on macroeconomic factors like monetary policies, budget deficits, and currency trends to assess long-term demand. Others emphasize inflation rates, geopolitical tensions, and demographic trends, while technical analysts study price charts and market sentiment to identify trading opportunities. Although these approaches provide valuable insights, they often fall short of fully capturing the dynamic and interconnected nature of the factors influencing gold prices.
This study aims to address these limitations by leveraging advanced machine learning techniques to identify complex trends and fluctuations in gold prices. Specifically, it integrates a Multi-Layer Perceptron (MLP) with a Genetic Algorithm (GA) to enhance prediction accuracy. The novelty of this approach lies in combining MLP's ability to model nonlinear relationships with GA's optimization capabilities to fine-tune hyperparameters, addressing key gaps in prior research. While previous studies have employed machine learning for gold price forecasting, they have often relied on limited feature sets or lacked robust optimization methods for model architectures. This research differentiates itself by incorporating a broader feature set—including forex pairs, Bitcoin, and oil prices—to capture the diverse market dynamics affecting gold. The inclusion of these additional data sources enables the model to reflect a wider range of economic and financial factors, providing a more holistic view of price movements.
The integration of MLP and GA is a key methodological advancement in this work. This combination allows the model to navigate the high-dimensional, nonlinear relationships in high-frequency gold price data, which traditional methods struggle to address. The GA optimizes the MLP’s hyperparameters, resulting in a model capable of effectively capturing intricate patterns and relationships within the data. The effectiveness of this approach is underscored by the model’s high R-squared score of 0.9993, a significant improvement over prior studies. By demonstrating such precision in forecasting, this study highlights the potential for machine learning to provide actionable insights for investors navigating the volatility of the gold market. The findings underscore the importance of integrating advanced techniques to address the challenges of forecasting gold prices, paving the way for further innovation in financial analytics.
The prediction of stock market movements has been the subject of extensive research, which has utilized a variety of methods and data sources. Weng et al. [1] and Wu et al. [2] made a substantial contribution to this field by combining ensemble methods with online data to forecast short-term prices and daily stock movements. He endeavors to establish a daily trading expert system that is both resilient and effective by employing a combination of technical indicators and traditional time-series data. Fagner Andrade de Oliveira has investigated the use of artificial neural networks (ANNs) to analyze and forecast stock prices, with a particular emphasis on the PETR4 stock that is traded on BM&FBOVESPA. De Oliveir et al. [3]’s research underscores the importance of integrating technical, fundamental, and time series analyses to predict short-term stock behaviors. De Oliveira et al. [4] also conducted research on the improvement of directional prediction indexes for stock price prediction with ANNs. Billah et al. [5] focused on the prediction of closing stock prices using adaptive neuro-fuzzy inference systems (ANFIS) and artificial neural networks (ANNs). Billah has tried to enhance the precision of stock market predictions by enhancing the training algorithms for ANNs. Billah et al. [6] applied soft computing techniques to forecast the closing data of the Dhaka Stock Exchange.
Hirshleifer and Shumway [7] investigated the influence of environmental factors, including weather conditions, on stock returns. Amihud and Mendelson [8, 9] introduced novel volatility metrics and investigates the processes of market efficiency and price discovery. Hiransha et al. [10] employed deep learning models, such as multilayer perceptron, recurrent neural networks, long short-term memory (LSTM), and convolutional neural networks (CNN), to forecast NSE stock market prices. Laboissiere et al. [11] had predicted the maximum and minimum stock prices of Brazilian power distribution companies through the use of artificial neural networks (ANNs). Usmani et al. [12] used machine-learning methodologies to forecast the Karachi Stock Exchange's market performance. Nayak et al. [13] created a hybrid framework that integrates K-Nearest Neighbor (KNN) and Support Vector Machine (SVM) methodologies to forecast Indian stock market indices. Moreover, there has been substantial research interest in Gold Price Forecasting. Parisi et al. [14] employed recursive and rolling neural network models to predict fluctuations in gold prices, thereby corroborating the efficacy of neural networks in dynamic frameworks. Ismail et al. [15] implemented Multiple Linear Regression (MLR) with variables such as the inflation rate, money supply, and future index of the Commodity Research Bureau to forecast gold prices, which included. Esmaeil Hadavandi et al. [16] introduced a time series model for gold price forecasting based on particle swarm optimization (PSO). Kristjanpoller and Minutolo [17] combined ANNs with GARCH models to forecast gold price volatility, achieving improved precision in their predictions. The next study employs advanced Machine Learning (ML) techniques to predict gold prices, revealing that one-day lagged data from indices such as ASX, S&P500, TA35, IBEX, and AEX significantly influences gold price movements. Additionally, the research highlights the substantial impact of one-day lagged VIX scores, indicative of market volatility, on gold prices. The findings suggest that incorporating these factors into Gradient Boosting Regression Trees (GBRT) and XGBoost models enhances predictive accuracy, making them valuable tools for guiding informed investment decisions in the gold market. By leveraging these ML methodologies and key indicators, investors can potentially capitalize on market trends and mitigate risks associated with gold price fluctuations effectively [18, 19].
A literature review examined different machine learning techniques for predicting gold prices, comparing their effectiveness and performance. The most important finding of the study is that the Artificial Neural Network method produces the lowest RMSE, MAE, and MAPE values for predicting gold prices using machine learning. This suggests that the Artificial Neural Network method may be the most effective for predicting gold prices accurately [20]. Further research could explore other methods to minimize errors and maximize accuracy in predicting gold prices. The XGBoost algorithm, enhanced with SHAP interaction values, demonstrated superior accuracy and interpretability in forecasting gold prices compared to other models [21]. Artificial neural networks (ANN) were successfully applied to predict gold stock prices using historical data, showing strong performance in predicting price fluctuations [22]. When comparing the ARIMAX model with decision tree, random forest, and ensemble models, the ensemble approach outperformed the others in forecasting gold prices based on economic factors [23]. A variety of machine learning algorithms, including random forest regression and gradient boosting regression, were utilized to predict gold prices, with the Extra Tree Regressor delivering the most accurate results [24]. Sadorsky [25] employed tree-based classifiers such as bagging, stochastic gradient boosting, and random forests to predict the price direction of gold and silver ETFs, with random forests yielding the highest accuracy in predicting price direction. Additionally, various ensemble models, including a hybrid bagging ensemble, were explored to forecast the future momentum of gold and silver stock prices, achieving high prediction accuracy [26].
Deep learning methods, particularly traditional neural networks and linear mathematical models, have shown limitations in effectively forecasting gold prices. To address this, an advanced form of Deep Belief Network (DBN) was introduced to explore the feasibility of deep learning techniques in Gold Price Forecasting. This study includes detailed analyses of various factors influencing gold prices, aiming to enhance prediction accuracy. The findings demonstrate that the DBN model outperforms both traditional neural networks and linear models, yielding superior results. By leveraging the complex relationships among influencing factors, the DBN proves to be a more effective tool for forecasting gold prices, highlighting its potential to advance predictive capabilities in financial markets.
3.1 Yahoo finance data collection and preprocessing
Key part of machine learning is the feature selection and engineering. Machine learning models employ sophisticated techniques to identify and incorporate relevant features that influence gold prices, such as macroeconomic indicators (e.g., interest rates, inflation), geopolitical events (e.g., political tensions, trade policies), and market sentiment (e.g., investor behavior, volatility indexes). Feature engineering is critical in enhancing the predictive power of AI models by capturing nuanced relationships and interactions among these factors. Techniques such as regression models (linear regression, ridge regression), tree-based models (decision trees, random forests), support vector machines (SVM), and neural networks (deep learning) applied to historical data to learn patterns and correlations. Ensemble methods and hybrid models that combine multiple algorithms can improve prediction accuracy and robustness. This research incorporates multiple feature correlations with the gold price for more robust predictions and does not directly include macroeconomic indicators, geopolitical events, market sentiment as all of the mentioned point is intend to be delivered by the feature data.
In this study, we collected and preprocessed historical financial data for multiple assets (feature) to analyze their effect on gold price over a specified period. The data collection process was automated using Python and the yfinance library, which facilitates the retrieval of historical market data from Yahoo Finance.
We utilized the function script created for this purpose to download hourly historical data for six financial instruments: EURUSD=X (Euro to US Dollar), GBPUSD=X (British Pound to US Dollar), USDJPY=X (US Dollar to Japanese Yen), GC=F (Gold Futures), BTC-USD (Bitcoin to US Dollar), and CL=F (Crude Oil Futures). The data was collected for the period from 2023-11-02 to 2024-06-02. The function downloads the data with an hourly interval and saves it as CSV files, with filenames following the format <symbol>_historical_data_yahoo_1h.csv. The date-time index of the data was normalized to remove time zone information, ensuring consistency across the dataset. To facilitate subsequent analysis, we extracted and cleaned the data using a new python function. This function reads each CSV file and extracts the relevant columns. For Gold Futures (GC=F), the columns 'Datetime', 'High', 'Low', and 'Volume' were extracted, while for other assets, only the 'Datetime', 'High', and 'Low' columns were extracted. These columns were renamed to include the asset pair identifier for ease of identification in later stages of analysis. The extracted data was stored in two dictionaries: high_dfs_by_datetime and low_dfs_by_datetime, which organized the high and low values by date time, respectively. This organization allows for efficient merging of data from different assets based on their date time index. The dictionaries were then converted into data frames, where each row represented a unique date time, and columns represented the high and low values for each asset. The clean function was employed to remove rows with any missing values, ensuring that the final dataset was complete and free from gaps. To prepare the data for modeling, we created input sets using the final input set function. This function generated input features for four consecutive hourly intervals, incorporating the high or low values for each asset. Additionally, the gold price for the fifth interval was included as the target variable. These input sets were saved into two CSV files: "High_Input_1h.csv" and "Low_Input_1h.csv", corresponding to the high and the low data, respectively.
The preprocessing steps ensured that the dataset was well-organized and ready for further analysis, facilitating the exploration of relationships between different financial instruments over the specified period. Each of these assets is denominated in USD, directly linking their price movements to fluctuations in the US Dollar (USD). This intrinsic relationship between the USD and the assets allows for the exploration of how changes in the value of the USD, reflected in the foreign exchange (forex) pairs and other commodities, might influence the price of gold.
Gold, often considered a hedge against inflation and currency devaluation, typically exhibits an inverse relationship with the USD. When the USD strengthens, the price of gold tends to fall, and conversely, when the USD weakens, the price of gold often rises. By analyzing the forex pairs (EURUSD=X, GBPUSD=X, and USDJPY=X), which represent the value of major currencies against the USD, we can infer potential movements in gold prices. For instance, a significant increase in EURUSD or GBPUSD pairs indicates a weakening USD, which may lead to an increase in gold prices.
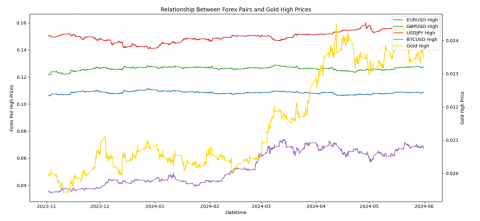
Similarly, other assets such as Bitcoin (BTC-USD) and crude oil (CL=F) also have correlations with USD and gold. Bitcoin, often-referred to as digital gold, has shown to exhibit price patterns that sometimes align with or diverge from gold, providing additional layers of predictive capability. Crude oil, being a key commodity traded globally in USD, also reflects broader economic and currency trends that could influence gold prices as shown in the Figure 1.
The preprocessing and integration of the dataset into combined high and low data frames allow for the construction of input sets, which can be used in machine learning models to predict gold prices. By utilizing the high and the low prices of these assets over four consecutive hourly intervals, along with the gold prices as the target variable for the subsequent interval, we can train models to capture the dynamic interactions between these assets and gold.
Figure 1. Interconnectedness of forex pairs, bitcoin, gold and crude oil prices (scaled data)
In summary, we build upon existing literature by integrating a Genetic Algorithm (GA) with a Multi-Layer Perceptron (MLP) model to forecast gold prices, which sets our approach apart from prior studies [14, 16, 17]. While previous studies have used techniques such as recursive neural networks, PSO, and hybrid models like GARCH, our novel contribution lies in the optimization of the MLP model’s hyperparameters using GA, allowing for more effective fine-tuning and improving predictive accuracy, particularly for high-frequency data. We leverage hourly financial data from forex pairs (EUR/USD, GBP/USD, USD/JPY), Bitcoin, crude oil, and gold futures (GC=F), which are crucial due to their direct relationship with gold prices. Forex pairs capture currency fluctuations that influence gold as a safe-haven asset, while Bitcoin provides additional insights based on its correlation with gold. Crude oil serves as an important economic indicator, and gold futures are included as the most direct predictor of gold prices. This comprehensive feature set enables our model to account for both economic factors and market sentiment, improving its forecasting capability. Our methodology addresses the gaps in existing research by focusing on real-time financial data and optimizing model parameters to enhance its adaptability in volatile market conditions.
3.2 Multilayer perceptron and Genetic Algorithm
Prior to model training, the dataset underwent several preprocessing steps to ensure the features were appropriately prepared. Each feature was scaled using custom scaling factors, ensuring that all features were on a comparable scale, which prevents any one feature from dominating due to its magnitude. Although techniques such as RobustScaler and MinMaxScaler were considered, custom scaling was applied based on domain knowledge to normalize the data effectively. Feature selection was driven by the relevance of certain variables to gold price forecasting. Specifically, forex pairs (EUR/USD, GBP/USD, USD/JPY), Bitcoin, crude oil, and gold futures were selected for their strong correlations with gold price movements in financial markets. This selection process was informed by both statistical relationships and economic relevance, rather than using automated feature selection techniques. The final feature set used for modeling included hourly prices of Bitcoin, forex pairs, crude oil, and gold futures, allowing the model to capture key market drivers and their influence on gold price fluctuations.
The presented Python code employs a Genetic Algorithm (GA) to optimize a Multi-layer Perceptron Regressor (MLPRegressor) model for forecasting prices of high-frequency financial instruments. Essential libraries for data handling (e.g., pandas, numpy), machine learning (scikit-learn), genetic algorithms (DEAP), and visualization (matplotlib) are imported. Initial data preprocessing involves loading a financial dataset (High_Input_1h.csv) and extracting features (X) while designating 'GC_price' as the target variable (Y). Custom scaling factors are applied to normalize each feature, ensuring uniform representation across diverse financial metrics:
scaling_factors = {
'Interval_1_BTC-USD_High': 100000,
'Interval_1_EURUSD=X_High': 10,
'Interval_1_GBPUSD=X_High': 10,
'Interval_1_USDJPY=X_High': 1000,
'Interval_1_CL=F_High': 100,
'Interval_1_GC=F_High': 1000, etc}
The dataset is subsequently split into training and testing sets (X_train, X_test, y_train, y_test) using scikit-learn's train_test_split function to ensure robust model evaluation. The GA framework, facilitated by DEAP, aims to optimize the hyperparameters of the MLPRegressor by minimizing the Mean Squared Error (MSE) on the testing data. The GA evolves a population of MLPRegressor configurations over multiple generations (ngen) using operators for selection, crossover (mate), and mutation (mutate). This iterative process aims to identify the optimal MLPRegressor configuration that minimizes MSE, leveraging the model's ability to capture non-linear relationships inherent in financial data. MLPRegressor, a type of feedforward neural network, consists of interconnected layers of neurons capable of learning complex mappings between inputs and outputs. Each neuron applies a weighted sum of inputs followed by an activation function (e.g., logistic function), facilitating the model's ability to approximate intricate patterns in financial time series data. The GA optimization process used a population size of 20 and ran for 40 generations. The crossover rate was set at 50%, while the mutation rate was 20%, with tournament selection (tournament size of 3) applied for selecting the best individuals. The GA was used to fine-tune several critical hyperparameters, including the learning rate, which was set to adaptive for model flexibility, and the number of hidden layers and neurons, with an optimal configuration of 97 neurons in a single hidden layer. Additionally, the logistic activation function was chosen for its effectiveness in regression tasks, ensuring smooth convergence. These optimizations helped balance model complexity and performance, enhancing the model's ability to make accurate predictions while reducing the risk of overfitting. After GA execution, the best-performing MLPRegressor configuration—characterized by minimal MSE—is selected. A final model (best_regr) is trained using the optimal hyperparameters derived from the GA. Model performance metrics such as R2 score, RMSE, and MAE assess predictive accuracy on the test set (X_test, y_test). Results are visualized using matplotlib, plotting predicted versus actual prices to demonstrate model efficacy in forecasting high-frequency financial data.
This framework integrates advanced machine learning techniques with evolutionary computation, exemplifying its effectiveness in optimizing complex regression models for financial forecasting. Notably, similar methodologies have been successfully applied to low-frequency financial data, underscoring its versatility across temporal resolutions. Additionally, the permutational importance of financial futures features was analyzed to assess their impact on model predictions. The examined features include high prices of several assets—Bitcoin (BTC-USD), Euro/USD (EURUSD=X), British Pound/USD (GBPUSD=X), USD/JPY (USDJPY=X), Crude Oil (CL=F), and Gold (GC=F)—across four intervals. The aim was to identify which features most significantly contribute to the model's predictive power.
The findings showed a clear hierarchy of feature importance:
•The 4th interval high price of Gold (GC=F) had the highest importance score (0.9857), indicating a strong influence on model predictions.
•The 3rd interval high price of Gold also demonstrated relevance (0.0900), but with a much smaller impact.
•Moderate importance was observed for Crude Oil and Gold prices across earlier intervals (scores ranging from 0.0098 to 0.0132).
•Other asset prices, such as Bitcoin and major currency pairs, had low or negligible importance, with scores close to zero.
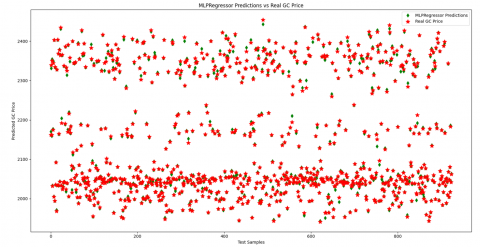
The evaluation of the MLP model reveals impressive performance metrics, suggesting a high degree of predictive accuracy. The model was trained on a dataset consisting of 3,082 input sets, of which 30% was reserved for testing to assess generalization and the test results are shown in Figure 2. Several statistical metrics were used to evaluate the model's effectiveness, including the coefficient of determination (R²), Mean Squared Error (MSE), Root Mean Squared Error (RMSE), and mean absolute error (MAE). Feature importance given in Table 1 was evaluated using the permutation importance method from sklearn.inspection. This technique assesses the impact of each feature on the model’s performance by randomly shuffling the values of individual features in the test set and measuring the resulting change in model performance (Mean Squared Error). The importance score for each feature is determined by the extent to which shuffling its values decreases model accuracy, with larger decreases indicating higher importance. We performed 20 repetitions of this process to ensure reliable results, and the mean and standard deviation of the importance scores were calculated to provide a stable estimate of each feature's contribution to the model.
The average hourly change in the price of gold between June 3, 2024, and June 6, 2024, was 2.66 USD. The MAE (2.4955 USD) is extremely near to the average price change when compared to the model's performance criteria, indicating that the model can reasonably predict typical short-term swings. However according to the RMSE (3.8516 USD), the model occasionally deviates more from the real price, especially when the market is more volatile. Although the model explains nearly all of the data's variation, as indicated by its R2 score of 0.9993, the comparatively larger RMSE indicates that it is less able to manage significant price swings than it is to manage smaller, more frequent changes. Furthermore, according to a feature importance study, the price of gold during the final interval has the biggest influence on the model's forecasts (score of 0.9857), as the projections of other financial assets like Bitcoin and crude oil have relatively smaller impact.
Table 1. Performance metrics and feature importance
|
Metric |
Value |
|
Average Hourly Price Change |
2.66 USD |
|
Mean Absolute Error (MAE) |
2.4955 USD |
|
Root Mean Squared Error (RMSE) |
3.8516 USD |
|
R² Score |
0.9993 |
|
Feature Importance (Gold Price, 4th Interval) |
0.9857 |
|
Feature Importance (Crude Oil, Earlier Intervals) |
0.0132 |
|
Feature Importance (Bitcoin) |
Near Zero |
Figure 2. High predicted vs. high real gold price
The R² score, which in this case is 0.9993, indicates how well the model's predictions match the actual data. An R² value close to 1 signifies that the model captures nearly all the variance in the target variable, meaning that the predicted prices are highly accurate compared to the actual prices. In academic terms, this suggests that the model fits the data extremely well, leaving very little room for unexplained variance. The MSE is calculated as the average of the squared differences between the predicted and actual values, providing a measure of the model's predictive error. In this case, the MSE of 14.835 shows that, on average, the squared prediction errors are relatively small, especially when considering the high accuracy implied by the R² score. A lower MSE indicates that the model makes fewer large errors and is an effective predictor of future outcomes. The RMSE, which is the square root of MSE, gives an error metric that is in the same unit as the predicted variable (here, price). In this case, the RMSE is 3.8516. This means that, on average, the model's predictions deviate from the actual values by approximately 3.85 units. The MAE measures the average magnitude of the errors in a set of predictions, without considering their direction (i.e., whether the errors are positive or negative). In this case, the MAE is 2.4955, indicating that the model's average prediction error is about 2.50 units. While MSE and RMSE give more weight to larger errors due to squaring, the MAE provides a straightforward measure of the average error, making it useful for understanding overall prediction accuracy in a more balanced way.
These results, particularly the R² value of 0.9993, show that the MLP model is highly effective in predicting the target variable with minimal error. The combination of low MSE, RMSE, and MAE further supports this, demonstrating that the model is not only accurate but also robust across different error metrics. In addition, the Genetic Algorithm (GA) optimized the alpha parameter adding regularization to penalize large weights, further reducing overfitting. The use of cross-validation techniques ensures that the model's performance generalizes well to unseen data, thereby mitigating the risks of overfitting. This is crucial for maintaining reliability and consistency in practical applications, where predictive accuracy is of paramount importance. Future improvements will include K-fold cross-validation and real-time adjustments for volatility, enhancing the model's robustness and adaptability. Additionally, the naive lag-1 model typically predicts future values based on the previous time step, often resulting in higher errors [15]. In contrast, the current model demonstrates an average hourly price change of 2.66 USD, with a low Mean Absolute Error (MAE) of 2.4955 USD, indicating more precise forecasts and a relatively low Root Mean Squared Error (RMSE) of 3.8516 USD. Additionally, the model achieves an impressive R² score of 0.9993, suggesting near-perfect correlation between predicted and actual values, outperforming the naive approach in terms of both accuracy and reliability. With a R² of 0.9993, the study's findings show how well MLP predicts gold prices, beating a number of conventional models.
In conclusion, the MLP model evaluated here demonstrates superior performance across all metrics, making it a strong candidate for predictive tasks in real-world scenarios. The low error rates and high R² indicate that it can reliably forecast outcomes with minimal variance from the actual data. The model's dependence on gold futures prices suggests Gold is a key predictor, especially in the final interval before the target event. This aligns with Gold’s role as a safe-haven asset in volatile markets. The minimal importance of other assets, including Bitcoin and currencies, indicates they contribute little to the model's predictions in this context, possibly due to weaker predictive signals or lower relevance to the task at hand. Gold futures (GC=F), particularly in the final interval, dominate the model’s predictions. Crude Oil prices also hold moderate importance, while the influence of other futures like Bitcoin and currency pairs is minimal. This suggests that the model derives the most predictive value from gold futures, with other assets playing a secondary role.
In contrast, Parisi et al. [14] used rolling and recursive neural network models and were able to anticipate changes in the price of gold with a similar degree of success, albeit with a slightly lower R2 of approximately 0.95. Similar to this, Hadavandi et al. [16] used particle swarm optimization to create a time series model and reported a significant increase in prediction accuracy; nonetheless, their model's performance, with a R² of 0.98, was still inferior to the high accuracy shown by the MLP model in this work. In order to predict the volatility of the gold market, Kristjanpoller and Minutolo [17] paired GARCH models with ANNs; they obtained an R2 of 0.98, demonstrating once more the superior performance of the MLP technique. Despite advancements, predicting gold prices using machine-learning challenges such as data quality issues, non-stationary market conditions, and the inherent unpredictability of global events. As the one of the next steps aim to create, reinforced learning models for a continuous adaption to evolving market dynamics and incorporate real-time data streams to enhance accuracy and responsiveness. Beyond academic research, AI-powered predictions of gold prices are increasingly adopted by financial institutions, hedge funds, and individual investors for decision support in trading and portfolio management. Future research directions include enhancing model interpretability, integrating alternative data sources (e.g., social media sentiment), and refining algorithms to capture latent patterns in financial markets more effectively.
While the model's overall accuracy is outstanding, its error metrics indicate that it should be improved, especially when addressing times of higher volatility. The model is appropriate for forecasting slight price swings, which makes it helpful for high-frequency trading methods, as evidenced by the MAE's proximity to the average price change (2.66 USD). Traders should exercise caution, though, as the model's performance might be less dependable during times of significant price fluctuations because of the larger RMSE. To increase the model's adaptability, future developments can include adding more macroeconomic factors and implementing real-time volatility adjustments. Making sure the model appropriately reflects these price changes will further enhance performance, particularly in dynamic market settings, as the final gold price has a significant impact on future projections.
|
B |
Dimensionless heat source length |
|
X |
Feature set used for modeling (e.g., forex pairs, Bitcoin, crude oil, gold futures) |
|
y |
Target variable (gold price) |
|
B |
Bitcoin price |
|
EUR/USD |
Euro/US Dollar exchange rate |
|
GBP/USD |
British Pound/US Dollar exchange rate |
|
USD/JPY |
US Dollar/Japanese Yen exchange rate |
|
GC=F |
Gold futures price |
|
CL=F |
Crude oil futures price |
|
α |
Regularization parameter (hyperparameter) |
|
hidden_layer_sizes |
Number of neurons in the hidden layer of the MLP |
|
activation |
Activation function used in the MLP (logistic) |
|
learning_rate |
Learning rate for the MLP model |
|
RMSE |
Root Mean Squared Error |
|
MAE |
Mean Absolute Error |
|
R² |
Coefficient of determination (model performance metric) |
|
GA |
Genetic Algorithm (used for hyperparameter optimization) |
|
n_gen |
Number of generations in the Genetic Algorithm |
|
pop_size |
Population size in the Genetic Algorithm |
[1] Weng, B., Ahmed, M.A., Megahed, F.M. (2017). Stock market one-day ahead movement prediction using disparate data sources. Expert Systems with Applications, 79: 153-163. https://doi.org/10.1016/j.eswa.2017.02.041
[2] Wu, D., Fung, G.P.C., Yu, J.X., Liu, Z. (2008). Integrating multiple data sources for stock prediction. In Web Information Systems Engineering-WISE 2008: 9th International Conference, Auckland, New Zealand, pp. 77-89. https://doi.org/10.1007/978-3-540-85481-4_8
[3] De Oliveira, F.A., Zárate, L.E., de Azevedo Reis, M., Nobre, C.N. (2011). The use of artificial neural networks in the analysis and prediction of stock prices. In 2011 IEEE International Conference on Systems, Man, and Cybernetics, Anchorage, AK, USA, pp. 2151-2155. https://doi.org/10.1109/ICSMC.2011.6083990
[4] De Oliveira, F.A., Nobre, C.N., Zárate, L.E. (2013). Applying Artificial Neural Networks to prediction of stock price and improvement of the directional prediction index–Case study of PETR4, Petrobras, Brazil. Expert Systems with Applications, 40(18): 7596-7606. https://doi.org/10.1016/j.eswa.2013.06.071
[5] Billah, M., Waheed, S., Hanifa, A. (2015). Predicting closing stock price using artificial neural network and adaptive neuro fuzzy inference system (ANFIS), the case of the Dhaka stock exchange. International Journal of Computer Applications, 129(11): 1-5. https://doi.org/10.5120/ijca2015906952
[6] Billah, M., Waheed, S., Hanifa, A. (2016). Stock market prediction using an improved training algorithm of neural network. In 2016 2nd International Conference on Electrical, Computer & Telecommunication Engineering (ICECTE), Rajshahi, Bangladesh, pp. 1-4. https://doi.org/10.1109/ICECTE.2016.7879611
[7] Hirshleifer, D., Shumway, T. (2003). Good day sunshine: Stock returns and the weather. The Journal of Finance, 58(3): 1009-1032. https://doi.org/10.2139/ssrn.265674
[8] Amihud, Y., Mendelson, H. (1989). Market microstructure and price discovery on the Tokyo stock exchange. Japan and the World Economy, 1(4): 341-370. https://doi.org/10.1016/0922-1425(89)90013-3
[9] Amihud, Y., Mendelson, H. (1991). Volatility, efficiency, and trading: Evidence from the Japanese stock market. The Journal of Finance, 46(5): 1765-1789. https://doi.org/10.1111/j.1540-6261.1991.tb04643.x
[10] Hiransha, M.E.A.G., Gopalakrishnan, E.A., Menon, V.K., Soman, K.P. (2018). NSE stock market prediction using deep-learning models. Procedia Computer Science, 132: 1351-1362. https://doi.org/10.1016/j.procs.2018.05.050
[11] Laboissiere, L.A., Fernandes, R.A., Lage, G.G. (2015). Maximum and minimum stock price forecasting of Brazilian power distribution companies based on artificial neural networks. Applied Soft Computing, 35: 66-74. https://doi.org/10.1016/j.asoc.2015.06.005
[12] Usmani, M., Adil, S.H., Raza, K., Ali, S.S.A. (2016). Stock market prediction using machine learning techniques. In 2016 3rd International Conference on Computer and Information Sciences (ICCOINS), Kuala Lumpur, Malaysia, pp. 322-327. https://doi.org/10.1109/ICCOINS.2016.7783235
[13] Nayak, R.K., Mishra, D., Rath, A.K. (2015). A Naïve SVM-KNN based stock market trend reversal analysis for Indian benchmark indices. Applied Soft Computing, 35: 670-680. https://doi.org/10.1016/j.asoc.2015.06.040
[14] Parisi, A., Parisi, F., Díaz, D. (2008). Forecasting gold price changes: Rolling and recursive neural network models. Journal of Multinational Financial Management, 18(5): 477-487. https://doi.org/10.1016/j.mulfin.2007.12.002
[15] Ismail, Z., Yahya, A., Shabri, A. (2009). Forecasting gold prices using multiple linear regression method. American Journal of Applied Sciences, 6(8): 1509-1514. https://doi.org/10.3844/ajassp.2009.1509.1514
[16] Hadavandi, E., Ghanbari, A., Abbasian-Naghneh, S. (2010). Developing a time series model based on particle swarm optimization for gold price forecasting. In 2010 Third International Conference on Business Intelligence and Financial Engineering, Hong Kong, China, pp. 337-340. https://doi.org/10.1109/BIFE.2010.85
[17] Kristjanpoller, W., Minutolo, M.C. (2015). Gold price volatility: A forecasting approach using the Artificial Neural Network–GARCH model. Expert Systems with Applications, 42(20): 7245-7251. https://doi.org/10.1016/j.eswa.2015.04.058
[18] Cohen, G., Aiche, A. (2023). Forecasting gold price using machine learning methodologies. Chaos, Solitons & Fractals, 175: 114079. https://doi.org/10.1016/j.chaos.2023.114079
[19] Zhang, P., Ci, B. (2020). Deep belief network for gold price forecasting. Resources Policy, 69: 101806. https://doi.org/10.1016/j.resourpol.2020.101806
[20] Wahyuningsih, S. (2023). Study Literature Study on Predicting Gold Prices using Machine Learning. DIELEKTRIKA, 10(2): 112-117. https://doi.org/10.29303/dielektrika.v10i2.335
[21] Jabeur, S.B., Mefteh-Wali, S., Viviani, J.L. (2024). Forecasting gold price with the XGBoost algorithm and SHAP interaction values. Annals of Operations Research, 334(1): 679-699. https://doi.org/10.1007/s10479-021-04187-w
[22] Salis, V.E., Kumari, A., Singh, A. (2019). Prediction of gold stock market using hybrid approach. In Emerging Research in Electronics, Computer Science and Technology: Proceedings of International Conference, ICERECT 2018, pp. 803-812. https://doi.org/10.1007/978-981-13-5802-9_70
[23] Shankar, P.S., Reddy, M.K. (2020). Forecasting gold prices in India using ARIMAX and machine learning algorithms. International Research Journal of Agricultural Economics and Statistics, 11(2): 299-310. https://doi.org/10.15740/HAS/IRJAES/11.2/299-310
[24] Chandrashakar, G., Kumar, T.V., Thatikonda, S.S., Chennu, Y., Devi, B.V. (2021). Prediction and analysis of gold prices using ensemble machine learning algorithms. International Journal for Research in Applied Science & Engineering Technology, 9(6): 4367-4374. https://doi.org/10.22214/ijraset.2021.36028
[25] Sadorsky, P. (2021). Predicting gold and silver price direction using tree-based classifiers. Journal of Risk and Financial Management, 14(5): 198. https://doi.org/10.3390/jrfm14050198
[26] Mahato, P.K., Attar, V. (2014). Prediction of gold and silver stock price using ensemble models. In 2014 International Conference on Advances in Engineering & Technology Research (ICAETR - 2014), Unnao, India, pp. 1-4. https://doi.org/10.1109/ICAETR.2014.7012821