I. Gede Tunas*![]() | Puji Harsanto
| Puji Harsanto![]() | Yassir Arafat
| Yassir Arafat![]()
© 2024 The authors. This article is published by IIETA and is licensed under the CC BY 4.0 license (http://creativecommons.org/licenses/by/4.0/).
OPEN ACCESS
The impact of flood disasters in various regions in the world, especially in tropical countries, has now expanded and increased significantly. Climate change due to global warming is often considered a trigger for increasing rainfall intensity and duration which has a direct impact on the expansion of flood exposure. Mitigation to reduce the risk of flood impacts has been implemented using both structural and non-structural approaches. This paper aimed to develop and assess a flood mitigation model in one of the flood-prone areas in Central Sulawesi, Indonesia. The model was compiled and developed by selecting a number of determining factors using a structural equation modelling approach based on public participation by accommodating local wisdom. Public participation and local wisdom are very important aspects in flood mitigation because local communities with their traditions are the main subjects who understand the characteristics of local floods. The structural model consisted of 7 latent variables with 28 indicators as the outer model: (1) Community knowledge, (2) Community participation, (3) Green infrastructure (non-engineered infrastructure), (4) Gray infrastructure (engineered infrastructure), (5) Infrastructure maintenance, (6) The role of management institutions and government, and (7) Flood mitigation performance. A questionnaire survey was performed to assess public perception by submitting 28 statements representing indicator variables. Public perception was assessed based on a Likert scale. The questionnaire was distributed to 250 respondents representing various public components, such as: farmers/fishermen/ traders/labourers, students, practitioners (consultants and contractors), environmental NGOs, experts/academics and government elements. The results of the study revealed that 6 selected exogenous variables had a significant effect on endogenous variables. The significance of the influence was assessed by p-value (<0.05) and t-statistics (>1.96) of each variable. In addition, all indicator variables showed good validity and reliability against latent variables with loading factors more than 0.7 and Cronbach's Alpha higher than 0.7. Based on the results of the analysis, the flood mitigation model at the study site can be applied effectively by following the priorities: (1) Community knowledge, (2) Green infrastructure (non-engineered infrastructure), (3) Community participation, (4) The role of management institutions and government, (5) Gray infrastructure (engineered infrastructure), (6) Infrastructure maintenance. The increasing of community knowledge and application of green infrastructure and the inclusion of community participation are the main priorities in implementing flood mitigation in the study area.
structural approaches, non-structural approaches, green mitigation, statistical modelling, multiple variables, factor analysis
Floods with their various characteristics have become an important issue worldwide due to the expansion of the exposed areas and the increasing impact of the disasters caused [1]. Two factors, global warming and deforestation are considered the main triggers for the increasing impact of floods, not only in tropical climates such as Indonesia but also in other climates such as dry, temperate, continental and polar [2]. The first factor, global warming, one of which is also triggered by forest conversion, has caused climate change in various parts of the world which is characterized by deviations in climate parameter trends, especially rainfall [3]. Rainfall patterns no longer follow seasonal periods and are relatively difficult to predict, especially the time and magnitude of the rainfall event. The impact of this climate change is that the duration of rainfall can become longer and the rainfall depth can become higher, and even climate change often triggers extreme rainfall, especially in tropical climates [4]. The second factor that influences the widespread impact of floods is often associated with global warming, namely deforestation. A number of countries including Indonesia have lost forest areas due to deforestation of more than thousands of hectares per year [3]. This deforestation is not only caused by climate change that triggers an increase in global temperatures as a trigger for forest fires, but also caused by forest conversion deliberately carried out by humans for various purposes such as urban and residential development, mining exploitation, agricultural and plantation land development, and various other purposes. The loss of natural land cover factors causes an increase in surface runoff and a decrease in infiltration of flow into the soil, where both of these components will accumulate in rivers as flood flows [5]. The simultaneity between climate change and deforestation often causes major floods with very massive losses [6].
Mitigation as one of the efforts to reduce the risk and impact of flooding has also been carried out by both the government and community groups. The approach taken focuses on two things: increasing the capacity of the public who are potentially affected and reducing disaster vulnerability. Increasing public capacity can be done through socialization, discussion, training and workshops to transfer disaster knowledge and mitigation methods to the general community to form disaster preparedness and resilience community groups. Reducing disaster vulnerability can generally be performed through structural and non-structural approaches, such as: constructing flood control structures to protect affected areas and installing early warning system instruments to increase awareness of flood events [7]. However, these approaches are often ineffective and inefficient when floods hit an area suddenly. This is related to the attitude, culture, and readiness of the local community in dealing with disasters, especially floods.
One approach to assess the effectiveness of disaster mitigation programs in this case of flooding is the development of mitigation modelling. This modelling is intended to predict the impact of flooding and compile various scenarios by accommodating all factors that affect the effectiveness and efficiency of mitigation [8]. The most important thing in this modeming is the identification of all factors, both the potential and magnitude of the impact, especially rainfall as a trigger and the catchment area as a medium of transformation. The estimated impact through this modelling can be validated with field data related to the flood event and then a flood mitigation concept can be compiled by involving all stakeholders. Decision-making in the implementation of flood mitigation is highly dependent on the significance of the factors selected through public perception affirmation [9]. In addition, local community mitigation knowledge including the application of local wisdom in mitigation greatly influences the mitigation scenario and has a direct impact on the effectiveness and efficiency of the selected mitigation.
The study of flood mitigation modelling is a very long and time-consuming process. This stage is initiated from the preparation and application of the rainfall-runoff transformation model in a studied area, followed by flood modelling, inundation mapping and prediction of flood impacts and risks, variable selection and mitigation scenario preparation, and early warning of flood disasters. In this regard, many papers related to rainfall-runoff transformation have been published by a number of researchers. Tunas et al. [10] formulated a rainfall-runoff transformation model based on synthetic unit hydrograph using a number of measured catchments in Central Sulawesi, Indonesia. This model was further tested by Tunas [11] and applied by Tunas [12] in a number of catchments with various characteristics which showed that the model's performance was relatively very good in determining the flood peak. Ramly et al. [13] and Lin et al. [14] conducted the same study using the semi-distributed HEC-HMS Model to estimate the flood peak. This study used radar rainfall data as model input and integrated it with a web-based prototype system. The output of this study indicated that the performance of the transformation model can be improved by optimizing several parameters.
Flood modelling and flood mapping as a continuation of the rainfall-runoff transformation have been carried out by many researchers, both with a hydrodynamic modelling approach and an artificial intelligence approach. Nastiti et al. [15] applied the rainfall-runoff-inundation (RRI) model to map flood inundation in the Upper Citarum Watershed. Zhang et al. [16] conducted the similar study using a distributed hydrodynamic model to predict inundation characteristics. Both researchers used rainfall data as model input but applied different approaches in the analysis methodology. Utilizing rainfall as simulation input data indicates that the results of the prediction of the height and area of inundation are relatively very accurate [15, 16]. The results of this study have also been verified by Keum et al. [17] by evaluating the inundation probability and inundation depth using the same input data. In general, all models performed to predict and map flood inundation showed good performance with the condition of parameter optimization. Other intelligence-based approaches in flood modelling and mapping have also been implemented [18-20]. The applied artificial intelligence methods include: ANN, machine learning and hybrid with other approaches. The accuracy of the modelling results is highly dependent on the quality, quantity and variety of data to train and validate the model.
Applications of hydrodynamic models in specific river segments for inundation mapping to support flood mitigation have also been published. The difference between the publications in the previous section and this study is that the application is more detailed on river segments and not on the catchment area scale. The input of the hydrodynamic model at the catchment area scale is rainfall intensity, while the application at the river cement scale uses hydrographs as model input. Afshari et al. [21], Darabi et al. [22], Tansar et al. [23], and Beden and Keskin [24] performed 2D modelling to predict inundation using a number of 2D hydrodynamic models, such as: AutoRoute, HAND, HEC-RAS2D, GARP, QUEST, and MIKE. Each model showed different performance with a good level of accuracy. The numerical method chosen to solve partial differential equations greatly determines the accuracy of the model.
The series of publications are preliminary studies to support the preparation of flood mitigation models using structural equation modelling (SEM). The use of SEM for applied research can be seen in many publications, especially for decision making in various applied fields such as assessing public perception on public rooftop gardens interconnection routes [25], investigating new research possibilities in several sectors: phone, M-commerce, industry, manufacture, service, education, finance, healthcare, construction and SME [26], and predicting the impact of drought on urban water affordability [27]. Furthermore, Jia et al. [28] also used SEM to assess the ecological integrity of the woods. Two types of variables were applied in the study, which were assigned as latent variables and manifest variables. The number of variables was determined based on public opinion and literature review and selected based on correlation analysis.
SEM applications in the field of water resources, especially flood mitigation, have not been widely published. There are at least two recent publications that discuss the use of SEM to assess the relationship between flood mitigation strategy variables. Faruk and Maharjan [29] studied the strategies of 359 farmers for flood adaptation using SEM based on Protection Motivation Theory (PMT). Based on the findings, farmers are more likely to adopt flood adaptation strategies if they believe that their area is at higher danger of flooding and if they are more afraid of flooding. Nugraheni et al. [30] performed modelling community participation in flood disaster mitigation based on land conversion and disaster resilience using three models (CLEAR model, CLUE-S model, and DROP model). This study specifically examined the correlation between non-structural flood mitigation models in order to lessen the effects of floods on 1398 households.
More detailed studies relating to the application of SEM on flood mitigation have also been carried out by a number of researchers. Ejeta et al. [31] examined the cognitive and emotional elements that determine a community's readiness for flood hazards. The people previously been impacted by a hazard occurrence are more anxious and inclined to engage in community preparation exercises. Furthermore, Fatemi et al. [32] assessed the effects of floods in Dhaka using structural equation modelling which confirmed that flood affects are influenced by socioeconomic factors. Then, Kurata et al. [33] investigated the variables influencing flood disaster preparedness and mitigation which revealed that adapted behaviour on flood disaster preparedness was strongly influenced by perceived behavioural control, social norms, and attitude towards the behaviour. After that, Santoro et al. [34] evaluated how citizens perceive flood risk by performing a structural equation model to identify valuable factors for supporting flood management in new vulnerable regions. It is indicated that the perception of risk is significantly impacted by knowledge of flood causes.
This study aimed to develop flood mitigation scenarios using SEM based on public participation and local wisdom. The variables that were be applied in this study included many variables and sub-variables, not only limited to non-structural flood mitigation scenarios as applied by Nugraheni et al. [30], but also accommodate various structural mitigation factors. This research is very important in relation to the involvement of public participation in the formulation and selection of variables and the exploration of local wisdom in flood management and mitigation. Previous published studies have not shown the use of complex variables in SEM to formulate flood mitigation models. Therefore, this study not only contributes to the development of science, but can also be a reference in flood management and mitigation in a disaster-prone area.
2.1 Research site
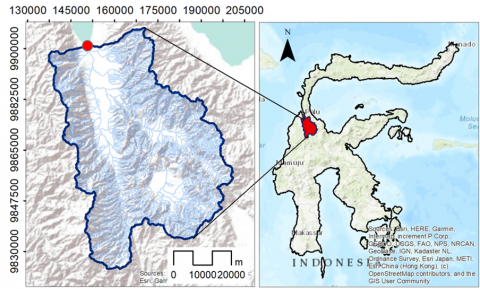
This flood mitigation model research was conducted in Palu Watershed, Central Sulawesi Indonesia (Figure 1). This catchment is a flood-prone area primarily during the rainy season which is spread across several locations, especially in the middle and downstream sections of the watershed. Floods due to overflowing Palu River and its tributaries often inundate agricultural, plantation and residential areas in the middle segment which includes several villages in Palolo District (Rejeki, Berdikari, and Kapiroe), Gumbasa District (Tuva, North Pakuli), Sigi Biromaru District (Sidondo I, II and III), and in the downstream segment, it inundates urban areas in four sub-districts: Ujuna, Lere, North Lolu, and West Besusu.
Figure 1. Study area at Palu Watershed, Central Sulawesi Indonesia
Floods that inundate these areas are generally destructive to all objects around them such as plants, settlements, public facilities and infrastructure and other facilities. During the flood season, affected communities must be evacuated to areas that are safe from the threat of flooding for some time. The duration of inundation generally varies depending on the duration of rainfall and the topographic characteristics of the area. Referring to several flood cases, the duration of inundation can reach more than three days with a depth of more than 1 m. Crop failure and damage to residential facilities are the worst impacts caused by flooding in the past. However, flooding in this area can also have an impact on death, especially due to flash floods in several tributaries such as: Bangga, Sambo, Rogo and Poi rivers. Floods with a very short peak time carry sediment material with high concentrations and damage all objects that pass through it. Sediment material comes from surface erosion in the upstream catchment and vertical erosion on both river banks due to rainwater splashes and surface runoff. The frequency and intensity of flooding currently tend to increase since the 7.4 magnitude earthquake shocked the Palu area and its surroundings on September 28, 2018. This is predicted to be related to the decrease in soil density and slope stability due to the earthquake. The soil surface becomes more easily eroded due to the weak bonds of soil particles along with the decrease in soil surface density.
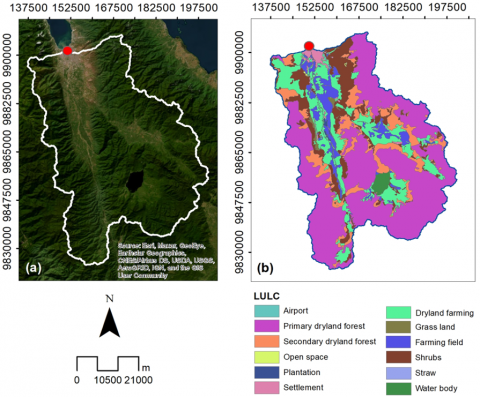
Other factors that are no less important as contributors to the increasing frequency of flooding in the Palu catchment are land use and land cover (LULC). The need for residential areas due to population growth has caused an increase in land conversion from non-residential land to residential land. The expansion of agricultural and plantation areas to meet living needs has also caused the conversion of forest land. Intensive land cover changes can reduce the area of water infiltration. Surface runoff increases with the expansion of open land. Figure 2 shows the land cover of the Palu catchment when this study was conducted. Land cover changes are generally seen around the river channels and banks where this location is close to water sources and has a relatively flat topography. The development of this area is intended for the expansion of agricultural and plantation land in the upstream and middle areas, and the development of settlements and cities in the downstream areas.
Figure 2. LULC of Palu watershed: (a) Google image; (b) Land use
Until now, land conversion in the study site can reach more than 30%, which can trigger an increase in surface runoff in residential areas and in agricultural and plantation areas. This land conversion is highly correlated with increased inundation due to flooding. The major flood event after the 2018 Palu Earthquake has caused an increase in the characteristics of inundation not only in area and volume but also in duration. However, mitigation efforts to reduce the risk of impacts are still being carried out and even the coverage area is being expanded throughout the catchment. Law enforcement against violations in the Lore Lindu National Park (TNLL) conservation zone is being increased to suppress illegal land encroachment by local communities both for the use of forest products and for the expansion of plantation and agricultural areas. This conservation area of approximately 2,180 km2 is one of the natural mitigation facilities by maximizing infiltration and minimizing runoff in two large watersheds: Palu and Lariang. Almost half of the upstream Palu Watershed is a TNLL conservation area, especially the Gumbasa sub-watershed which covers the entire Lake Lindu area. The position of this conservation area is very strategic because it is surrounded by five valleys: Palu, Palolo, Napu, Besoa and Kulawi, where the fulfilment of water resource needs is obtained from river flows that originate from this conservation area.
As seen in Figure 2(a) and Figure 2(b), land conversion in the TNLL area has increased to date. Land conversion is marked with light green, especially in the southern part of Lake Lindu due to the expansion of plantation land by the local community. If land conversion in this area is not controlled, the possibility of shallowing at the bottom of the lake will increase. The main impact is that the natural reservoir capacity of Lake Lindu will decrease in proportion to the sedimentation rate which is correlated with the rate of land conservation. Reduction in reservoir capacity can trigger greater runoff downstream towards the Gumbasa River and then integrate into the Palu River. The accumulation of flow in this main river causes an increase in flood intensity, especially in the middle and downstream segments of the Palu River.
2.2 Flood inundation modelling
Flood inundation modelling is an important step in flood mitigation that aims to predict inundation characteristics, especially the height and area of inundation. These parameters can be used as a reference for selecting the determining variables of the mitigation model to be applied. Basically, flood event data at the study site is accurate information to describe the level of flood vulnerability. However, this information is only limited to a certain rainfall depth, which may be higher and the area of inundation can be greater in other rainfall events. Therefore, inundation modelling is one method to predict the potential for inundation based on several rainfall depth scenarios according to the probability of occurrence.
One method that can be applied to inundation modelling at the catchment scale is HEC-RAS2D. This two-dimensional model is a development of a one-dimensional model which was initially used to predict water surface profiles in channels or rivers for both steady and unsteady flows [35]. In this 2D model, the model geometry is formed from digital elevation model (DEM) data which is converted into a mesh at both the river and catchment scales [36]. This domain discretization is related to the finite volume numerical scheme approach implemented to solve the Diffusion Wave equations (DWE) and the Shallow Water Equations (SWE) following Eq. (1) and Eq. (2). The modelling results can be presented in a map of inundation distribution throughout the studied area.
$\begin{gathered}\frac{\partial h}{\partial t}+\frac{\partial(h u)}{\partial x}+\frac{\partial(h v)}{\partial v}-q=0\end{gathered}$ (1)
$\begin{gathered}\frac{\partial u}{\partial t}+u \frac{\partial u}{\partial x}+v \frac{\partial u}{\partial y}=-g \frac{\partial h}{\partial x}+v_t\left(\frac{\partial^2 u}{\partial x^2}+\frac{\partial^2 u}{\partial y^2}\right) -c_f u+f v\end{gathered}$ (2)
where, h: water depth (m), t: time (m), u: velocity in x-direction (m/sec), v: velocity in y-direction (m/sec), q: lateral inflow, g: gravity acceleration (m/sec2), vt: viscosity of turbulent eddy, and cf: coefficient of non-linear friction.
2.3 Structural equation modelling
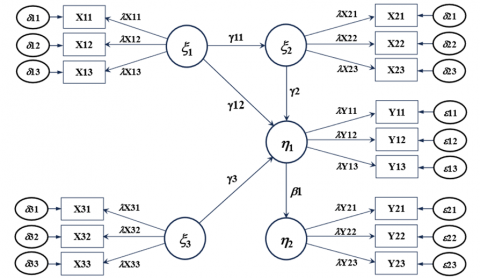
Flood mitigation scenario modelling based on public perception can be executed using the structural equation modelling (SEM) approach as a multivariate analysis technique to test the relationship between complex variables simultaneously [37]. Variables in SEM are expressed by latent variables and indicator variables (manifest), where latent variables represent variables that are not observed and measured directly consisting of exogenous variables (independent construct, $\xi$) and endogenous variables (dependent construct, $\eta$), while indicator variables are variables that are observed and used to measure latent variables. Latent variables are also known as part of the inner model (structural model) while indicator variables are part of the outer model (measurement model). The outer model addresses the connections between latent variables and their corresponding observable indicators, whereas the inner model focuses on the relationships among the latent variables themselves. In SEM, mediation variables (intermediary variables or intervening variables) are often used to connect two exogenous variables or exogenous variables with endogenous variables [38]. The use of this mediation variable shows the level of complexity of the SEM model. The structural relationship between latent variables is considered linear which is expressed by a regression relationship, both the relationship between exogenous variables and endogenous variables ($\gamma$) and the relationship between two endogenous variables ($\beta$). The correlation relationship between these latent variables produces an error ($\delta$, $\zeta$). A typical SEM diagram in detail can be seen in Figure 3, with measurement and structural equations as follows:
$\xi_i=\lambda_{X i}+\lambda_{X i+1}+\cdots \lambda_{X n}+\delta_i$ (3)
$\eta_i=\gamma_i \xi_i+\gamma_{i+1} \xi_{i+1}+\cdots \gamma_n \xi_n+\zeta_i$ (4)
where, $\delta$: error of manifest variables and $\zeta$: error of latent variables.
Figure 3. Typical variables and path diagram in SEM
The most important part in SEM analysis is testing the research instrument which includes: (1) validity test (convergent and discriminant validity) and reliability test (composite reliability) on the measurement model (outer model), (2) test of coefficient of determination (R-square) and estimate for path coefficients, (3) hypothesis test, and (4) path analysis [39]. The research instrument is considered valid if the outer loadings (loading factors) value is >0.7, Average Variance Extracted (AVE) is >0.5 (convergent validity), and the loading factor value of each indicator is higher than cross loading of each indicator and AVE of each latent variable is larger than the highest r2 of other latent variables (discriminant validity). The reliability of the instrument can be measured by Cronbach's Alpha and Composite Reliability where both parameters must be greater than 0.7. The determination coefficient test is intended to assess the strength of the relationship of the structural model (inner model) which is expressed in 3 categories: strong (>0.75), moderate (0.25 - 0.75) and weak (<0.25). At the same time, the path coefficient can also be estimated based on the SEM scheme according to the number and structure of latent variables (exogenous variables and endogenous variables). The significance of the relationship between the two types of variables can be evaluated by hypothesis testing which is measured by the p-value at a significance of 5%. Exogenous variables have a significant effect on endogenous variables if the p-value is lower than 0.05. The final stage and instrument testing is path analysis in relation to the use of mediating variables. This analysis aims to test the direct or indirect relationship between variables in the model [40].
There are two basic approaches that can be used for SEM-based multivariate analysis, namely variance-based structural equation modelling (VB-SEM) and covariance-based structural equation modelling (CB-SEM). The first approach is often referred to as Partial Least Square Path Modelling (PLS-SEM). The selection of the two models is based on the objectives, number of samples and characteristics of the data distribution. If the purpose of the analysis is to test the predictive relationship and determine the significance of the influence between construct variables, then PLS-SEM can be selected for application. However, if the purpose of the analysis is to confirm the theoretical model with an empirical model, then CB-SEM is the alternative choice. In this study, the SEM approach chosen was PLS-SEM in relation to the objectives of the analysis to be achieved, namely to see the significance of the influence of exogenous variables on endogenous variables. Exogenous variables were presented by factors that influence flood mitigation performance (endogenous variables) which were be the priority for implementing flood mitigation at the study site.
2.4 Research design
This study is a quantitative study to collect public perceptions through a questionnaire on the Google Form platform distributed via the WhatsApp application. The statements in the questionnaire consisted of 28 statements representing 7 (seven) flood mitigation variables (Table 1). Respondents' opinions (perceptions) were measured using a Likert scale that included 5 points: Strongly Disagree (1), Disagree (2), Neutral (3), Agree (4) and Strongly Agree (5). The questionnaire was distributed to a number of respondents with various professions (farmers, traders, consultants, contractors, students, academics, NGOs, and government) and education levels (elementary, junior high, high school and college) with a minimum target of 200 respondents, as suggested in various literatures that the sample size should be between 100 and 400 [41]. Respondents were distributed randomly at the study location by taking into account the representation of various elements in filling out the questionnaire. The questionnaire formulation was based on the proposed SEM diagram as in Figure 4.
Figure 4. SEM diagram of flood mitigation model
The selection of research variables (X1, X2, X3, X4, X5, X6 and Y1) was based on a review of literature related to flood mitigation. In addition, the opinions of experts and practitioners in the field of disaster management, especially floods, were also used as references in determining variables. These experts came from academics while practitioners are generally personnel of contractors, consultants and disaster agencies (BPBD). All of these variables were tested for their significant influence on endogenous variables following the path diagram as in Figure 4 to assess whether all of these variables could be determined as final model variables. The significance of the variables was seen from the p-value and t-statistics of the path that describe the relationship between two variables where the p-value must be lower than 0.05 and the t-statistic must be greater than 1.96. However, preliminary studies related to the selection of variables, especially exogenous variables, had generally provided adequate information on the significance of the variables. Therefore, in the early stages of modelling, all factors that have the potential to become variables should be accommodated in the model.
As shown in Table 1 and Figure 4, the total indicators representing the seven latent variables are 28 indicators, 3 indicators for X1, 5 indicators for X2, 4 indicators for X3, 3 indicators for each of X4 and X5, 6 indicators for X5, and 4 indicators for Y1. The selection and determination of indicators are also relatively similar to the determination of latent variables, where the review of related literature is the dominant reference. Basically, each latent variable can be represented by many indicators that describe the quantitative magnitude of the variable. The goodness of measurement of latent variables will be higher in proportion to the number of indicators that represent them. However, in the analysis, a number of indicators often show similar measurements, resulting in low factor loading coefficients. The validity of the research instrument requires that the factor loading coefficient of each indicator must be greater than 0.7. Limiting the number of indicators as outer model variables is an effort to fulfil the validity of the instrument, especially convergent validity.
Table 1. Variables and indicators of flood mitigation model
|
No. |
Variable/Indicator |
Symbol |
|
|
1 |
Community Knowledge |
X1 |
|
|
1.1 |
Local wisdom in flood mitigation (Ombo: customary prohibition against cutting down trees in the forest in the traditions of the Kaili tribe) |
X11 |
|
|
1.2 |
Flood impact on the environment |
X12 |
|
|
1.3 |
Flood mitigation procedures |
X13 |
|
|
2 |
Community Participation |
X2 |
|
|
2.1 |
Forest preservation and policy in converting land |
X21 |
|
|
2.2 |
Preservation of the river without dumping waste and garbage in the river |
X22 |
|
|
2.3 |
Maintenance of flood control structures in the river |
X23 |
|
|
2.4 |
Involvement in disaster alert communities and environmental NGOs |
X24 |
|
|
2.5 |
Flood-friendly residential development (flood proofing) |
X25 |
|
|
3 |
Green Infrastructure (Non-engineered Infrastructure) |
X3 |
|
|
3.1 |
Reforestation and arrangement of watershed slopes |
X31 |
|
|
3.2 |
Development of natural retention ponds and biopore absorption wells |
X32 |
|
|
3.3 |
Revitalization of natural drainage channels |
X33 |
|
|
3.4 |
Development of flood disaster early warning system |
X34 |
|
|
4 |
Gray Infrastructure (Engineered Infrastructure) |
X4 |
|
|
4.1 |
Construction of levee/dike and channel normalization |
X41 |
|
|
4.2 |
Construction of flood storage (reservoirs, retention ponds, flood polders) |
X42 |
|
|
4.3 |
Construction of flood way and short-cut |
X43 |
|
|
5 |
Infrastructure Maintenance |
X5 |
|
|
5.1 |
Routine maintenance (every day) |
X51 |
|
|
5.2 |
Periodic maintenance (every 3 months) |
X52 |
|
|
5.3 |
Emergency maintenance (if required) |
X53 |
|
|
6 |
The Role of Management Institutions and Government |
X6 |
|
|
6.1 |
Availability of mitigation agencies: regional mitigation board, province/regency/district/city/district government |
X61 |
|
|
6.2 |
Disaster-based spatial planning, delineation of flood plain) and mapping of flood hazard areas (zoning) |
X62 |
|
|
6.3 |
Development of evacuation routes and places |
X63 |
|
|
6.4 |
Education, training and awareness of disaster mitigation to the community |
X64 |
|
|
6.5 |
Relocation of flood-affected communities |
X65 |
|
|
6.6 |
Issuance and application of regional regulations on river management |
X66 |
|
|
7 |
Flood Mitigation Performance |
Y1 |
|
|
7.1 |
Inundation characteristics |
Y11 |
|
|
7.2 |
Impact on infrastructures |
Y12 |
|
|
7.3 |
Impact on properties |
Y13 |
|
|
7.4 |
Impact on fatalities |
Y14 |
|
3.1 Inundation characteristics of flood
The results of 2D flood inundation simulation using HEC – RAS2D at the study location showed that flood inundation was distributed almost throughout the catchment area including the upstream, middle and downstream parts as shown in Figure 5. The area and height of inundation depended on the topographic characteristics of the area, especially those associated with the basin area. Inundation characteristics varied greatly according to the topographic position of the area from the surface of the river flow. The height and area of inundation are indicated by the blue – light blue colour gradation (Figure 5(a)) while the inundation elevation is represented by the green – yellow – red colour gradation (Figure 5(b)). The middle and downstream segments were areas exposed and affected by flooding with the highest risk of losses, especially in the Palolo Valley (middle segment) and Palu City and its surroundings (downstream segment) with an inundation area reaching more than 6,000 hectares in the middle segment and including the upstream segment which is agricultural and plantation land and more than 500 hectares in the downstream area which includes residential and urban areas. The duration of flooding also varied greatly depending on the availability of drainage channels, both artificial and natural, around the flooded area.
Figure 5. Inundation characteristics: (a) Depth and (b) Water surface elevation
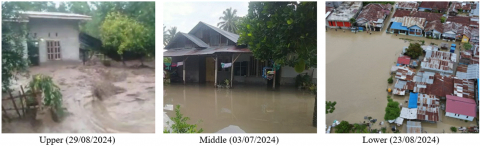
Floods in 2024 also hit several areas in the study location including the upstream, middle and downstream areas as documented in Figure 6 and Table 2. The water depth varied between 0.5 m and 2 m with a maximum duration of 6 hours. The characteristics of the flood this year are relatively different from the previous event which was characterized by relatively high sediment concentrations. The flood inundated agricultural/plantation areas in the upstream and middle parts, while in the downstream part it inundated more residential areas. The intensity of flooding this year tends to increase with a wider exposed area and higher flow depth. This is related to the reduction in infiltration areas due to land conversion and the lack of optimal implementation of flood mitigation programs both by the government and local community which includes structural and non-structural mitigation.
Figure 6. Flood documentation at study location in 2024
Table 2. Flood event in 2024 at study area
|
Day/Date |
Time |
Location |
Water Level (m) |
Exposed Area |
|
Thursday, August 29, 2024 |
11.30 local time |
Uenuni Village, Palolo District, Sigi Regency |
1 – 2 |
32 houses and 61.75 ha farmland |
|
Wednesday, July 3, 2024 |
21.30 local time |
Bobo Village, West Dolo District, Sigi Regency |
0.5 – 1 |
71 houses, 73 families with 286 people |
|
Friday, August 23, 2024 |
16.15 local time |
Baru, Ujuna, West Besusu, and North Lolu Sub-districts |
0.5 – 1.5 |
101 houses, 736 people, 3 ha settlement area |
3.2 Structural equation modelling of flood mitigation
3.2.1 Respondent
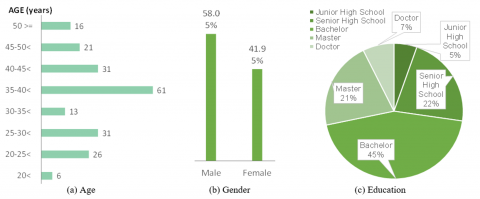
The number of respondents who filled out the questionnaire via google form was 211 people, but six respondents' answers were considered invalid because they were indicated to choose the same answer for all statements. Respondent characteristics could be presented in three categories: age, gender and education which could describe the role in the implementation of flood mitigation programs (Figure 7). Respondents were dominated by those aged 35-40< years as much as 29.75%, male gender as much as 119 people and bachelor's degree education as much as 45%. The characteristics of the respondents were considered quite representative in responding to statements related to perceptions of flood mitigation.
Figure 7. Respondent characteristics
Respondents’ answers were highly dependent on their knowledge and understanding of flood mitigation. This knowledge and understanding were mainly influenced by the level of education and occupation in addition to age and gender. The respondents’ backgrounds were very closely related to the consistency of the answers given when the same statement was asked again to them. The consistency of the respondents’ answers is closely related to the validity and reliability of the instrument. Therefore, the statements in the questionnaire were made as concise as possible with sentence constructions that were easy for respondents to understand because respondents were randomly assigned with diverse backgrounds.
Respondents' answers fulfilled all five scales of instrument measurement with scores of 1, 2, 3, 4, and 5 spread across 28 statements representing six exogenous variables and one endogenous variable. Respondents predominantly answered agree, strongly agree, and neutral as shown in Table 3 with a minimum average score of 3.5 and a maximum average score of 3.83 for each variable. These respondents' answers can actually provide an initial picture of the relationship between each indicator variable and the latent variable and the individual relationship of each exogenous variable with the endogenous variable. However, this score cannot yet describe the simultaneous relationship of exogenous variables with endogenous variables.
Table 3. Average score of indicator variables
|
Indicator Variables |
Respondent Number |
Average Score |
||||
|
Strongly Disagree (1) |
Disagree (2) |
Neutral (3) |
Agree (4) |
Strongly Agree (5) |
||
|
X11 |
6 |
22 |
30 |
96 |
51 |
3.78 |
|
X12 |
14 |
16 |
23 |
98 |
54 |
3.79 |
|
X13 |
6 |
22 |
35 |
107 |
35 |
3.70 |
|
X21 |
6 |
26 |
32 |
110 |
31 |
3.65 |
|
X22 |
14 |
18 |
21 |
106 |
46 |
3.74 |
|
X23 |
6 |
22 |
24 |
101 |
52 |
3.83 |
|
X24 |
8 |
34 |
23 |
93 |
47 |
3.67 |
|
X25 |
4 |
34 |
28 |
103 |
36 |
3.65 |
|
X31 |
7 |
16 |
26 |
124 |
32 |
3.62 |
|
X32 |
10 |
26 |
27 |
120 |
22 |
3.58 |
|
X33 |
6 |
28 |
35 |
101 |
35 |
3.64 |
|
X34 |
14 |
20 |
33 |
94 |
44 |
3.65 |
|
X41 |
7 |
38 |
39 |
88 |
33 |
3.50 |
|
X42 |
10 |
14 |
40 |
98 |
43 |
3.73 |
|
X43 |
14 |
27 |
39 |
75 |
50 |
3.59 |
|
X51 |
8 |
20 |
32 |
99 |
46 |
3.76 |
|
X52 |
12 |
18 |
27 |
96 |
52 |
3.74 |
|
X53 |
3 |
35 |
29 |
100 |
38 |
3.65 |
|
X61 |
6 |
24 |
28 |
102 |
45 |
3.76 |
|
X62 |
8 |
28 |
26 |
94 |
49 |
3.72 |
|
X63 |
10 |
24 |
33 |
104 |
34 |
3.62 |
|
X64 |
8 |
32 |
23 |
113 |
29 |
3.60 |
|
X65 |
10 |
29 |
22 |
100 |
44 |
3.68 |
|
X66 |
6 |
22 |
24 |
103 |
50 |
3.82 |
|
Y11 |
8 |
34 |
25 |
92 |
46 |
3.65 |
|
Y12 |
4 |
34 |
32 |
100 |
35 |
3.61 |
|
Y13 |
6 |
20 |
33 |
115 |
31 |
3.71 |
|
Y14 |
10 |
26 |
28 |
119 |
22 |
3.57 |
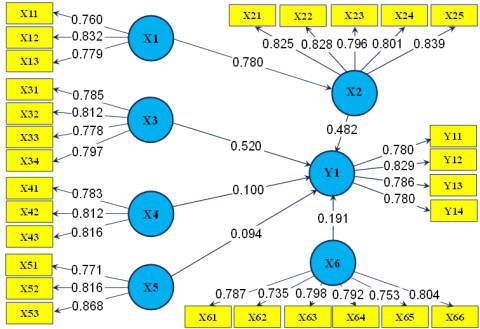
3.2.2 Instrument validity and reliability
The validity and reliability of the instrument in structural equation modelling using SmartPLS can be measured by several criteria: outer loading coefficient, AVE, Cronbach's Alpha, reliability coefficient, and composite reliability whose values can be seen in the algorithm model (Figure 8) and the construct reliability and validity of each latent variable (Table 4). The test results showed that all variables meet the validity requirements, both convergent validity and discriminant validity, which were stated by the outer loading coefficient higher than 0.7 and AVE greater than 0.5. Furthermore, all variables were indicated to meet the reliability requirements as measured by Cronbach's Alpha and composite reliability as written in Table 4 with values above 0.7. As an initial step in SEM modelling, all selected variables can be used further in the analysis by considering the results of the validity and reliability test of the instrument. The significance of the relationship between exogenous and endogenous variables can be seen from the path coefficient in the algorithm model (Figure 8) and the t-statistics of loading factors and path coefficients through the bootstrapping procedure (Figure 9). The path coefficient actually emphasizes more on the strength and direction of the relationship (positive or negative) between variables with a value range between -1 to +1. The significance of the influence between variables in the early stages can be identified based on the path coefficient, which describes the extent to which the independent variable influences the dependent variable in a causal relationship. The path coefficient in this study showed a positive relationship with a range between 0.094 to 0.780 (Table 5). For example, the relationship between X1 and X2 with a path coefficient of 0.780 can be interpreted as a 78.0% increase in variable X2 due to a 1 unit increase in variable X1. Based on the path coefficient value (Table 5), some variables showed a medium to high influence (X1, X2 and X3) and others showed a weak influence (X4, X5 and X6). However, the path coefficient is only an initial indicator of the significance of the variable's influence, therefore this significance must be tested with other statistical parameters. The results of the path coefficient analysis of the Algorithm model indicate the findings of this research where local community knowledge and participation play an important role in flood mitigation, especially in the research area, in addition to the application of green infrastructure. This is relatively different from flood mitigation efforts in various regions of Indonesia in general which prioritize structural implementation in both the short and long term. Therefore, it is very important to accommodate community participation by accommodating local wisdom to support the success of flood mitigation.
Figure 8. Model algorithm: loading factors and path coefficients
Table 4. Construct reliability and validity
|
Latent Variables |
Construct Reliability and Validity |
|||
|
Cronbach's Alpha |
Reliability Coefficient (rho_A) |
Composite Reliability |
Average Variance Extracted (AVE) |
|
|
>0.7 |
>0.7 |
>0.7 |
>0.5 |
|
|
X1 |
0.701 |
0.706 |
0.834 |
0.626 |
|
X2 |
0.876 |
0.879 |
0.910 |
0.669 |
|
X3 |
0.804 |
0.807 |
0.872 |
0.629 |
|
X4 |
0.727 |
0.728 |
0.846 |
0.647 |
|
X5 |
0.759 |
0.791 |
0.859 |
0.671 |
|
X6 |
0.870 |
0.873 |
0.902 |
0.606 |
|
Y1 |
0.804 |
0.805 |
0.872 |
0.630 |
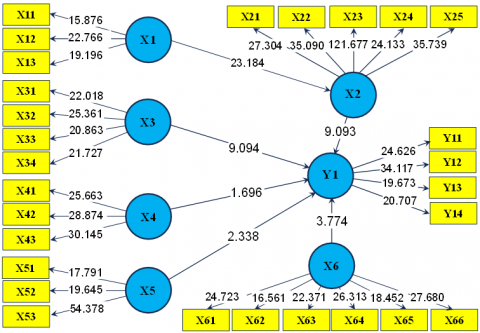
Figure 9. t-statistics of loading factors and path coefficients
Table 5. Significance of the influence of exogenous variables on endogenous variables
|
Influence of Variables |
Statistical Parameters |
||
|
Path Coefficient |
t-statistics |
p-value |
|
|
>1.96 |
<0.05 |
||
|
X1 → X2 |
0.780 |
23.184 |
0.000 |
|
X2 → Y1 |
0.482 |
9.093 |
0.000 |
|
X3 → Y1 |
0.520 |
9.094 |
0.000 |
|
X4 → Y1 |
0.100 |
1.696 |
0.091 |
|
X5 → Y1 |
0.094 |
2.338 |
0.020 |
|
X6 → Y1 |
0.191 |
3.774 |
0.000 |
Important statistical parameters that function to assess the significance of the influence of variables are t-statistics and p-values with the condition that t-statistics > 1.96 and p-value <5%. As shown in Table 5, almost all variables meet the requirements for t-statistics and p-values except for variable X4. However, X4 which represents gray infrastructure does not show a large difference in terms of t-statistics and p-values. This means that the accommodation and neglect of these variables can be determined by decision makers based on the real impact in the field. Several researchers recommend the same thing, such as Albahri et al. [26] and Rachunok and Fletcher [27] that if the difference between the p-statistic and the p-value calculated with the p-statistic and p-value standard is relatively very small, the initial hypothesis can be ignored depending on the objectives of the modelling and analysis by considering the facts in the field. However, several other researchers suggest remaining consistent with the results of statistical tests where the variable is considered to have no role and influence in decision making [25, 28]. Based on these considerations, the final decision taken in this study is to continue to take the variable into account in determining the flood mitigation model even though the statistical test is not significant.
Ideally, it is very hard to obtain all statistical parameters of the model that can meet both validity and reliability requirements. This is related to the randomness of respondents' perceptions which are very hard to control [42]. Respondents' perceptions are closely related to their background and their understanding of flood mitigation. All possible answers will be given by respondents related to the statements submitted. Keum et al. [17] provide the same opinion regarding the fulfilments of variability and validity tests, including the significance test of the influence of variables (path coefficient), the significance test of the average calculation results (t-test) and the hypothesis test (p-value). Strong relationships between variables can trigger statistical test deviations, although the multicollinearity aspect has been anticipated at the beginning of the analysis. Variable elimination can be done if the number of variables tends to be very large by screening them using several statistical instruments [43]. However, if the number of variables implemented is limited, the researcher's considerations in decision making can be carried out.
3.3 Flood mitigation scenario
Flood mitigation scenarios are determined based on the model algorithm that has been prepared with a set of tests that have been executed. Considering the test results as in Table 4 and Table 5 with reference to Figure 8, the flood mitigation scenario is determined according to the priority assessed from the significance of the variables. In addition to the significance of the referred variables, the determination coefficient describes the causal relationship between variables. The determination coefficient of the model construct is classified as moderate at 0.608 (X1 → X2) and 0.482 (X2, X3, X4, X5, and X6 → Y1). Based on these considerations, the flood mitigation scenarios that can be implemented at the study site according to their priorities are: (1) Community knowledge, (2) Green infrastructure, (3) Community participation, (4) The role of management institutions and government, (5) Gray infrastructure, and (6) Infrastructure maintenance.
However, in a broader study, it is necessary to consider the limitations of this study in order to be able to apply it sustainably, such as the number of samples that can be further increased with a more diverse background. The limitations of variables in this study can affect the decision-making of flood mitigation priorities. Therefore, other factors that have the potential to become research variables can be accommodated in further SEM modelling. In addition, the assumption of linear relationships between exogenous and endogenous variables is another limitation in SEM modelling that can affect the path coefficient, where in fact the relationship between these variables may not be linear as assumed.
This flood mitigation scenario is expected to have direct implications for the performance of flood management and mitigation, especially in the Palu watershed, which can be measured by reducing the volume, area and duration of inundation and reducing material losses and fatalities. Local communities must be involved in flood management and mitigation so that mitigation performance can be more optimal. Details of the role of local communities can be an interesting topic in future sustainable mitigation research.
Flood mitigation studies have been conducted at the study site initiated by identifying and modelling flood-prone areas and verified with the results of field investigations. Flood inundation was spread from the upstream, middle and downstream segments of the study area. Flood mitigation scenarios that can be applied depend on the distribution of inundation and local community perceptions of the impacts caused by flooding. These perceptions have been collected from 205 respondents using a questionnaire by implementing an online survey platform. Respondents showed high background variability including age, gender, occupation and education.
Structural equation modelling (SEM) has been applied using 7 latent variables and 28 indicators. All indicator variables and latent variables involved in the model meet all tests for both validity and reliability. Based on the test results, the flood mitigation scenarios that can be applied by considering the implementation priorities are: Community knowledge, (2) Green infrastructure, (3) Community participation, (4) The role of management institutions and government, (5) Gray infrastructure, and (6) Infrastructure maintenance. However, in its application, it is also necessary to consider the limitations of this study, such as limited sample size, limited number of variables, especially exogenous variables, and the assumption of a linear relationship between exogenous and endogenous variables. These limitations provide opportunities for further research in the future by emphasizing the details of the role of local communities in flood mitigation.
This work was officially funded by the Ministry of Education, Culture, Research and Technology via Fundamental Research (Grant No.: SP DIPA-023.17.1.690523/2024).
We thank the Directorate of Research and Community Service for the financial support that has been provided for the research.
|
DEM |
digital elevation model |
|
SEM |
structural equation modelling |
|
PLS |
partial least square |
|
X, Y |
exogenous and endogenous variables |
|
Greek symbols |
|
|
$\delta$ |
error of manifest variables |
|
$\zeta$ |
error of latent variables |
|
$\xi$, $\eta$ |
independent and dependent constructs |
|
Subscripts |
|
|
i |
1, 2, 3, ..., n |
|
n |
number of variables |
[1] Idowu, D., Zhou, W. (2023). Global megacities and frequent floods: Correlation between urban expansion patterns and urban flood hazards. Sustainability, 15(3): 2514. https://doi.org/10.3390/su15032514
[2] Tunas, I.G., Samatan, S., Anwar, N. (2020). Prediction of land conversion impact on flood peaks using the ITS-2 synthetic unit hydrograph model in Sausu River, Sulawesi, Indonesia. AIP Conference Proceedings, 2278: 020001. https://doi.org/10.1063/5.0014481
[3] Basuki, T.M., Nugroho, H.Y.S.H., Indrajaya, Y., Pramono, I.B., et al. (2022). Improvement of integrated watershed management in Indonesia for mitigation and adaptation to climate change: A review. Sustainability, 14(16): 9997. https://doi.org/10.3390/su14169997
[4] Zelelew, D.G., Melesse, A.M. (2018). Applicability of a spatially semi-distributed hydrological model for watershed scale runoff estimation in Northwest Ethiopia. Water, 10(7): 923. https://doi.org/10.3390/w10070923
[5] Roldán-Valcarce, A., Jato-Espino, D., Manchado, C., Bach, P.M., Kuller, M. (2023). Vulnerability to urban flooding assessed based on spatial demographic, socio-economic and infrastructure inequalities. International Journal of Disaster Risk Reduction, 95: 103894. https://doi.org/10.1016/j.ijdrr.2023.103894
[6] Rajkhowa, S., Sarma, J. (2021). Climate change and flood risk, global climate change. In Global Climate Change, pp. 321-339. https://doi.org/10.1016/B978-0-12-822928-6.00012-5
[7] Qi, W., Ma, C., Xu, H., Chen, Z., Zhao, K., Han, H. (2021). A review on applications of urban flood models in flood mitigation strategies. Natural Hazards, 108: 31-62. https://doi.org/10.1007/s11069-021-04715-8
[8] Nkwunonwo, U.C., Whitworth, M., Baily, B. (2020). A review of the current status of flood modelling for urban flood risk management in the developing countries. Scientific African, 7: e00269. https://doi.org/10.1016/j.sciaf.2020.e00269
[9] Zhang, N., Alipour, A. (2022). Flood risk assessment and application of risk curves for design of mitigation strategies. International Journal of Critical Infrastructure Protection, 36: 100490. https://doi.org/10.1016/j.ijcip.2021.100490
[10] Tunas, I.G., Anwar, N., Lasminto, U. (2019). A synthetic unit hydrograph model based on fractal characteristics of watersheds. International Journal of River Basin Management, 17(4): 465-477. https://doi.org/10.1080/15715124.2018.1505732
[11] Tunas, I.G. (2019). Performance of flood prediction model in tropical river basin, Indonesia: A synthetic unit hydrograph-based evaluation. Disaster Advances, 12(6): 26-37.
[12] Tunas, I.G. (2019). The application of ITS-2 model for flood hydrograph simulation in large-size rainforest watershed, Indonesia. Journal of Ecological Engineering, 20(7): 112-125. https://doi.org/10.12911/22998993/109882
[13] Ramly, S., Tahir, W., Abdullah, J., Jani, J., Ramli, S., Asmat, A. (2020). Flood estimation for SMART control operation using integrated radar rainfall input with the HEC-HMS model. Water Resources Management, 34: 3113-3127. https://doi.org/10.1007/s11269-020-02595-4
[14] Lin, Q., Lin, B., Zhang, D., Wu, J. (2022). Web-based prototype system for flood simulation and forecasting based on the HEC-HMS model. Environmental Modelling & Software, 158: 105541. https://doi.org/10.1016/j.envsoft.2022.105541
[15] Nastiti, K.D., Kim, K., Junga, K., Anb, H. (2015). The application of rainfall-runoff-inundation (RRI) model for inundation case in Upper Citarum Watershed, West Java-Indonesia. Procedia Engineering, 125: 166-172. https://doi.org/10.1016/j.proeng.2015.11.024
[16] Zhang, H., Wu, W., Hu, C., Hu, C., Li, M., Hao, X., Liu, S. (2021). A distributed hydrodynamic model for urban storm flood risk assessment. Journal of Hydrology, 600: 126513. https://doi.org/10.1016/j.jhydrol.2021.126513
[17] Keum, H.J., Seo, J.C., Choo, Y.M. (2022). Evaluation of inundation probability and inundation depth through rainfall–runoff analysis. Water, 14(24): 4076. https://doi.org/10.3390/w14244076
[18] Chu, H., Wu, W., Wang, Q.J., Nathan, R., Wei, J. (2020). An ANN-based emulation modelling framework for flood inundation modelling: Application, challenges and future directions. Environmental Modelling & Software, 124: 104587. https://doi.org/10.1016/j.envsoft.2019.104587
[19] Xie, S., Wu, W., Mooser, S., Wang, Q.J., Nathan, R., Huang, Y. (2021). Artificial neural network based hybrid modeling approach for flood inundation modeling. Journal of Hydrology, 592: 125605. https://doi.org/10.1016/j.jhydrol.2020.125605
[20] Karim, F., Armin, M.A., Ahmedt-Aristizabal, D., Tychsen-Smith, L., Petersson, L. (2023). A review of hydrodynamic and machine learning approaches for flood inundation modeling. Water, 15(3): 566. https://doi.org/10.3390/w15030566
[21] Afshari, S., Tavakoly, A.A., Rajib, M.A., Zheng, X., Follum, M.L., Omranian, O., Fekete, B.M. (2018). Comparison of new generation low-complexity flood inundation mapping tools with a hydrodynamic model. Journal of Hydrology, 556: 539-556. https://doi.org/10.1016/j.jhydrol.2017.11.036
[22] Darabi, H., Choubin, B., Rahmati, O., Haghighi, A.T., Pradhan, B., Kløve, B. (2019). Urban flood risk mapping using the GARP and QUEST Models: A comparative study of machine learning techniques. Journal of Hydrology, 569: 142-154. https://doi.org/10.1016/j.jhydrol.2018.12.002
[23] Tansar, H., Akbar, H., Aslam, R.A. (2021). Flood inundation mapping and hazard assessment for mitigation analysis of local adaptation measures in Upper Ping River Basin, Thailand. Arabian Journal of Geosciences, 14: 2531. https://doi.org/10.1007/s12517-021-08878-3
[24] Beden, N., Keskin, A. (2021). Flood map production and evaluation of flood risks in situations of insufficient flow data. Natural Hazards, 105(3): 2381-2408. https://doi.org/10.1007/s11069-020-04404-y
[25] Chen, Z., Gan, K.K., Zhou, T., Du, Q., Zeng, M. (2022). Using structural equation modeling to examine pathways between environmental characteristics and perceived restorativeness on public rooftop gardens in China. Frontiers in Public Health, 10: 801453. https://doi.org/10.3389/fpubh.2022.801453
[26] Albahri, A.S., Alnoor, A., Zaidan, A.A., Albahri, O.S., et al. (2022). Hybrid artificial neural network and structural equation modelling techniques: A survey. Complex & Intelligent Systems, 8(2): 1781-1801. https://doi.org/10.1007/s40747-021-00503-w
[27] Rachunok, B., Fletcher, S. (2023). Socio-hydrological drought impacts on urban water affordability. Nature Water, 1(1): 83-94. https://doi.org/10.1038/s44221-022-00009-w
[28] Jia, H., Luo, P., Yang, H., Luo, C., Li, H., Cheng, Y., Huang, Y. (2023). Constructing an indices system for evaluating the ecological integrity of forests in western Sichuan, China based on structural equation modeling. Ecological Indicators, 146: 109745. https://doi.org/10.1016/j.ecolind.2022.109745
[29] Faruk, M.O., Maharjan, K.L. (2022). Factors affecting farmers’ adoption of flood adaptation strategies using structural equation modeling. Water, 14(19): 3080. https://doi.org/10.3390/w14193080
[30] Nugraheni, I.L., Suyatna, A., Setiawan, A. (2022). Flood disaster mitigation modeling through participation community based on the land conversion and disaster resilience. Heliyon, 8(8): e09889. https://doi.org/10.1016/j.heliyon.2022.e09889
[31] Ejeta, L.T., Ardalan, A., Paton, D., Yaseri, M. (2018). Emotional and cognitive factors influencing flood preparedness in Dire Dawa town, Ethiopia. Natural Hazards, 93: 715-737. https://doi.org/10.1007/s11069-018-3321-0
[32] Fatemi, M.N., Okyere, S.A., Diko, S.K., Abunyewah, M., Kita, M., Rahman, T. (2021). Flooding in mega-cities: using structural equation modelling to assess flood impact in Dhaka. International Journal of Disaster Resilience in the Built Environment, 12(5): 500-514. https://doi.org/10.1108/IJDRBE-08-2020-0094
[33] Kurata, Y.B., Ong, A.K.S., Ang, R.Y.B., Angeles, J.K.F., Bornilla, B.D.C., Fabia, J.L.P. (2023). Factors affecting flood disaster preparedness and mitigation in flood-prone areas in the Philippines: An integration of protection motivation theory and theory of planned behavior. Sustainability, 15(8): 6657. https://doi.org/10.3390/su15086657
[34] Santoro, S., Lovreglio, R., Totaro, V., Camarda, D., Iacobellis, V., Fratino, U. (2023). Community risk perception for flood management: A structural equation modelling approach. International Journal of Disaster Risk Reduction, 97: 104012. https://doi.org/10.1016/j.ijdrr.2023.104012
[35] de Arruda Gomes, M.M., de Melo Verçosa, L.F., Cirilo, J.A. (2021). Hydrologic models coupled with 2D hydrodynamic model for high-resolution urban flood simulation. Natural Hazards, 108(3): 3121-3157. https://doi.org/10.1007/s11069-021-04817-3
[36] Shaikh, A.A., Pathan, A.I., Waikhom, S.I., Agnihotri, P.G., Islam, M.N., Singh, S.K. (2023). Application of latest HEC-RAS version 6 for 2D hydrodynamic modeling through GIS framework: A case study from coastal urban floodplain in India. Modeling Earth Systems and Environment, 9(1): 1369-1385. https://doi.org/10.1007/s40808-022-01567-4
[37] Wang, P., Li, Y., Zhang, Y. (2021). An urban system perspective on urban flood resilience using SEM: Evidence from Nanjing city, China. Natural Hazards, 109: 2575-2599. https://doi.org/10.1007/s11069-021-04933-0
[38] Mardani, A., Kannan, D., Hooker, R.E., Ozkul, S., Alrasheedi, M., Tirkolaee, E.B. (2020). Evaluation of green and sustainable supply chain management using structural equation modelling: A systematic review of the state of the art literature and recommendations for future research. Journal of Cleaner Production, 249: 119383. https://doi.org/10.1016/j.jclepro.2019.119383
[39] Chatterjee, S., Bhattacharjee, K.K. (2020). Adoption of artificial intelligence in higher education: A quantitative analysis using structural equation modelling. Education and Information Technologies, 25: 3443-3463. https://doi.org/10.1007/s10639-020-10159-7
[40] Lu, Y., Liu, J., Yu, W. (2024). Social risk analysis for mega construction projects based on structural equation model and Bayesian network: A risk evolution perspective. Engineering, Construction and Architectural Management, 31(7): 2604-2629. https://doi.org/10.1108/ECAM-04-2022-0319
[41] Molwus, J.J., Erdogan, B., Ogunlana, S.O. (2013). Sample size and model fit indices for structural equation modelling (SEM): The case of construction management research. In Construction and Operation in the Context of Sustainability, pp. 338-347. https://doi.org/10.1061/9780784413135.032
[42] Aerts, J.C., Botzen, W.J., Clarke, K.C., Cutter, S.L., et al. (2018). Integrating human behaviour dynamics into flood disaster risk assessment. Nature Climate Change, 8(3): 193-199. https://doi.org/10.1038/s41558-018-0085-1
[43] Iaousse, M., Hmimou, A., El Hadri, Z., El Kettani, Y. (2020). A modified algorithm for the computation of the covariance matrix implied by a structural recursive model with latent variables using the finite iterative method. Statistics, Optimization & Information Computing, 8(2): 359-373. https://doi.org/10.19139/soic-2310-5070-937