Do Van Nang![]()
© 2024 The author. This article is published by IIETA and is licensed under the CC BY 4.0 license (http://creativecommons.org/licenses/by/4.0/).
OPEN ACCESS
The gripper mechanism is widely utilized in industry and life. The request for displacement amplifier ratio for this mechanism is high. However, the first modal shape frequency is also required high. Therefore, in this investigation, a novel model of gripper mechanism was designed optimum by employing an artificial neural network (ANN) model. The bridge-type compliant mechanism was applied in the new model mechanism which was drawn by SolidWorks. The first modal shape frequency was determined by finite element analysis (FEA) in ANSYS. The simulated data was used for the analysis of the signal-to-noise, and analysis of variance. The results of the analysis are good and agreed that the design variables have significantly affected on the first modal shape frequency. The statistical analysis outcomes indicated that all the error values are less than 1. The R-square values of training and testing results of ANN model obtained 0.9999 and 1, respectively. The predicted value and the optimal value of the first modal shape frequency obtained 404.6784 Hz and 390.72 Hz, respectively. The deviation of the values is 3.45%.
gripper mechanism, bridge-type mechanism, artificial neural network, first modal shape frequency
The gripper was designed with a simple structure when using the flexure joint. Many the gripper-compliant mechanisms are designed and manufactured with flexure joint to eliminate the effects of clearance size, friction in the traditional joint [1, 2]. The micro-gripper compliant mechanism employing the bridge-type amplifier (BTA) to choose the optimal solution, many experiments or simulations must be performed. This will take a long time. Taguchi method is a method that helps choose the optimal method without performing too many experiments or simulations. However, this method only optimizes a single objective. For multi-objective optimization problems, the grey relational analysis should be used to select the optimal case. And the artificial neural network was also utilized to confirm the optimal result. The artificial neural network based on grey relational analysis was utilized to determine this MRD of the BTA [8, 9]. The result obtained displacement amplification ratio to 95 times. The experiment result verified that the outcomes of FEA and Taguchi method based on the artificial neural network achieved magnification ratio of BTA over 65 times [10]. Taguchi method based grey relational analysis was applied to estimate the optimal value of the MRD of tesural displacement compliant mechanism [11]. The L-shape and half bridge-type were applied for a new design of XYZ mircro/nano positioner [12]. The mechanism can work with scope 128.1 μm×131.3 μm×17.9 μm at a high resolution of 8 nm. The effects of variables design on the displacement amplification ratio (DAR) of the two degree of freedom moving platform using BTA were confirmed by Taguchi method (TM) [13]. The outcomes of FEA pointed out that the design variables (DV) have influenced on the first modal shape frequency (FMSF) of the tensure displacement amplifier using flexure hinge. The results were also verified by TM [14] or analysis of signal to noise result. The TM based on GRA predicted displacement amplification ratio of BTA over 63 times. And the method confirmed that the selection design variables are very important cannot ignore when designs compliant mechanisms [15]. The DAR was determined based on the model of full flexure [16]. The Z shape flexible joint was applied for two DOF moving plate form based on three DOF XYZ [17]. The planar compliant parrallelogram mechanism was designed by 8 compliant flexure beams to create a tesural and compresural characteristic [18]. The model for experiment verified the nonliear FEA manufactured. The stic-slip actuator employing rhom-bus type was designed and manufactured based on the theory analysis and FEA for coupling ratio and natural frequency [19]. The result of velocity of forward and backward motion obtained 428.5 μm and 443.2 μm. Two port dynamic stiffness model was used to ameliorate frequency of the BTA and obtained 120 Hz with pressure of 30 bar [20]. The serial parallel dual stage amplifier using BTA, z-shape motion steering mechanism and decoupled mechanism were applied for ultra-compact decoupled XYZθ stage. The displacement amplification, stress and the first modal shape frequency were determined by theory analysis and FEA. The studying model is also fabricated for testing to verify the theory analysis and results and the FEA results [21]. The differential displacement reducer using BTA was designed by a kinetostatic model and FEA. The studying model was fabricated for experiment to confirm the results of a kinetostatic model and FEA [22]. In order to increase the DAR, reduces stress and increases the modal shape frequency for micro grasping system, the BTA using circular axis leaf type flexure hinge was designed by FEA and deflection model [23]. The XY stage was designed based on BTA. The DAR, stress and the modal shape frequency were determined by the stiffness matrix transfer method and was confirmed by FEA. The studying model was fabricated for experiment. All results are good agree [24]. The synthesizing type combined semi BTA in the amplifier piezoelectric actuators. The traditional transfer matrix method was applied to analyzed kinetostatic and dynamics of the studying model [25]. The closed form compliance equation was applied for designing elliptic revolute notch type multiple axis flexure hinge. The FEA was utilized to verify the proposed method [26]. The nonlinear characteristic of BTA was analyzed by nonlinear closed form equation and was confirmed by FEA and experiment [27]. The two DOF millimeter range monolithic flexure mechanism was designed based the pseudo static model [28]. The outcomes of the proposed model were verified by FEA and experiment. The nonlinear analytical model and the beam constrain model were applied to compute and design the rhombus-type amplifier. The FEA and the experiment are also used to verify the results of two model [29]. The leaf flexure hinge, V- flexure hinge and support beam were combined in the BTA. The kinestostatic model based on compliance matrix method and the dynamics model based on Lagrange method were utilized to determine DAR [30]. The model is also fabricated for testing to verify the outcomes of two model and the results of the FEA.
In the previous study, the methodology, the FEA and the experiments were applied. However, the natural frequency results did not reach expectations and the error was relatively large. In addition, previous studies also have experiments to confirm algorithm and simulation results. Reliable results but high cost. Therefore, in this investigation utilized the FEA in ANSYS to determine the FMSF of the gripper mechanism flexure hinge based on two BTAs. Because, the advances of the BTA are high DAR, high frequency, high load capacity. The FEA is also identified that the DV have influenced significantly on the FMSF. In order to verify this problem, Taguchi method and an artificial neural network model was utilized. In the remainder of this work consists of the section following as: design a new model of gripper mechanism and the model of finite element analysis in ANSYS were presented in section 2. The section 3 presented an artificial neural network. The results and discussions were shown in section 4. The section 5 presented the conclusions.
2.1 A new model of gripper mechanism
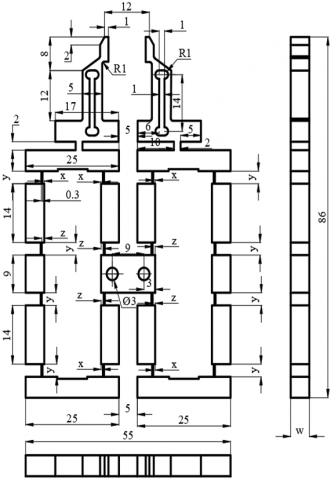
The studying model using flexure hinge as depicted in Figure 1 is the 2-dimension sketch of the gripper mechanism amplifier flexure hinge (GMAFH). The GMAFH based on the combination of two the BTA using flexure hinge. The dimension of the model is 55 mm×86 mm×8 mm. The dimension of GMAFH and design variables were illustrated in Figure 1. In this study, the design variables consist of the horizontal distance 1 (0.6 mm ≤ x ≤ 0.8 mm), vertical distance (4 ≤ y ≤ 6), horizontal distance 2 (0.9 mm ≤ z ≤ 1.3 mm), width of the model (6 ≤ w ≤ 10). The material was used for this model is aluminum with young modulus of 71 Gpa, density of 2810 kg/m3, and Poisson’s ratio 0.33. the level of the design variables was selected as following: variable (x) has level 1 of 0.6 mm, level 2 of 0.7 mm, and level 3 of 0.8 mm; variable (y) has level 1 of 4 mm, level 2 of 5 mm, and level 3 of 6 mm; variable (z) has level 1 of 0.9 mm, level 2 of 1.1 m, and level 3 of 1.3 mm; variable (w) has level 1 of 6 mm, level 2 of 8 mm, and level 3 of 10 mm.
Figure 1. Gripper mechanism
2.2 Finite element analysis
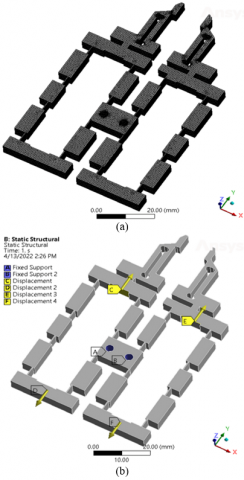
The 3D FEA was built as pointed out in Figure 2. Figure 2 (a) presents the GMAFH model, which was divided meshing by the automatic method with element size 0.5 mm. The divided meshing result obtained 69399 elements and 332493 nodes. The boundary condition was set up for the GMAFH model as presented in Figure 2 (b). First step, fixed support was set up at A surface with 2 holes. Next step, input displacement 1 and input displacement 2 with 0 mm were set up for B and C surface, input displacement 3 and input displacement 4 with 0 mm were set up for D and E surface. And the final step determined output of the modals shape frequency. In the modals shape frequency, the investigation selected the first modal shape frequency to maximum this frequency by the model of an artificial neural network.
Figure 2. (a) Divide meshing of the gripper model; (b) input boundary condition for the GMAFH model
3.1 Taguchi method
In this model of an artificial neural network based on Taguchi method, 27 values of the first modal shape frequency were training and testing to predicted high first frequency with error is approximately zero. And this model is also verified the results of FEA that the DV have significantly influenced on the FMSF. The analysis of signal to noise (S/N) [19, 31-36] was carried out as following:
$S / N=-10 \log \left(\frac{1}{n} \sum_{i=1}^n \frac{1}{y_i^2}\right)$ (1)
3.2 Artificial neural network (ANN)
The model ANN consists of four neurons (horizontal distance (x), vertical distance (y), horizontal (z), width of the GMAFH(w)) in one input layer and one neuron (the first modal shape frequency) in output layer. The data as listed in Table 1, was used in the precision model is assessed by four error standards as following [37-39]:
Statistical analysis:
Root mean squared error (RMSE) is the difference between values forecast of the model and the simulation values or observed actual values.
$R M S E=\sqrt{\frac{1}{m} \sum_{i=1}^m\left(x_i-y_i\right)^2}$ (2)
Mean square error (MSE) is the square value of the root mean square.
$M S E=\frac{1}{m} \sum_{i=1}^m\left(x_i-y_i\right)^2$ (3)
Mean absolute percentage error (MAPE).
$M A P E=\frac{100 \%}{m} \sum_{i=1}^m\left|\frac{x_i-y_i}{x_i}\right|$ (4)
Coefficient of determination (R2) is at least of 0.8, forecast models are accepted.
$R^2=1-\frac{\sum_{i=1}^m\left(x_i-y_i\right)^2}{\sum_{i=1}^m\left(x_i-\bar{y}\right)^2}$ (5)
where, m is number of simulations of experiment, xi and yi present the simulation and predicting value respectively, $\bar{y}$ is the mean simulation value.
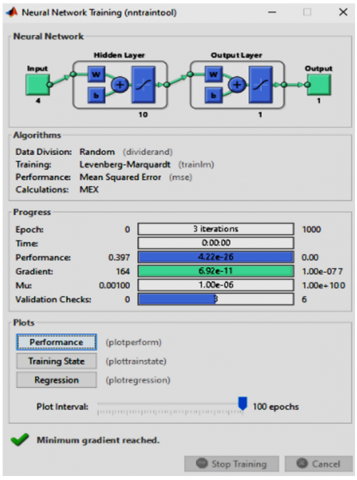
Figure 3. ANN model for training and testing
The data in Table 1 was used for training. Nine case was used for testing. In this work, the network is linear transfer function, ten hidden layers, one output layer as shown in Figure 3. The data division was selected random (dividerand), The training was Levenberg-Marquardt (trainlm), the performance is Mean square error (MSE), calculation is Mex. The network type was used in this study is feed forward backprop.
4.1 Set up simulation
In order to forecast the first modal shape frequency, first step need to select design variables and their level. In this work, the DV were selected as listed in Table 2. In this Table, the DV are horizontal distance (x), vertical distance (y), horizontal distance (z) and width of the model. The dimensions of the studying model were presented in section 2.1. The orthogonal array was designed by Minitab software with L27, 4 design variables and every variable has three levels which is selected at random. The simulation values and the predicted values of the first modal shape frequency as written in FEA column and ANN model column of Table 1. If 27 different cases obtained the same simulation results. This proved that the design variables do not affect the influence the first modal shape frequency. However, in this simulation result, 27 cases received different values. The problem demonstrated that the DV have significantly affected on the first modal shape frequency. Therefore, while designed the studying model, the selection these dimension of the variables is not skip. The results of FEA, the outcomes of ANN model, error of two model and the percentage error were also listed in Table 3.
Table 1. The orthogonal array, the results of FEA and the predicted outcomes of Fre
|
Trial No. |
x |
y |
z |
w |
FEA Model |
ANN Model |
Error |
% Error |
|
1 |
0.6 |
4 |
0.9 |
6 |
252.84118 |
252.0539 |
0.7873 |
0.3173 |
|
2 |
0.6 |
4 |
1.1 |
8 |
379.45882 |
379.8879 |
-0.4291 |
-0.1130 |
|
3 |
0.6 |
4 |
1.3 |
10 |
451.52353 |
451.6009 |
-0.0774 |
-0.0171 |
|
4 |
0.7 |
5 |
0.9 |
6 |
195.34118 |
195.8066 |
-0.4654 |
-0.2382 |
|
5 |
0.7 |
5 |
1.1 |
8 |
292.18824 |
292.9754 |
-0.7871 |
-0.2694 |
|
6 |
0.7 |
5 |
1.3 |
10 |
372.98235 |
372.1776 |
0.8048 |
0.2158 |
|
7 |
0.8 |
6 |
0.9 |
6 |
182.28235 |
182.3249 |
-0.0425 |
-0.0233 |
|
8 |
0.8 |
6 |
1.1 |
8 |
291.72941 |
291.5055 |
0.2239 |
0.0768 |
|
9 |
0.8 |
6 |
1.3 |
10 |
395.64706 |
395.6336 |
0.0135 |
0.0034 |
|
10 |
0.7 |
6 |
0.9 |
8 |
203.65294 |
203.0916 |
0.5613 |
0.2756 |
|
11 |
0.7 |
6 |
1.1 |
10 |
317.74118 |
317.8066 |
-0.0654 |
-0.0206 |
|
12 |
0.7 |
6 |
1.3 |
6 |
383.70588 |
383.6093 |
0.0966 |
0.0252 |
|
13 |
0.8 |
4 |
0.9 |
8 |
163.77647 |
163.3399 |
0.4366 |
0.2666 |
|
14 |
0.8 |
4 |
1.1 |
10 |
275.54706 |
275.0965 |
0.4506 |
0.1635 |
|
15 |
0.8 |
4 |
1.3 |
6 |
327.07647 |
327.4979 |
-0.4214 |
-0.1289 |
|
16 |
0.6 |
5 |
0.9 |
8 |
244.31176 |
244.8128 |
-0.5010 |
-0.2051 |
|
17 |
0.6 |
5 |
1.1 |
10 |
345.08235 |
345.8896 |
-0.8073 |
-0.2339 |
|
18 |
0.6 |
5 |
1.3 |
6 |
382.19412 |
382.9201 |
-0.7259 |
-0.1899 |
|
19 |
0.8 |
5 |
0.9 |
10 |
280.89412 |
280.6773 |
0.2168 |
0.0772 |
|
20 |
0.8 |
5 |
1.1 |
6 |
179.81765 |
179.8751 |
-0.0575 |
-0.0319 |
|
21 |
0.8 |
5 |
1.3 |
8 |
306.27647 |
306.2626 |
0.0138 |
0.0045 |
|
22 |
0.6 |
6 |
0.9 |
10 |
250.06471 |
250.1969 |
-0.1322 |
-0.0528 |
|
23 |
0.6 |
6 |
1.1 |
6 |
244.10000 |
244.6882 |
-0.588 |
-0.2409 |
|
24 |
0.6 |
6 |
1.3 |
8 |
371.96471 |
371.8062 |
0.1585 |
0.04261 |
|
25 |
0.7 |
4 |
0.9 |
10 |
276.26471 |
276.6087 |
-0.3439 |
-0.1245 |
|
26 |
0.7 |
4 |
1.1 |
6 |
270.43529 |
270.1796 |
0.2557 |
0.09455 |
|
27 |
0.7 |
4 |
1.3 |
8 |
302.19412 |
302.8612 |
-0.6671 |
-0.2207 |
Table 2. Design variables of their level
|
Factor |
|
Unit |
Levels |
||
|
1 |
2 |
3 |
|||
|
Horizontal distance |
x |
mm |
0.6 |
0.7 |
0.8 |
|
Vertical distance |
y |
mm |
4 |
5 |
6 |
|
Horizontal distance |
z |
mm |
0.9 |
1.1 |
1.3 |
|
Width of model |
w |
mm |
6 |
8 |
10 |
4.2 Results of signal to noise analysis
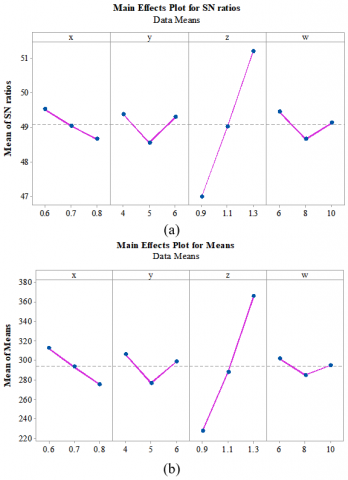
Not only the results of analysis of signal to noise (S/N) and analysis of means verified that the design variables have significantly on the FMSF, but also the models of analysis pointed out that which the variables affect more and which the variables affect less. As the results of analysis of S/N and the outcomes of analysis of means were outlined in Table 3 were carried out by Minitab software. Whereby, the variable of horizontal distance (z) has the greatest influence on the first modal shape frequency, next to is the variable of horizontal (x), next to is the variable of vertical distance (y) and the finally is the variable of width of the model (w). The graph of analysis of signal to noise and the graph of analysis of means as pointed out in Figure 4 were drawn by the data of Table 3. Because the larger Delta value proved that the design variable strongly impacted on the value domain of the first modal shape frequency. The graph was plotted from the values in Table 3. The greater the slope of the graph relative to horizontal, the more the design variable effects on the frequency. The larger the slope, the larger the value range of the output, or in other words, the value range of the first natural frequency form. This problem shown that the design variables have caused this value domain of the first modal shape frequency to increase significantly.
Table 3. Mean of signal to noise ratios and the values of mean of the first modal shape frequency
|
Mean of Signal to Noise Ratios |
||||
|
Level |
x |
y |
z |
w |
|
1 |
49.53 |
49.38 |
47.01 |
49.45 |
|
2 |
49.05 |
48.56 |
49.03 |
48.66 |
|
3 |
48.67 |
49.30 |
51.20 |
49.13 |
|
Delta |
0.86 |
0.82 |
4.20 |
0.78 |
|
Rank |
2 |
3 |
1 |
4 |
|
The Values of Mean of the First Modal Shape Frequency |
||||
|
Level |
x |
y |
z |
w |
|
1 |
312.7 |
306.2 |
227.7 |
301.9 |
|
2 |
293.7 |
277.0 |
288.5 |
285.1 |
|
3 |
275.8 |
298.9 |
366.0 |
295.1 |
|
Delta |
36.9 |
29.2 |
138.2 |
16.7 |
|
Rank |
2 |
3 |
1 |
4 |
Figure 4. (a) Analysis of S/N; (b) Analysis of means
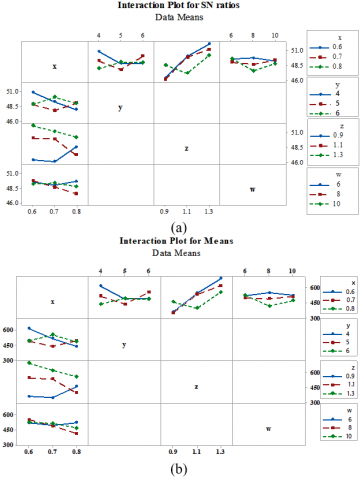
Figure 5. (a) Analysis of the interaction of S/N; (b) Analysis of interaction of means
4.3 Results of interaction analysis
In addition, the results of the interaction analysis also indicated that the DV have influenced significantly on the FMSF as plotted in Figure 5. The proof is the lines in the graph of the interaction of signal to noise and the graph of interaction of means are in paralleled. The results are good agree with the outcomes of FEA and the results of analysis of S/N and the results of analysis of means.
4.4 Results of analysis of variance
Another evidence also identified that the design variables have an important influence on the first modal shape frequency as described in Table 4. That is the results of analysis of variance. It is expressed through the P and F test theories (P value and F value). According to this testing theory, P values must be less than 0.05. F values must be greater than 2. These problems are satisfied. And the percentage contribution of the design variables indicated the degree of influence of the variables namely variable (x) of 4.21%, variable (y) of 2.86%, variable (z) is 59.42%, variable (w) is 0.88%, the (x*y) is 10.77%, the (x*z) is 17.84%, the (x*w) is 3.88% and the rest is the percentage of error of 0.14%. By the percentage contribution, the variable of horizontal distance (z) has the greatest influence on the first modal shape frequency, next to is the variable of horizontal (x), next to is the variable of vertical distance (y) and the finally is the variable of width of the model (w). The results are good agree with the results sated above. Since the error is 0.14%, the obtained R-square is 99.86%, R-square (adj) is 99,40%, R-square (pred) is 97.2%, the S value is 5.78941 and the press value is 4072.34 as listed in Table 5. According to the analysis of variance results table, the total percentage contribution of design variables is 66.49%. And the total interaction percentage of design variables that contribute to influencing the first modal shape frequency is 32.49%. Thanks to this interaction and the influence of design variables, the error of the variance analysis result is 0.14%. The interaction effect between design variables is significant as also confirmed in section 4.3.
4.5 Results of ANN model
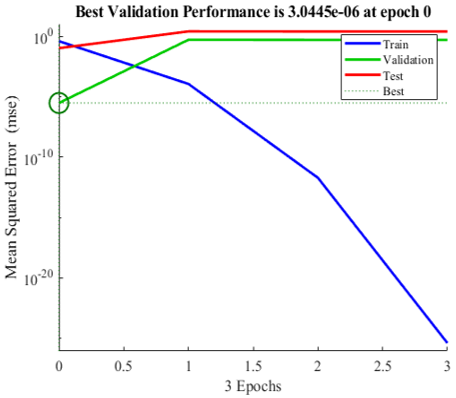
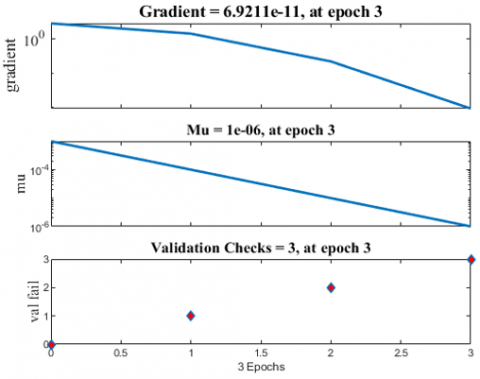
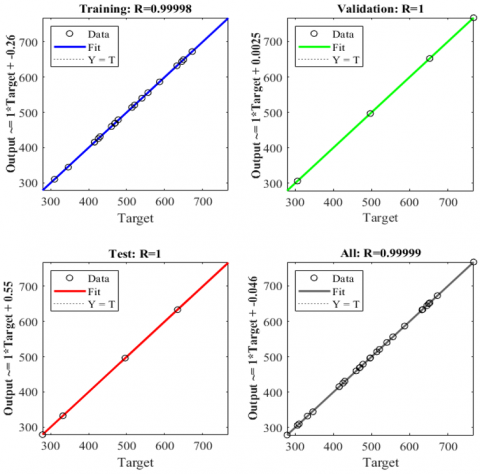
Figure 6 demonstrated the training result of the ANN model. Whereby, the best validation obtained at epoch 0 with 3.0445×10⁻⁶. The gradient value obtained 6.9211×10⁻¹¹ at epoch 3, the Mu value obtained 10-6 at epoch 3, the validation checks obtained at epoch 3 as demonstrated in Figure 7. The R values for training, test, validation are 0.9998, 1 and 1, respectively. And the final obtained the R value is 0.9999 as presented in Figure 8. The predicted values lie very close the straight line as shown in Figure 8. These results are completely consistent because they are similar to the results of published studies [4-6, 13, 16].
Table 4. The outcomes of analysis of variance
|
Source |
DF |
Seq SS |
Contribution |
Adj SS |
Seq MS |
F-Value |
P-Value |
|
x |
2 |
6125 |
4.21% |
6124.7 |
3062.3 |
91.37 |
0.000 |
|
y |
2 |
4158 |
2.86% |
4158.3 |
2079.2 |
62.03 |
0.000 |
|
z |
2 |
86414 |
59.42% |
86414.0 |
43207.0 |
1289.10 |
0.000 |
|
w |
2 |
1273 |
0.88% |
1273.2 |
636.6 |
18.99 |
0.003 |
|
x*y |
4 |
15665 |
10.77% |
15665.4 |
3916.3 |
116.85 |
0.000 |
|
x*z |
4 |
25948 |
17.84% |
25948.1 |
6487.0 |
193.54 |
0.000 |
|
x*w |
4 |
5638 |
3.88% |
5637.7 |
1409.4 |
42.05 |
0.000 |
|
Error |
6 |
201 |
0.14% |
201.1 |
33.5 |
||
|
Total |
26 |
145423 |
100.00% |
Figure 6. The performance of training of the ANN model
Figure 7. The status of the training of the ANN model
Figure 8. The results of training of the ANN model
Table 5. Model summary
|
S |
R-sq |
R-sq (adj) |
PRESS |
R-sq (pred) |
|
5.78941 |
99.86% |
99.40% |
4072.34 |
97.20% |
Table 6. The testing results
|
Trial No. |
X |
y |
z |
w |
Simulation Value |
Predicted Value |
|
1 |
0.6 |
4 |
0.9 |
6 |
252.8412 |
252.7358 |
|
2 |
0.6 |
4 |
1.1 |
8 |
379.4588 |
379.2146 |
|
3 |
0.6 |
4 |
1.3 |
10 |
451.5235 |
451.6065 |
|
4 |
0.7 |
6 |
0.9 |
8 |
203.6529 |
203.7848 |
|
5 |
0.7 |
6 |
1.1 |
10 |
317.7412 |
317.9616 |
|
6 |
0.7 |
6 |
1.3 |
6 |
383.7059 |
383.7193 |
|
7 |
0.8 |
5 |
0.9 |
10 |
280.8941 |
280.2328 |
|
8 |
0.8 |
5 |
1.1 |
6 |
179.8176 |
179.7769 |
|
9 |
0.8 |
5 |
1.3 |
8 |
306.2765 |
306.1667 |
Table 7. The outcomes of statistical analysis
|
RMSE |
MSE |
MAPE (%) |
R-Square |
|
|
Training |
0.4612 |
0.2127 |
0.1358 |
0.9999 |
|
Testing |
0.2571 |
0.0661 |
0.0206 |
1.0000 |
The results after testing as presented in the predicted values column of Table 6. From Table 6, it indicates that the deviation between the simulation values and the predicted values is very low. The problem pointed out that the testing results are very reliable. The results of statistical analysis obtained as listed in Table 7. The training results obtained RMSE value of 0.4612, MSE value of 0.2127, MAPE value of 0.1358% and R-square value of 0.9999. The testing results obtained RMSE value of 0.2571, MSE value of 0.0661, MAPE value of 0.0206% and R-square value of 1.
The predicted value of the first modal shape frequency at the optimal levels of the combination variables obtain from Eq. (6) as following:
$\mu_{ {Fre }}= Fre _m+\sum_{i=1}^q\left(\right. Fre _{0 i}- Fre \left._m\right)=x 1+y 1+z 3+t 1-3 Fre _m$ (6)
where, the values x1, y1, z3, t1 obtained 312.7 Hz, 306.2 Hz, 366.0 Hz and 301.9 Hz, respectively from Table 3 (mean values of the first modal shape frequency.
$\mu_{F r e}=312.7+306.2+366.0+301.9-3 * 294.0405=404.6784 ~Hz$
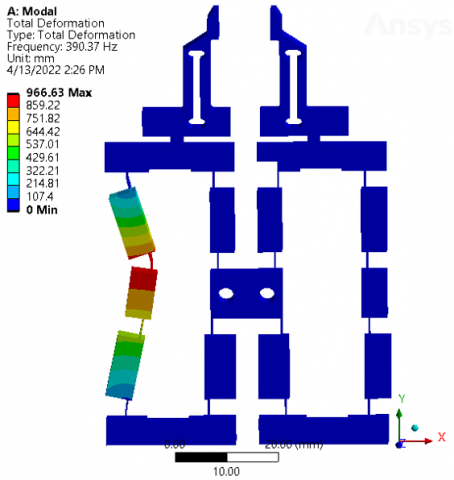
The predicted value of the first frequency obtained 404.6784 Hz while optimal value of the first frequency obtained 390.72 as presented in Figure 9. So the error percentage between the predicted value and optimal value of the first frequency is 3.45%. The error percentage is obtained by the forecast value subtracts the optimal value, dividing the forecast value and finally multiplying by 100% as presented in Eq. (7). This result is higher the previous results of analysis [4-6, 13, 16].
Figure 9. The optimal outcome of the first modal shape frequency
$\% error =\frac{ the \,predicted \,value \,of \,frequency - {the \,optimal \,value \,of \,frequency }}{{ the \,predicted \,value \,of \,frequency }} .100 \%$ (7)
At α=0.05, fe=6, F0.05(1,16)=5.9874, Ve=35.5, R=21, Re=1, n=27.
$C I_{C E}= \pm \sqrt{5.9874 \times 35.5 \times\left(\frac{1}{\frac{27}{1+22}}+1\right)}= \pm 19.8376$
$384.8387<\mu_{{confirmation }}<424.5182$
In this work, the finite element model was built and analyzed by ANSYS. Although the design variables and their levels are chosen randomly. But the outcomes of the FEA proved that the design variables are very important and cannot be ignored in the design process mechanical system. Because, the first modal shape frequency is significantly affected by the DV. The ANN model is also established for predicting the FMSF. The percentage error of ANN model and FEA model is less than 0.4%. The analysis of S/N model, the analysis of mean model, the interaction analysis model and analysis of variance model were established to analyze and verify the FEA model and ANN model. All the results of the models are analyzed, discussed and compared with published works. The outcomes of all of model are good agree. The predicted value of the FMSF of ANN model is 404.6784 MPa and while the optimal value of the FMSF is 390.76 MPa. The error between the predicted value and optimal value of the FMSF is less than 4%. The implications of this error rate in practical applications are very reliable. Because the results of statistical analysis pointed out that the values of training and testing of RMSE, MSE and is less than 1. The MAPE values is less than 1%.
The author wants to send Acknowledgments to Industrial University of Ho Chi Minh City.
The article was funded by the Industrial University of Ho Chi Minh City.
[1] Erkaya, S., Doğan, S., Ulus, Ş. (2015). Effects of joint clearance on the dynamics of a partly compliant mechanism: Numerical and experimental studies. Mechanism and Machine Theory, 88: 125-140. https://doi.org/10.1016/j.mechmachtheory.2015.02.007
[2] Erkaya, S. (2018). Experimental investigation of flexible connection and clearance joint effects on the vibration responses of mechanisms. Mechanism and Machine Theory, 121: 515-529. https://doi.org/10.1016/j.mechmachtheory.2017.11.014
[3] Zhang, Y., Yan, P. (2022). A large range constant force microgripper with a three-stage compliant amplification mechanism. IEEE Access, 10: 58225-58232. https://doi.org/10.1109/ACCESS.2022.3179588
[4] Wang, C.N., Le, T.D.M. (2022). Optimization parameter for microgripper based on triple-stair compliant mechanism using GTs-TOPSIS. The International Journal of Advanced Manufacturing Technology, 120(11): 7967-7983. https://doi.org/10.1007/s00170-022-09250-9
[5] Nguyen, T.V., Huynh, N.T., Vu, N.C., Kieu, V.N., Huang, S.C. (2021). Optimizing compliant gripper mechanism design by employing an effective bi-algorithm: Fuzzy logic and ANFIS. Microsystem Technologies, 27(9): 3389-3412. https://doi.org/10.1007/s00542-020-05132-w
[6] Chen, W., Kong, C., Lu, Q., Liang, Y., Luo, L., Wei, H. (2022). Nonlinear analysis, optimization, and testing of the bridge-type compliant displacement amplification mechanism with a single input force for microgrippers. Precision Engineering, 73: 166-182. https://doi.org/10.1016/j.precisioneng.2021.09.001
[7] Tran, Q.P., Huynh, N.T., Huang, S.C. (2021). Artificial neural network base on grey relational analysis estimate displacement of bridge-type amplifier. IOP Conference Series: Materials Science and Engineering, 1113(1): 012007. https://doi.org/10.1088/1757-899x/1113/1/012007
[8] Thai, H.N., Manh, N.Q. (2021). Application of grey relational approach and artificial neural network to optimise design parameters of bridge-type compliant mechanism flexure hinge. International Journal of Automotive and Mechanical Engineering, 18(1): 8505-8522. https://doi.org/10.15282/ijame.18.1.2021.10.0645
[9] Wang, C.N., Yang, F.C., Nguyen, V.T.T., Nguyen, Q.M., Huynh, N.T., Huynh, T.T. (2021). Optimal design for compliant mechanism flexure hinges: Bridge-type. Micromachines, 12(11): 1304. https://doi.org/10.3390/mi12111304
[10] Huynh, N.T., Nguyen, Q.M., Vo, L.K.T. (2021). Computed methodology for design and optimization on parameters of a tensural displacement amplifier employing flexible hinges. Journal of Mechanical Engineering Research and Developments, 44(10): 66-79.
[11] Tian, Y., Ma, Y., Wang, F., Lu, K., Zhang, D. (2020). A novel XYZ micro/nano positioner with an amplifier based on L-shape levers and half-bridge structure. Sensors and Actuators A: Physical, 302: 111777. https://doi.org/10.1016/j.sna.2019.111777
[12] Wang, C.N., Truong, K.P., Huynh, N.T., Nguyen, H. (2019). Optimization on effects of design parameter on displacement amplification ratio of 2 DOF working platform employing Bridge-type compliant mechanism flexure hinge using Taguchi method. Journal of Physics: Conference Series, 1303(1): 012053. https://doi.org/10.1088/1742-6596/1303/1/012053
[13] Vu, N.C., Huynh, N.T., Huang, S.C. (2019). Optimization the first frequency modal shape of a tensural displacement amplifier employing flexure hinge by using Taguchi Method. Journal of Physics: Conference Series, 1303(1): 012016. https://doi.org/10.1088/1742-6596/1303/1/012016
[14] Huynh, N.T., Huang, S.C., Dao, T.P. (2021). Optimal displacement amplification ratio of bridge-type compliant mechanism flexure hinge using the Taguchi method with grey relational analysis. Microsystem Technologies, 27: 1251-1265. https://doi.org/10.1007/s00542-018-4202-x
[15] Choi, K.B., Lee, J.J., Kim, G.H., Lim, H.J., Kwon, S.G. (2018). Amplification ratio analysis of a bridge-type mechanical amplification mechanism based on a fully compliant model. Mechanism and Machine Theory, 121: 355-372. https://doi.org/10.1016/j.mechmachtheory.2017.11.002
[16] Gan, J., Long, J., Ge, M.F. (2021). Design of a 3DOF XYZ bi-directional motion platform based on Z-shaped flexure hinges. Micromachines, 13(1): 21. https://doi.org/10.3390/mi13010021
[17] Wu, K., Hao, G. (2020). Design and nonlinear modeling of a novel planar compliant parallelogram mechanism with general tensural-compresural beams. Mechanism and Machine Theory, 152: 103950. https://doi.org/10.1016/j.mechmachtheory.2020.103950
[18] Naderpour, H., Rafiean, A.H., Fakharian, P. (2018). Compressive strength prediction of environmentally friendly concrete using artificial neural networks. Journal of Building Engineering, 16: 213-219. https://doi.org/10.1016/j.jobe.2018.01.007
[19] Ling, M., Wang, J., Wu, M., Cao, L., Fu, B. (2021). Design and modeling of an improved bridge-type compliant mechanism with its application for hydraulic piezo-valves. Sensors and Actuators A: Physical, 324: 112687. https://doi.org/10.1016/j.sna.2021.112687
[20] Das, B., Roy, S., Rai, R.N., Saha, S.C. (2016). Application of grey fuzzy logic for the optimization of CNC milling parameters for Al–4.5% Cu–TiC MMCs with multi-performance characteristics. Engineering Science and Technology, 19(2): 857-865. https://doi.org/10.1016/j.jestch.2015.12.002
[21] Dewangan, S., Gangopadhyay, S., Biswas, C.K. (2015). Multi-response optimization of surface integrity characteristics of EDM process using grey-fuzzy logic-based hybrid approach. Engineering Science and Technology, an International Journal, 18(3): 361-368. https://doi.org/10.1016/j.jestch.2015.01.009
[22] Shunmugesh, K., Akhil, K.T., Aravind, S., Pramodkumar, M. (2017). Optimization of drilling characteristics using grey-fuzzy logic in glass fiber reinforced polymer (GFRP). Materials Today: Proceedings, 4(8): 8938-8947. https://doi.org/10.1016/j.matpr.2017.07.245
[23] Das, D.K., Sahoo, A.K., Das, R., Routara, B.C. (2014). Investigations on hard turning using coated carbide insert: Grey based Taguchi and regression methodology. Procedia Materials Science, 6: 1351-1358. https://doi.org/10.1016/j.mspro.2014.07.114
[24] Ling, M., Yuan, L., Luo, Z., Huang, T., Zhang, X. (2022). Enhancing dynamic bandwidth of amplified piezoelectric actuators by a hybrid lever and bridge-type compliant mechanism. Actuators, 11(5): 134. https://doi.org/10.3390/act11050134
[25] Wei, H., Shirinzadeh, B., Tang, H., Niu, X. (2021). Closed-form compliance equations for elliptic-revolute notch type multiple-axis flexure hinges. Mechanism and Machine Theory, 156: 104154. https://doi.org/10.1016/j.mechmachtheory.2020.104154
[26] Pan, B., Zhao, H., Zhao, C., Zhang, P., Hu, H. (2019). Nonlinear characteristics of compliant bridge-type displacement amplification mechanisms. Precision Engineering, 60: 246-256. https://doi.org/10.1016/j.precisioneng.2019.08.012
[27] Ling, M., Cao, J., Jiang, Z., Zeng, M., Li, Q. (2019). Optimal design of a piezo-actuated 2-DOF millimeter-range monolithic flexure mechanism with a pseudo-static model. Mechanical Systems and Signal Processing, 115: 120-131. https://doi.org/10.1016/j.ymssp.2018.05.064
[28] Li, Y., Bi, S., Zhao, C. (2019). Analytical modeling and analysis of rhombus-type amplifier based on beam flexures. Mechanism and Machine Theory, 139: 195-211. https://doi.org/10.1016/j.mechmachtheory.2019.04.015
[29] Dong, W., Chen, F., Gao, F., Yang, M., Sun, L., Du, Z., Tang, J., Zhang, D. (2018). Development and analysis of a bridge-lever-type displacement amplifier based on hybrid flexure hinges. Precision Engineering, 54: 171-181. https://doi.org/10.1016/j.precisioneng.2018.04.017
[30] Arafat, M., Sjafrizal, T., Anugraha, R.A. (2020). An artificial neural network approach to predict energy consumption and surface roughness of a natural material. SN Applied Sciences, 2(7): 1174. https://doi.org/10.1007/s42452-020-2987-6
[31] Wang, C.N., Truong, K.P., Huynh, N.T. (2019). Optimization effects of design parameter on the first frequency modal of a Bridge-type compliant mechanism flexure hinge by using the Taguchi method. Journal of Physics: Conference Series, 1303(1): 012063. https://doi.org/10.1088/1742-6596/1303/1/012063
[32] Paturi, U.M.R., Devarasetti, H., Narala, S.K.R. (2018). Application of regression and artificial neural network analysis in modelling of surface roughness in hard turning of AISI 52100 steel. Materials Today: Proceedings, 5(2): 4766-4777. https://doi.org/10.1016/j.matpr.2017.12.050
[33] Sanjeevi, R., Nagaraja, R., Krishnan, B.R. (2020). Vision-based surface roughness accuracy prediction in the CNC milling process (Al6061) using ANN. Materials Today: Proceedings, 37: 245-247. https://doi.org/10.1016/j.matpr.2020.05.122
[34] Sepulveda, G.C., Ochoa, S., Thibault, J. (2020). Methodology to solve the multi-objective optimization of acrylic acid production using neural networks as meta-models. Processes, 8(9): 1184. https://doi.org/10.3390/pr8091184
[35] Roy, R.K. (2010). A Primer on the Taguchi Method. Society of Manufacturing Engineers, p. 329.
[36] Lyu, Z., Xu, Q. (2022). Novel design of a piezoelectrically actuated compliant microgripper with high area-usage efficiency. Precision Engineering, 76: 1-11. https://doi.org/10.1016/j.precisioneng.2022.03.003
[37] Wu, H., Lai, L., Zhang, L., Zhu, L. (2022). A novel compliant XY micro-positioning stage using bridge-type displacement amplifier embedded with Scott-Russell mechanism. Precision Engineering, 73: 284-295. https://doi.org/10.1016/j.precisioneng.2021.09.014
[38] Wu, H., Chen, G. (2022). A flexure-based displacement reducer capable of achieving very large reduction ratio. Mechanism and Machine Theory, 170: 104658. https://doi.org/10.1016/j.mechmachtheory.2021.104658
[39] Chen, X., Li, Y., Xie, Y., Wang, R. (2021). Design and analysis of new ultra compact decoupled XYZ [formula omitted] stage to achieve large-scale high precision motion. Mechanism and Machine Theory, 167: 1-22.