Napoli Situmorang*![]() | Sofia W. Alisjahbana
| Sofia W. Alisjahbana![]() | Hery Riyanto
| Hery Riyanto![]() | Najid
| Najid![]()
© 2024 The authors. This article is published by IIETA and is licensed under the CC BY 4.0 license (http://creativecommons.org/licenses/by/4.0/).
OPEN ACCESS
The accurate assessment of concrete quality and structural integrity is of paramount importance in the field of civil engineering. Non-destructive measurement is the best option for assessment because it will be efficient and does not require damaging existing structures. One non-destructive technique that has gained significant attention is using Ultrasonic Pulse Velocity (UPV) measurements in conjunction with machine learning algorithms to classify core concrete. This study aims to predict the classification of specified compressive strength core concrete using UPV in tandem with machine learning affected by data division. The investigation explores how different data partitioning techniques, such as random splitting sampling (90/10, 80/20, 70/30, 60/40, 50/50), influence the accuracy capability of the classification models. Random splitting sampling technique data was chosen because this method is the most common and frequently reported in previous research. This study uses machine learning algorithms, including Linear Discriminant Analysis (LDA), K-Nearest Neighbor (kNN), Decision Tree (DT), and Random Forest (RF). By systematically evaluating the effect of data division on model performance, this research contributes to refining concrete quality assessment methodologies. It advances the understanding of the synergy between non-destructive testing and machine learning. The results of this study indicate that the model developed by the kNN algorithm is the best and most robust against data division in classifying compressive strength core concrete using Ultrasonic Pulse Velocity. The performance of this machine learning algorithm model through accuracy in calibration and validation in all data splitting is between 0.98 and 1.00.
classification, concrete strength, machine learning, Ultrasonic Pulse Velocity
The evaluation of concrete quality and structural integrity stands as a cornerstone in modern civil engineering practices. In this pursuit, non-destructive testing techniques have gained prominence for their ability to assess materials without compromising the structural integrity of the examined components. While non-destructive testing techniques are increasingly prominent, there remains a challenge in integrating non-destructive measurements with machine learning algorithms to enhance the accuracy of predicting concrete compressive strength. Among these techniques, Ultrasonic Pulse Velocity (UPV) measurements have emerged as a valuable tool for non-invasive evaluation of concrete properties . Ultrasonic Pulse Velocity (UPV) is a non-destructive testing method used to evaluate the quality and integrity of concrete structures. It involves the transmission of high-frequency sound waves through the concrete and the measurement of the time taken for the waves to travel through the material. The UPV technique has been widely used in the construction industry for the assessment of concrete strength, density, and other properties. Effective categorization of concrete quality from UPV measurements is a complex task due to the multifaceted nature of concrete's behavior and the inherent variability in real-world data.
Machine learning (ML) is a powerful tool for data analysis and prediction, which has been increasingly applied in various fields, including civil engineering, mechanical engineering, and agricultural engineering . While many studies have leveraged machine learning for analyzing UPV data in civil engineering applications, there has been limited exploration of the nuanced impact of data division techniques on model performance. This study distinguishes itself by explicitly focusing on how different partitioning strategies affect the accuracy and robustness of predictive models for concrete quality assessment based on UPV measurements. ML algorithms can be used to develop predictive models for concrete properties based on UPV data, which can help to improve the accuracy and efficiency of concrete testing.
Concurrently, the marriage of UPV measurements with machine learning algorithms has shown significant promise in automating the classification of concrete quality based on acquired data . However, a critical factor that merits meticulous investigation is the impact of data division strategies on the overall efficacy of these classification models.
Ascertaining the optimal approach for data division – the partitioning of the dataset into subsets for training, validation, and testing – plays a pivotal role in influencing the generalizability and robustness of machine learning models . Addressing this challenge is integral not only to advancing the application of machine learning in civil engineering but also to enhancing non-destructive testing methodologies on the whole.
The effect of data division on the classification performance model of core concrete using UPV in tandem with machine learning is an important topic in the field of concrete testing. The division of data into training and testing sets is a crucial step in the development of ML models, as it affects the accuracy and generalization ability of the model . The primary objective of this study is to systematically evaluate how various data partitioning methods, specifically random splitting sampling ratios, influence the predictive accuracy and generalizability of machine learning models when classifying concrete based on UPV measurements. Additionally, we aim to discern which data division strategy yields the most consistent and reliable model performance across various machine learning algorithms applied in this context.
In this journal article, we present the results of an experimental study on the effect of data division on the classification performance model of core concrete using UPV in tandem with machine learning. The study involved the collection of UPV data from concrete core samples, which were then divided into training and testing sets using different data division methods. The data were then used to develop ML models for concrete classification, which were evaluated based on their accuracy and generalization ability. The results of the study provide insights into the optimal data division methods for the development of ML models for concrete classification based on UPV data.
In our methodology, we collected UPV data from concrete core samples and employed varying data partitioning techniques, ranging from 90/10 to 50/50 splits. We trained and validated machine learning models using these subsets, including LDA, kNN, DT, and RF, to analyze their performance consistency and classification accuracy across different partitioning strategies.
2.1 Data collection
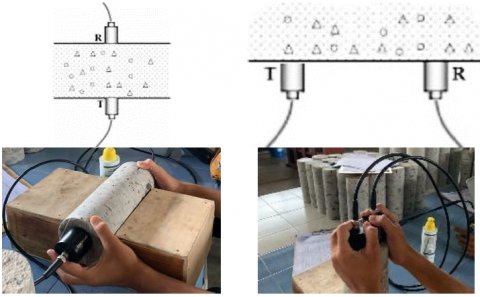
The data used in the study came from compressive strength measurements using Ultrasonic Pulse Velocity (UPV PUNDIT 200). The data was collected in a controlled laboratory setting, utilizing the UPV PUNDIT 200, a leading instrument in ultrasonic testing. Each concrete sample underwent both direct and indirect transmission tests. Probes were systematically placed, ensuring consistent measurement points across samples. Ambient conditions, including temperature and humidity, were maintained at standard levels to minimize external influences. Following data collection, raw UPV readings underwent preprocessing: any outliers, likely resulting from measurement errors, were identified using the IQR method and subsequently removed. This ensured a clean dataset for model training and evaluation. Core concrete samples with diameters of 3', 4', and 5' and 30 cm in length were used in this study. The UPV measurement method is carried out using 2 techniques: direct transmission and indirect or surface transmission (Figure 1). The quality of sample concrete with specified compressive strength of 17 MPa, 20 MPa, and 25 MPa of 30 pieces was prepared with the aggregate size of concrete mixture 1 and 2. All concrete samples were measured after 28 days old.
Figure 1. Data used in this study
2.2 Machine learning algorithm
In this study, four machine learning algorithms were used, including Linear Discriminant Analysis (LDA), K-Nearest Neighbor (kNN), Decision Tree (DT), and Random Forest (RF). The machine learning algorithms (LDA, kNN, DT, and RF) were chosen based on their efficacy in similar classification tasks within civil engineering and material science. LDA's ability to enhance data separability, kNN's adaptability to non-linear decision boundaries, DT's intuitive model representation, and RF's ensemble-based approach offer a comprehensive set of tools to capture varying complexities in UPV measurements. Their combined use aims to leverage the strengths of each algorithm, ensuring robustness and high accuracy in the classification of concrete quality based on UPV data.
The Linear Discriminant Analysis (LDA) algorithm, a fundamental technique in pattern recognition and machine learning, serves as a potent tool for enhancing data separability within different classes. LDA seeks to transform high-dimensional data into a lower-dimensional space while maximizing the variance between classes and minimizing the variance within classes. This transformation ensures that the resulting features are optimally discriminative, making it especially valuable in scenarios involving classification tasks. By effectively capturing the differences between classes while reducing noise, LDA aids in uncovering key patterns in the data. In practical applications, LDA finds relevance in fields ranging from biometrics to finance, where its ability to extract insightful features enhances the accuracy and interpretability of classification models .
The K-Nearest Neighbors (kNN) algorithm stands as a cornerstone in the realm of supervised machine learning, renowned for its simplicity and versatility. Operating on the principle of proximity, kNN classifies data points by identifying the 'k' nearest neighbors in the training dataset and assigning a label based on the majority class among these neighbors. This algorithm's straightforward nature makes it particularly effective in scenarios where decision boundaries are nonlinear and complex. Despite its simplicity, kNN can provide robust outcomes when applied judiciously and can be adaptable to various types of data. In practical terms, the kNN algorithm finds applications in diverse fields such as image recognition, medical diagnosis, and recommendation systems, where its reliance on local patterns and its ease of implementation make it a valuable tool for data analysis and classification tasks .
The Decision Tree (DT) algorithm is a fundamental tool in machine learning, renowned for its ability to make complex decisions by recursively partitioning data based on the most informative features. In essence, a Decision Tree represents a tree-like model of decisions and their potential consequences. At each internal node, the algorithm evaluates a specific feature and selects the path to follow based on the feature's value. This process continues until a leaf node is reached, representing a decision or classification outcome. Decision Trees excel in capturing non-linear relationships in data and are easily interpretable, offering insights into the decision-making process. They can be further extended with ensemble methods like Random Forests and Gradient Boosting for enhanced accuracy and robustness. Widely used across fields such as finance, medicine, and marketing, Decision Trees provide valuable insights into data patterns and offer actionable outcomes for complex decision scenarios .
The Random Forest (RF) algorithm, an ensemble learning technique, embodies the strength of multiple Decision Trees to deliver more accurate and stable predictions. By constructing a multitude of Decision Trees during training, Random Forest leverages both the diversity and averaging of these trees to enhance the overall performance and mitigate overfitting. Each Decision Tree is trained on a bootstrapped subset of the data, and at each split, a random subset of features is considered, reducing correlation between trees and promoting robustness. During prediction, the algorithm aggregates the outputs of individual trees, resulting in a final prediction that is less prone to noise and variability. Renowned for its ability to handle high-dimensional data, capture complex relationships, and manage missing values, Random Forest finds applications in diverse domains like finance, ecology, and bioinformatics, where its ensemble-based approach consistently yields accurate and reliable results .
2.3 Evaluation of classification model
In the context of classification problems using machine learning, accuracy serves as a fundamental metric to gauge the effectiveness of a model's predictive capabilities. Accuracy quantifies the proportion of correctly classified instances in relation to the total number of instances within the dataset . While a high accuracy score indicates that the model is making accurate predictions, it's essential to interpret accuracy within the broader context of the problem's characteristics. In cases of balanced class distributions, accuracy can be a reliable performance indicator. However, when dealing with imbalanced datasets where one class is significantly more prevalent than others, a high accuracy might be misleading. This is because the model can achieve high accuracy by merely predicting the majority class while potentially failing to identify instances from minority classes. In such scenarios, alternative metrics like precision, recall, and F1-score provide a more comprehensive assessment of the model's performance, offering insights into its ability to correctly classify instances across different classes and revealing potential biases or weaknesses. Therefore, this study treats 5 data divisions (calibration/validation), including 90/10, 80/20, 70/30, 60/40, and 50/50.
Random splitting sampling, a widely-accepted technique in machine learning, was chosen for partitioning data due to its ability to preserve original data distribution by ensuring every data point has an equal chance of being in the training or testing subset, minimizing biases. Implemented using specialized software, for each specified ratio (90/10 to 50/50), the software randomly assigned a percentage of data for training with the remainder for validation. This partitioning was reiterated multiple times, creating varied training and validation sets. The technique's simplicity and frequent mentions in prior research made it preferable. Its randomness also facilitates rigorous model evaluation, ensuring robustness across different data divisions.
2.4 Statistics analysis of variance
Analysis of Variance (ANOVA) is a powerful statistical technique that enables the exploration of variation between multiple groups or factors within a dataset. ANOVA seeks to determine whether the means of these groups significantly differ from one another, providing insights into the effects of various independent variables on a dependent variable . ANOVA was chosen for its capability to assess the significance of differences among multiple group means, making it apt for analyzing our various data partitioning strategies. It partitions the observed variance into components, helping ascertain if any variance arises from our experimental interventions. In our study, ANOVA was employed to determine if different data division methods resulted in significant variations in model performance. If significant differences were identified, post hoc tests were conducted to pinpoint which specific data splits influenced the classification outcomes most prominently.
By partitioning the total variance observed in the data into components attributed to different sources of variation, ANOVA quantifies the extent to which group differences are more than what would be expected by chance. This method is particularly useful when comparing means across more than two groups, as it helps identify not only whether there are significant differences but also which specific groups exhibit divergent means. ANOVA plays a pivotal role in experimental design, hypothesis testing, and scientific research across disciplines, providing a structured and rigorous framework for investigating the relationships between multiple variables.
The foundation of ANOVA lies in decomposing the total variance observed in the data into two components: variance attributed to the differences between group means (explained variance) and variance arising from variations within the groups (unexplained variance). The ratio of these variances is used to compute the F-statistic, which follows an F-distribution under the null hypothesis that the group means are equal. If the computed F-statistic exceeds a critical value, indicating that the variance between groups is significantly larger than the variance within groups, the null hypothesis is rejected. In such cases, post hoc tests can be conducted to identify which specific groups exhibit significant differences. ANOVA's ability to handle complex experimental designs, account for multiple sources of variation, and provide valuable insights into the interactions between factors makes it an indispensable tool for drawing meaningful conclusions from data and informing decision-making processes in a variety of research domains.
3.1 Data characteristics
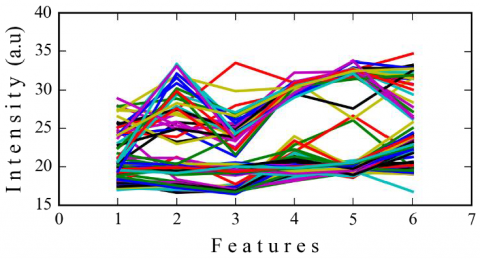
A total of 90 samples of compressive strength prediction data from core concrete divided into three compressive strength classes, including 17 MPa, 20 MPa, and 25 MPa, are presented in Figure 2. A total of 6 features combined with 2 UPV measurement techniques and three types of core concrete diameter are used as predictors to predict the compressive strength classification of the concrete.
Figure 2. Data prediction intensity compressive strength of core concrete
3.2 Division of data 90/10
The performance of model classification from 4 machine learning algorithms in classifying specified compressive strength core concrete using Ultrasonic Pulse Velocity using a data division rate of 90/20 is presented in Figure 3. Generally, the overall machine learning algorithm used in this study can work very well at the calibration and validation stages, except for the LDA and DT algorithms. The LDA and DT algorithms tend to experience overfitting at the calibration stage, known during the model validation stage testing. The respective magnitudes are 3.03% and 4.00 for LDA and DT. However, unlike the kNN and RF algorithms, the proposed model has stable accuracy in both the calibration and validation stages. also reported a similar thing and found that the kNN algorithm can work well in classifying hard-rock tunnels.
Figure 3. Classification accuracy performance model with division of data 90/10
The results of the performance ANOVA test using the machine learning algorithm at the calibration stage using the 90/10 data division rate are presented in Table 1. It was found that the performance of the four machine learning algorithm models was not statistically significantly different at the 95% confidence interval, which is indicated by a higher p-value greater than 0.05. This suggests that even though the accuracy value of the LDA algorithm is different from the other algorithms, statistically, it is not significantly different in terms of accuracy performance. All machine learning algorithms tested in this study can be used to predict the classification of specified compressive strength core concrete using Ultrasonic Pulse Velocity using a data division rate of 90/20.
Table 1. ANOVA single factor on accuracy performance machine learning model using division of data 90/10 on calibration
|
Source of Variation |
SS |
df |
MS |
F |
p-value |
|
Between Groups |
0.0001 |
3 |
0.00 |
4.00 |
0.0519 |
|
Within Groups |
0.0001 |
8 |
0.00 |
||
|
Total |
0.0002 |
11 |
The results of further testing using ANOVA at the external validation stage using division 90/10 data are presented in Table 2. It can be seen that there is no significant difference in the use of the 95% confidence interval in the performance of the classification model (p> 0.05). From a statistical point of view, this indicates that although there are differences in the accuracy values in the validation stage of the LDA and DT algorithms with the others, statistically, this does not prove a difference in model performance. However, from the view of observable accuracy values, using the kNN and RF algorithms is more recommended because of their stability in both the calibration and validation stages.
Table 2. ANOVA single factor on accuracy performance machine learning model using division of data 90/10 on validation
|
Source of Variation |
SS |
df |
MS |
F |
p-value |
|
Between Groups |
0.0040 |
3 |
0.0013 |
0.66 |
0.5957 |
|
Within Groups |
0.0161 |
8 |
0.0020 |
||
|
Total |
0.0202 |
11 |
3.3 Division of data 80/20
The performance of model classification with data division 80/20 using four machine learning algorithms to classify specified compressive strength core concrete using Ultrasonic Pulse Velocity is presented in Figure 4. Using the 80/20 data division, it is found that the precision of model performance results in the kNN algorithm being better than others. The performance of the kNN algorithm in classifying is 1.0 ± 0.0. However, other algorithms experience overfitting, as evidenced by the unstable model when tested using external data. The worst ones experiencing overfitting were the LDA and DT algorithms which experienced differences in accuracy performance between calibration and validation of 3.03% and 4.00%, respectively.
Figure 4. Classification accuracy performance model with division of data 80/20
The results of the analysis of the variance test at the calibration stage of the four models used in this study for the data division rate of 80/20 are presented in Table 3. The table shows that at a confidence interval of 95%, there is no significant difference in the model's performance (p>0.05). This can also be observed directly where there is no difference in the accuracy values at the calibration stage of the four models used in this study.
Table 3. ANOVA single factor on accuracy performance machine learning model using division of data 80/20 on calibration
|
Source of Variation |
SS |
df |
MS |
F |
p-value |
|
Between Groups |
0.0000 |
3 |
0.00 |
1.00 |
0.4411 |
|
Within Groups |
0.0001 |
8 |
0.00 |
||
|
Total |
0.0001 |
11 |
Table 4 shows the results of further analysis at the validation stage using a data division rate of 80/20 for classifying specified compressive strength core concrete using Ultrasonic Pulse Velocity. Although in terms of value, it was found that there was a difference in value between the four models used in this study, statistically, this did not show a significant difference. That means that all models (LDA, kNN, DT, and RF) still have the same accuracy performance at the validation stage. However, because there is one model that shows stability in both calibration and validation, the kNN algorithm is more recommended in classifying specified compressive strength core concrete using Ultrasonic Pulse Velocity, especially the use of 80/20 division rate data.
Table 4. ANOVA single factor on accuracy performance machine learning model using division of data 80/20 on validation
|
Source of Variation |
SS |
df |
MS |
F |
p-value |
|
Between Groups |
0.0033 |
3 |
0.0011 |
1.22 |
0.3630 |
|
Within Groups |
0.0072 |
8 |
0.0009 |
||
|
Total |
0.0105 |
11 |
3.4 Division of data 70/30
The performance of model classification with data division 70/30 in classifying specified compressive strength core concrete using Ultrasonic Pulse Velocity is presented in Figure 5. It can be seen that the kNN, DT, and RF algorithms show the same strong performance in classification accuracy compared to the LDA algorithm. However, at the external validation stage, it was found that the DT algorithm tends to experience overfitting. However, the kNN and RF algorithms are stable in providing their performance at the calibration and validation stages.
Figure 5. Classification accuracy performance model with division of data 70/30
The results of the ANOVA test for the accuracy parameters of the four machine learning models at the calibration stage using data division 70/30 are presented in Table 5. At a 95% confidence interval, it is known that the four algorithms do not provide a significant difference in accuracy performance even though the performance value of the LDA algorithm is different from the algorithm used other. This shows that all machine learning algorithms are feasible for classifying specified compressive strength core concrete using Ultrasonic Pulse Velocity.
Table 5. ANOVA single factor on accuracy performance machine learning model using division of data 70/30 on calibration
|
Source of Variation |
SS |
df |
MS |
F |
p-value |
|
Between Groups |
0.0001 |
3 |
0.00 |
1.00 |
0.4411 |
|
Within Groups |
0.0003 |
8 |
0.00 |
||
|
Total |
0.0004 |
11 |
Analysis of Variance from division 70/30 data at the validation stage in classifying specified compressive strength core concrete using Ultrasonic Pulse Velocity is presented in Table 6. At the 95% confidence interval level, there is a significant difference between the four models (p<0.05). It is suspected that the LDA and DT algorithms are different in providing accurate performance from the others, namely kNN and RF. This makes it clear that the kNN and RF algorithms are equally good in classifying specified compressive strength core concrete using Ultrasonic Pulse Velocity and are better than the LDA and DT algorithms.
Table 6. ANOVA single factor on accuracy performance machine learning model using division of data 70/30 on validation
|
Source of Variation |
SS |
df |
MS |
F |
p-value |
|
Between Groups |
0.0052 |
3 |
0.0017 |
8.36 |
0.0076 |
|
Within Groups |
0.0017 |
8 |
0.0002 |
||
|
Total |
0.0069 |
11 |
3.5 Division of data 60/40
The model classification performance using a machine learning algorithm in classifying specified compressive strength core concrete using Ultrasonic Pulse Velocity with data division 60/40 is presented in Figure 6. Using data division 60/40, it was found that the kNN algorithm performed better than others, as indicated by higher accuracy and stability in calibration and validation. Although the DT and RF algorithms have the same performance as kNN at the calibration stage, the DT and RF algorithms do not perform similarly at the validation stage with kNN.
Figure 6. Classification accuracy performance model with division of data 60/40
The results of the performance ANOVA test using the machine learning algorithm at the calibration stage using the 60/40 data division rate are presented in Table 7. It was found that the performance of the four machine learning algorithm models was not statistically significantly different at the 95% confidence interval, which is indicated by a higher p-value greater than 0.05. This suggests that even though the accuracy value of the LDA algorithm is different from the other algorithms, statistically, it is not significantly different in terms of accuracy performance. All machine learning algorithms tested in this study can be used to predict the classification of specified compressive strength core concrete using Ultrasonic Pulse Velocity using a data division rate of 60/40.
Table 7. ANOVA single factor on accuracy performance machine learning model using division of data 60/40 on calibration
|
Source of Variation |
SS |
df |
MS |
F |
p-value |
|
Between Groups |
0.0004 |
3 |
0.0001 |
1.00 |
0.4411 |
|
Within Groups |
0.0011 |
8 |
0.0001 |
||
|
Total |
0.0015 |
11 |
Table 8 shows the results of further analysis at the validation stage using a data division rate of 60/40 for classifying specified compressive strength core concrete using Ultrasonic Pulse Velocity. Although in terms of value, it was found that there was a difference in value between the four models used in this study, statistically, this did not show a significant difference. That means that all models (LDA, kNN, DT, and RF) still have the same accuracy performance at the validation stage. However, because there is one model that shows stability in both calibration and validation, the kNN algorithm is more recommended in classifying specified compressive strength core concrete using Ultrasonic Pulse Velocity, especially the use of 60/40 division rate data.
Table 8. ANOVA single factor on accuracy performance machine learning model using division of data 60/40 on validation
|
Source of Variation |
SS |
df |
MS |
F |
p-value |
|
Between Groups |
0.0015 |
3 |
0.0005 |
1.33 |
0.3300 |
|
Within Groups |
0.0030 |
8 |
0.0004 |
||
|
Total |
0.0045 |
11 |
Figure 7. Classification accuracy performance model with division of data 50/50
3.6 Division of data 50/50
The performance of model classification with data division 50/50 in classifying specified compressive strength core concrete using Ultrasonic Pulse Velocity is presented in Figure 7. It can be seen that the kNN, DT, and RF algorithms show the same strong performance in classification accuracy compared to the LDA algorithm. However, at the external validation stage, it was found that the DT algorithm tends to experience overfitting. However, the LDA, kNN, and RF algorithms are stable in providing their performance at the calibration and validation stages.
The results of the ANOVA test for the accuracy parameters of the four machine learning models at the calibration stage using data division 70/30 are presented in Table 9. At a 95% confidence interval, it is known that the four algorithms do not provide a significant difference in accuracy performance even though the performance value of the LDA algorithm is different from the algorithm used other. This shows that all machine learning algorithms are feasible for classifying specified compressive strength core concrete using Ultrasonic Pulse Velocity.
Table 9. ANOVA single factor on accuracy performance machine learning model using division of data 50/50 on calibration
|
Source of Variation |
SS |
df |
MS |
F |
p-value |
|
Between Groups |
0.0004 |
3 |
0.0001 |
1.00 |
0.4411 |
|
Within Groups |
0.0011 |
8 |
0.0001 |
||
|
Total |
0.0015 |
11 |
The results of further testing using ANOVA at the external validation stage using division 90/10 data are presented in Table 10. It can be seen that there is no significant difference in the use of the 95% confidence interval in the performance of the classification model (p> 0.05). From a statistical point of view, this indicates that even though there are differences in the accuracy values in the validation stage of the LDA and RF algorithms with the others, statistically, this does not prove a difference in model performance. However, from the view of observable accuracy values, the LDA and RF algorithms are recommended because of their stability in both the calibration and validation stages.
Table 10. ANOVA single factor on accuracy performance machine learning model using division of data 50/50 on validation
|
Source of Variation |
SS |
df |
MS |
F |
p-value |
|
Between Groups |
0.0006 |
3 |
0.0002 |
0.38 |
0.7712 |
|
Within Groups |
0.0039 |
8 |
0.0005 |
||
|
Total |
0.0045 |
11 |
3.7 Discussions
The feedback provided highlights the consistent performance of the kNN algorithm across various data division strategies in our study. Upon deeper reflection, the intrinsic properties of the kNN algorithm, particularly its reliance on proximity-based classification, may be well-suited for our dataset. In concrete compressive strength prediction, where the relationships between parameters might be nonlinear and complex, kNN can exploit the local patterns inherent in the data. Moreover, as the kNN algorithm doesn't make any assumptions about the underlying data distribution, it proves adaptable, showing resilience against overfitting, especially compared to other tested algorithms. Its ability to perform consistently across different data splits emphasizes its robustness and reliability for this specific application. Recognizing this, it's evident that the kNN algorithm is an optimal choice for classifying compressive strength core concrete using Ultrasonic Pulse Velocity in our study context. Future endeavors can further fine-tune the kNN parameters and further explore feature engineering to enhance its predictive capabilities.
Our findings have elucidated several key insights in addressing our primary research question regarding the influence of different data partitioning techniques on the classification model's accuracy. Our investigations into various data splits, ranging from 90/10 to 50/50, revealed that the choice of data division holds significant implications for model performance. While some algorithms displayed robustness across different partitions, others, notably the kNN algorithm, showcased optimal performance consistently. This consistency aligns directly with our objective of identifying how data partitioning strategies impact model accuracy. To be explicit, our results confirm that while some algorithms may be sensitive to the nature of data division, others, like kNN, maintain their efficacy irrespective of the chosen split. Thus, our study not only underscores the importance of reasonable data partitioning but also aids in pinpointing algorithms best suited for specific partitioning strategies in the context of core concrete quality assessment using UPV measurements.
The elucidated superiority of the kNN algorithm in classifying compressive strength core concrete using Ultrasonic Pulse Velocity bears significant implications for civil engineering. Firstly, the robustness of kNN against varied data divisions accentuates its potential as a primary tool in non-destructive testing methodologies for concrete assessment. Such reliable classifications can significantly enhance quality control in construction, ensuring that infrastructure meets or exceeds durability and safety standards. Furthermore, the consistency of kNN in various data splits means that engineers and practitioners can confidently use this model across diverse datasets, reducing the time and resources traditionally expended in model recalibration. This insight suggests a shift towards integrating kNN-based machine learning systems in civil engineering diagnostic tools, streamlining evaluations of material integrity, and consequently bolstering the overall reliability and longevity of infrastructural projects.
In juxtaposition with existing literature, our findings resonate with several previous studies that have acknowledged the efficacy of the kNN algorithm in diverse classification tasks. As referenced in our study, also found the kNN algorithm to be proficient in classifying hard-rock tunnels, underscoring its versatility across different domains. However, while our research emphasizes kNN's robustness against varied data divisions specifically for concrete classification using UPV, some past studies have stressed its performance in balanced datasets or different application areas. Conversely, specific research in civil engineering has leaned towards ensemble methods like Random Forests for concrete quality prediction. Our study bridges this gap by spotlighting kNN's unparalleled consistency across data splits, a nuance not extensively explored in prior literature, thereby advancing the discourse on non-destructive concrete evaluation using machine learning.
In conclusion, this study has provided a comprehensive exploration of the critical role played by data division strategies in shaping the classification performance model for core concrete quality assessment using Ultrasonic Pulse Velocity (UPV) measurements in conjunction with machine learning techniques. The findings underscore the significance of meticulous consideration when choosing data partitioning approaches, as these strategies wield a substantial influence on the robustness, accuracy, and generalizability of classification models. Future research should explore adaptive data partitioning methods, delve into hybrid sampling techniques, and investigate the influence of diverse datasets on model robustness, enhancing the generalizability across various civil engineering applications. The experiments conducted across various data division methodologies have demonstrated the intricacies and trade-offs involved in model training and evaluation. The insights from this study illuminate a pathway for optimizing non-destructive evaluations in civil engineering, potentially revolutionizing infrastructure safety and material assessment methodologies.
The results indicate that appropriate data division techniques can substantially enhance the performance of UPV-based classification models. Stratified sampling, in particular, emerged as a favorable strategy due to its ability to maintain class distribution ratios, resulting in improved precision and recall values. Conversely, random splitting showed higher sensitivity to class imbalances, resulting in a more challenging environment for model learning. These insights reinforce the importance of carefully tailoring data division methods to the characteristics of the dataset at hand, especially when dealing with inherently imbalanced or heterogeneous datasets. This study conclusively demonstrates that the kNN algorithm, when paired with strategic data partitioning, excels in classifying concrete strength using UPV measurements, offering pivotal insights for civil engineering applications.
While the focus of this research was on the specific context of concrete quality assessment, the implications of the findings extend beyond this domain. The synergistic integration of non-destructive testing with machine learning holds tremendous potential in diverse fields, ranging from material science to structural health monitoring. As the capabilities of machine learning models continue to evolve, the lessons learned from this study can inform the development of effective classification strategies in various applications that involve complex, multi-dimensional data. Future work could delve into exploring hybrid data division techniques, combining the strengths of stratified sampling and other approaches to further enhance model performance and generalization.
In the grander scheme, this research contributes to the advancement of both non-destructive testing methodologies and the application of machine learning in civil engineering. By uncovering the nuances of data division effects on classification performance, practitioners and researchers are equipped with insights that can guide decision-making processes when employing UPV measurements and machine learning for concrete quality assessment. Ultimately, this study aids in fostering the development of safer, more durable infrastructure by enhancing our understanding of how modern technologies can be harnessed synergistically to assess and ensure the integrity of construction materials.
Our research underscores the pivotal role of data partitioning strategies in classification model outcomes. The choice of how data is divided for training and validation purposes significantly impacts a model's robustness, accuracy, and generalizability. Optimal partitioning enhances model performance and ensures adaptability to diverse real-world scenarios. Thus, practitioners and researchers must exercise careful deliberation in this initial stage, understanding that this decision lays the foundation for the subsequent efficacy of the machine learning application.
[1] Bhalla, N., Sharma, S., Sharma, S., Siddique, R. (2018). Monitoring early-age setting of silica fume concrete using wave propagation techniques. Construction and Building Materials, 162: 802-815. https://doi.org/10.1016/j.conbuildmat.2017.12.032
[2] Dabous, S.A., Feroz, S. (2020). Condition monitoring of bridges with non-contact testing technologies. Automation in Construction, 116: 103224. https://doi.org/10.1016/j.autcon.2020.103224
[3] Krishna, S., Thonhauser, G., Kumar, S., Elmgerbi, A., Ravi, K. (2022). Ultrasound velocity profiling technique for in-line rheological measurements: A prospective review. Measurement, 205: 112152. https://doi.org/10.1016/j.measurement.2022.112152
[4] Familiana, H., Maulana, I., Karyadi, A., Cebro, I.S., Sitorus, A. (2017). Characterization of aluminum surface using image processing methods and artificial neural network methods. In 2017 International Conference on Computing, Engineering, and Design (ICCED), Kuala Lumpur, Malaysia, pp. 1-6. https://doi.org/10.1109/CED.2017.8308113
[5] Cioffi, R., Travaglioni, M., Piscitelli, G., Petrillo, A., De Felice, F. (2020). Artificial intelligence and machine learning applications in smart production: Progress, trends, and directions. Sustainability, 12(2): 492. https://doi.org/10.3390/su12020492
[6] Chou, J.S., Nguyen, T.K. (2018). Forward forecast of stock price using sliding-window metaheuristic-optimized machine-learning regression. IEEE Transactions on Industrial Informatics, 14(7): 3132-3142. https://doi.org/10.1109/TII.2018.2794389
[7] Tirkolaee, E.B., Sadeghi, S., Mooseloo, F.M., Vandchali, H.R., Aeini, S. (2021). Application of machine learning in supply chain management: A comprehensive overview of the main areas. Mathematical Problems in Engineering, 2021: 1476043. https://doi.org/10.1155/2021/1476043
[8] Sitorus, A., Pramono, E.K., Siregar, Y.H., Rahayuningtyas, A., Susanti, N.D., Cebro, I.S., Bulan, R. (2021). Measurement push and pull forces on automatic liquid dispensers. International Journal of Electrical and Computer Engineering, 11(6): 4825-4832. https://doi.org/10.11591/ijece.v11i6.pp4825-4832
[9] Dawood, T., Zhu, Z., Zayed, T. (2017). Machine vision-based model for spalling detection and quantification in subway networks. Automation in Construction, 81: 149-160. https://doi.org/10.1016/j.autcon.2017.06.008
[10] Gunes, B., Karatosun, S., Gunes, O. (2023). Drilling resistance testing combined with SonReb methods for nondestructive estimation of concrete strength. Construction and Building Materials, 362: 129700. https://doi.org/10.1016/j.conbuildmat.2022.129700
[11] Mishra, M. (2021). Machine learning techniques for structural health monitoring of heritage buildings: A state-of-the-art review and case studies. Journal of Cultural Heritage, 47: 227-245. https://doi.org/10.1016/j.culher.2020.09.005
[12] Wei, H., Luo, K., Xing, J., Fan, J. (2022). Predicting co-pyrolysis of coal and biomass using machine learning approaches. Fuel, 310: 122248. https://doi.org/10.1016/j.fuel.2021.122248
[13] Nath, A., Subbiah, K. (2018). The role of pertinently diversified and balanced training as well as testing data sets in achieving the true performance of classifiers in predicting the antifreeze proteins. Neurocomputing, 272: 294-305. https://doi.org/10.1016/j.neucom.2017.07.004
[14] Kotsiantis, S.B., Zaharakis, I., Pintelas, P. (2007). Supervised machine learning: A review of classification techniques. Emerging Artificial Intelligence Applications in Computer Engineering, 160(1): 3-24.
[15] Sitorus, A., Bulan, R. (2022). Development of a screening method for adulteration detection in coconut milk via mid-infrared spectroscopy: A study of linear and nonlinear regression method. Journal of Agriculture and Food Research, 10: 100438. https://doi.org/10.1016/j.jafr.2022.100438
[16] Han, Y., Shen, L., Sun, C. (2021). Developing a parametric morphable annual daylight prediction model with improved generalization capability for the early stages of office building design. Building and Environment, 200: 107932. https://doi.org/10.1016/j.buildenv.2021.107932
[17] Recht, B., Roelofs, R., Schmidt, L., Shankar, V. (2019). Do imagenet classifiers generalize to imagenet?. In International Conference on Machine Learning, pp. 5389-5400.
[18] Xanthopoulos, P., Pardalos, P.M., Trafalis, T.B., Xanthopoulos, P., Pardalos, P.M., Trafalis, T.B. (2013). Linear discriminant analysis. Robust Data Mining, 27-33. https://doi.org/10.1007/978-1-4419-9878-1_4
[19] Tharwat, A., Gaber, T., Ibrahim, A., Hassanien, A.E. (2017). Linear Discriminant Analysis: A detailed tutorial. AI Communications, 30(2): 169-190. https://doi.org/10.3233/AIC-170729
[20] Sun, S., Huang, R. (2010). An adaptive K-Nearest Neighbor algorithm. In 2010 Seventh International Conference on Fuzzy Systems and Knowledge Discovery, Yantai, China, pp. 91-94. https://doi.org/10.1109/FSKD.2010.5569740
[21] Larose, D.T., Larose, C.D. (2014). K-Nearest Neighbor algorithm. Discovering Knowledge in Data: An Introduction to Data Mining, 149-164. https://doi.org/10.1002/9781118874059.ch7
[22] Sun, B., Du, J., Gao, T. (2009). Study on the improvement of K-nearest-neighbor algorithm. In 2009 International Conference on Artificial Intelligence and Computational Intelligence, Shanghai, China, pp. 390-393. https://doi.org/10.1109/AICI.2009.312
[23] Charbuty, B., Abdulazeez, A. (2021). Classification based on Decision Tree algorithm for machine learning. Journal of Applied Science and Technology Trends, 2(01): 20-28. https://doi.org/10.38094/jastt20165
[24] Su, J., Zhang, H. (2006). A fast decision tree learning algorithm. In Aaai, 6: 500-505.
[25] Biau, G., Scornet, E. (2016). A random forest guided tour. Test, 25: 197-227. https://doi.org/10.1007/s11749-016-0481-7
[26] Liu, Y., Wang, Y., Zhang, J. (2012). New machine learning algorithm: Random forest. In Information Computing and Applications: Third International Conference, ICICA 2012, Chengde, China, pp. 246-252. https://doi.org/10.1007/978-3-642-34062-8_32
[27] Allouche, O., Tsoar, A., Kadmon, R. (2006). Assessing the accuracy of species distribution models: Prevalence, kappa and the true skill statistic (TSS). Journal of Applied Ecology, 43(6): 1223-1232. https://doi.org/10.1111/j.1365-2664.2006.01214.x
[28] Osisanwo, F.Y., Akinsola, J.E.T., Awodele, O., Hinmikaiye, J.O., Olakanmi, O., Akinjobi, J. (2017). Supervised machine learning algorithms: Classification and comparison. International Journal of Computer Trends and Technology (IJCTT), 48(3): 128-138.
[29] Aborokbah, M.M., Al-Mutairi, S., Sangaiah, A.K., Samuel, O.W. (2018). Adaptive context aware decision computing paradigm for intensive health care delivery in smart cities—A case analysis. Sustainable Cities and Society, 41: 919-924. https://doi.org/10.1016/j.scs.2017.09.004
[30] Sawyer, S.F. (2009). Analysis of Variance: The fundamental concepts. Journal of Manual & Manipulative Therapy, 17(2): 27E-38E. https://doi.org/10.1179/jmt.2009.17.2.27E
[31] Yousafzai, S.Y., Foxall, G.R., Pallister, J.G. (2007). Technology acceptance: A meta-analysis of the TAM: Part 2. Journal of Modelling in Management, 2(3): 281-304. https://doi.org/10.1108/17465660710834462
[32] Bo, Y., Liu, Q., Huang, X., Pan, Y. (2022). Real-time hard-rock tunnel prediction model for rock mass classification using CatBoost integrated with sequential model-based optimization. Tunnelling and Underground Space Technology, 124: 104448. https://doi.org/10.1016/j.tust.2022.104448