Manar Hussein Ali*![]() | Abdul-Hassan K. Al-Shukur
| Abdul-Hassan K. Al-Shukur![]()
© 2024 The authors. This article is published by IIETA and is licensed under the CC BY 4.0 license (http://creativecommons.org/licenses/by/4.0/).
OPEN ACCESS
Earth dam can be considered as the most ancient type of embankment dam that can be constructed with natural materials such as natural soils, rocks, clay and gravel. Zone earthfill dam is typically composed of two main parts: central core and shell that is filled with gravel and rock to strengthen the stability of the whole body of dam. Many reasons can cause the failure of an earth dam including hydraulic failure, structural failure and seepage failure. Earthquake failure can be considered as a structural failure, therefore, it is important to study the dynamic response of earth dam during the earthquake. This paper presents a seismic analysis on zone-earth dam subjected to earthquake excitation by using a shaking table with dimensions (170×150) cm, on which maximum acceleration, pore-water pressure, and displacement were calculated. The Makhool dam is considered as a case study that is located on Tigris River in Iraq with total length 3670 m. The physical model was simulated using a scale of 1:400 that fit the dimensions of the container (100×50×60) cm and subjected the model to the Halabja earthquake, with a magnitude of 7.3 (Richter scale) according to the Iraq Meteorological Organization and Seismology. Three values of earthquake (0.04 g, 0.06 g, and 0.08 g) were used with a time of 10 seconds, and the parameters were calculated on two nodes on the physical model. Pore-water pressure increases with an increase in the value of the earthquake and is larger at the dam base than the dam crest. Additionally, the displacement can be increased, which weakens the dam soil and affects the stability of the dam. The value of x-acceleration will be reduced at the end of the earthquake, which means the input acceleration affects soil properties.
earth dam, seismic waves, sensors, scaled model, vibration
Earthquake can be defined as a complex phenomenon that can be considered as a load in the engineering of the structure. Its complication comes from the fact that the earthquake is a load that is exerted on any structure with a specific magnitude and a very short time with different directions. From the above, it is very important to carry out dynamic analysis of an earth dam that is expressed by many parameters like displacement that describe the soil behavior at the end of an earthquake [1].
Evaluation of seismic activity must include four stages: field investigation, site characterization, analysis, and final evaluation. Field investigation includes seismological studies that shows the earthquake occurrence in the past at that region, these studies help to estimate the probability of future earthquake, Therefore, the seismic history of the region where the dam is being constructed must be available. The other investigation is geotechnical studies that include studying the formation of soil or rock at construction site and evaluating their behavior during the earthquake and how they affect the resistance of structure to resist the earthquake and also it needs to study the topographic condition [2].
Earthquake seismicity can cause additional loads on dam and increasing the pore water pressure also the field investigation showed that the slope instability is the main effect of earthquake and cause failure of the dam [3]. Also, an earthquake can cause structural failure and excitation of an embankment dam, which can result in the failure of the whole dam. Therefore, the failures resulting from earthquakes can be grouped into two main categories: liquefaction of the dam foundation and sliding or cracking of the embankment of the dam [4]. Much of the collected information shows that about 30,000 reservoirs are in a condition of low safety [5].
The evaluation of earthquake hazards can protect the population and put them in safety side also it can be protected the dams from failure by analysis the behavior of dam soil through and at the end of earthquake [6, 7].
Research work conduction shows the importance of calculation the earth dam strength and reliability, it can be calculated them by calculation the stress and strain of soil of earth dam under seismic loads [8, 9].
Khattab and Khalil [10] used a finite element model and GEO-SLOPE software to investigate pore-water pressure through the Mosul dam with three different accelerations: 0.2 g, 0.25 g, and 0.3 g, at three water levels. Three sections were studied in this study with one node and different properties of core materials (natural density, Hydraulic conductivity K and angle of friction). It was concluded that the pore-water pressure for the section above increases with the increasing the value of acceleration.
Fattah et al. [11] studied the dynamic analysis of the Khassa Chai (zoned earth dam) that subjected to an earthquake excitation, it was selected El-Centro earthquake with a period of 10 sec The input horizontal acceleration: 0.05 g, 0.1 g and 0.2 g, the results show different parameters: pore-water pressure, displacement and the stresses with different location on dam body. The horizontal displacement increases with increasing depth of the point on the dam. Also, the maximum pore-water pressure at the base of the dam increases.
Al-Hadidi and Abbas [12] studied numerical analysis of Al- wand earth dam by using quake/w and using the earthquake that happened in Iraq in 2017 with three values of acceleration 0.05 g, 0.02 g and 0.03 g. The maximum pore-water pressure at the base is larger and equal to 80 kPa and 110 kPa for nodes 3 and 1. The horizontal and vertical displacement increase with the increasing the time of earthquake and the stresses will be gradually decreases that means the soil became weaken.
Sammen et al. [13] studied numerical analysis of Hemren dam that is located in Iraq (Diyala governorate) by using two- dimensional finite element method GEO STUDIO, excited earthquake is Elcentro while three values of peak ground acceleration were used which are 0.2, 0.25 and 0.3 g and the duration time is scaled to 10 seconds.
It was observed that the maximum pore-water pressure at the dam base is equal to 51 kPa for an earthquake value of 0.3 g [9]. Deraa et al. [14] made numerical analysis of Mindali earth dam that is located in Iraq, Diyala to show the seismic behavior of dam, the dynamic analysis is expresses by pore- water pressure and displacement. excited earthquake is Elcentro while three values of peak ground acceleration were used which are 0.2, 0.25 and 0.3 g and the duration time is scaled to 10 seconds. The maximum pore-water pressure at the base is equal to 57 kPa, and the amount of x-displacement increases by about 50.44%. For the crest, the maximum pore-water pressure is about -5.60 kPa, and the amount of x-displacement increases by about 50% [15].
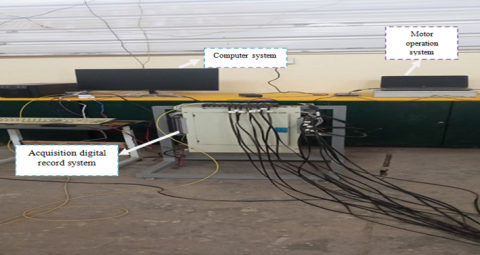
This paper will present the dynamic analysis results of physical model. This analysis is carried out by shaking table with system of shaking table that include (sensors, computer system, motor operation system and acquisition digital record system).
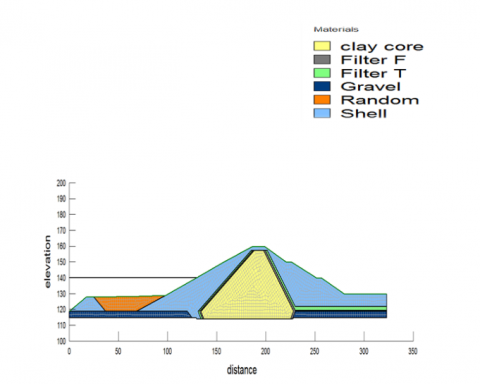
Makhool dam is an earth dam with clay core (under construction), it is located on Tigris River in Iraq, it is located 16 km of Al-Fatha bridge and 30 km North-east Baijy town in Salah Al-Din Governorate, the dam axis extends from the eastern side of Makhool anticline about 3 km, about 15 km downstream from the lesser Zab River junction with the Tigris River in Iraq and 249 km from Baghdad (Capital of Iraq).
The total length of the dam body is 3670 m with maximum water level of 150 (m.a.m.s.l.), the maximum height of the dam from the lowest point of river is 56 m, the height level of the crest dam is 160 (m.a.m.s.l.) and the crest width is 12 m (Table 1).
The body of the dam consisted from clay core and filter in downstream and upstream of the dam that contain from fine and coarse gravel and the dam shell.
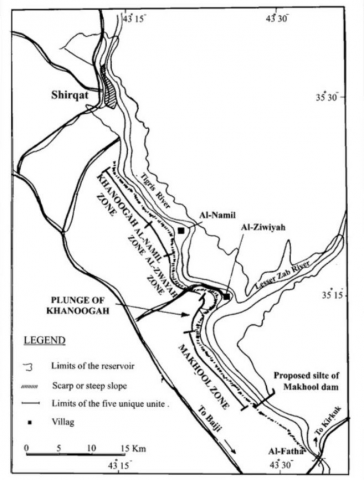
The dam axis extends from the Makhoul Mountain fold in the west for a length of more than 3.6 km across the floodplain to the end, with an eastern height from the Khanukah fold (based on the State Commission of Dams and Reservoirs, Iraq 2021, unpublished report), as shown in Figure 1.
The construction of this dam is for controlling floods and irrigation, and it can also be used for electrical power generation (Figure 2).
Table 1. Properties of Makhool dam
|
Property |
Value |
|
Crest Crest level of the dam Width of the crest |
160 m.a.m.s.l. 12m |
|
Clay Core Core level Core Top width Core base width |
157.5 m.a.m.s. l. 5 m 17.5 m |
|
Total length of dam |
3670 m |
|
Maximum height of dam |
56 m |
|
Elevation of maximum water level (M.W.L) |
150 m |
|
Elevation of minimum water level (N.W.L) |
140 m |
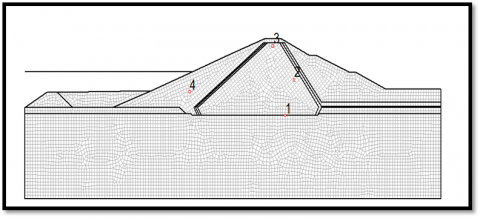
Figure 1. Critical section of Makhool dam model
Figure 2. Location of Makhool dam
Table 2. Material properties
|
No. |
Zone Type |
Material Properties |
|||||
|
γ (KN/m3) |
Cohesion (Kpa) |
Permeability (m/sec) |
Poisson Ratio |
Φ (°) |
Modulus of Elasticity (MN/m2) |
||
|
1 |
Clay core |
17.8 |
36 |
3.5×10⁻¹⁰ |
0.33 |
0 |
30 |
|
2 |
Filter F |
16 |
-- |
1.69×10⁻³ |
0.30 |
35 |
19 |
|
3 |
Filter T |
61 |
-- |
1.69×10⁻³ |
0.30 |
35 |
19 |
|
4 |
Gravel |
20 |
-- |
1.20×10⁻⁴ |
0.35 |
35 |
20 |
|
5 |
Shell |
21 |
-- |
1.69×10⁻³ |
0.20 |
38 |
19 |
|
6 |
Random Fill |
17 |
-- |
1.10×10⁻⁵ |
0.25 |
56 |
19 |
Table 3. Physical model
|
Parameters |
Value (cm) |
|
Crest level of the dam |
40 |
|
Width of the crest |
3 |
|
Core |
Central |
|
Core level |
39.3 |
|
Core top width |
1.25 |
|
Core base width |
4.375 |
|
Water level (Max) |
37.5 |
Table 2 shows the properties of materials of Makhool dam.
Simulation of physical model by using the scale 1/400 that fit with dimensions of the container as shown in Table 3.
Shaking table:
shaking table with dimensions (170×150) cm, motor of shaking table Servo Drive Model with properties as shown in Figure 3:
Figure 3. Shaking table with container
Figure 4. System of shaking table
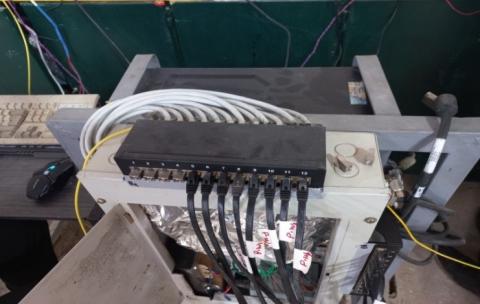
System of shaking table that include: Acquisition digital record system, computer system and motor operation system as shown in Figures 4-6.
Figure 5. Sensors
Figure 6. Operation system of shaking table
Figure 7. Nodes of dynamic analysis
Dynamic analysis
Dynamic analysis is done shaking table. In this analysis, only the horizontal component of motion is assumed to be taken with three values 0.04g, 0.06 g and 0.08 g, each value is taken for times 10 sec
It will be taken the nodes 1, 2 for making comparison between them for different computed parameters as shown in Figure 7.
Results include the X-acceleration, displacement and pore-water pressure for node 1 and 2 as above in Figure 7.
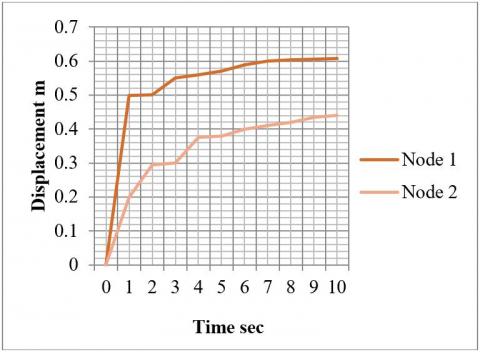
Displacement for node 1 and 2 as shown in Table 4:
Table 4. Max x-displacement
|
Earthquake Value (g) |
Max X-Displacement of Node 1 (m) |
Max X-Displacement of Node 2 (m) |
|
0.04 |
0.600 |
0.400 |
|
0.06 |
0.608 |
0.440 |
|
0.08 |
0.612 |
0.480 |
Figure 8. Displacement of 0.08 g
Figure 9. Displacement of 0.06 g
It was concluded from Figures 8-10 that the displacement increased with increasing the value of earthquake as G Deraa, 2019 clarified in his study that the displacement increased about 50% and also Sultanov and Umarkhonov [9] clarified that the X-displacement and Y-increasing the displacement increase with the increasing the time of earthquake.
Figure 10. Displacement of 0.04 g
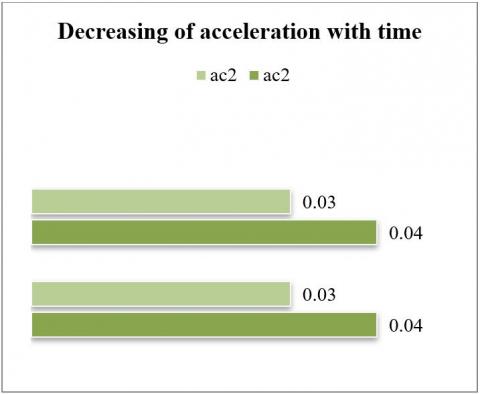
The input acceleration decreases at the end of time (10 sec):
Figure 11 shows that the acceleration decreases at the end of time from 0.08g to 0.05 g.
Figure 11. Decreasing of input acceleration
Figure 12. Decreasing of input acceleration
Figure 12 shows that the acceleration decreases at the end of time from 0.06g to 0.04 g.
Figure 13. Decreasing of input acceleration
Figure 13 shows that the acceleration decreases at the end of time from 0.04g to 0.03 g.
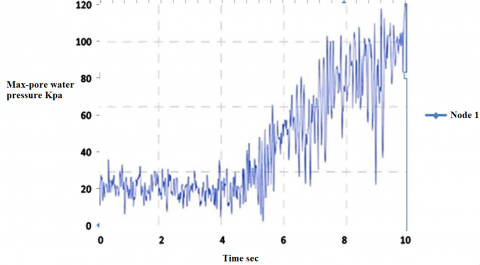
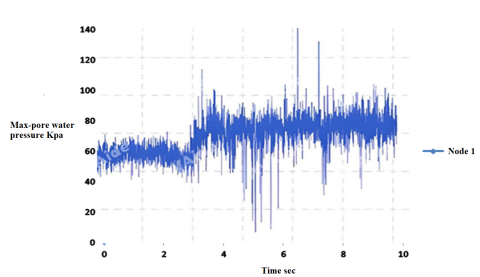
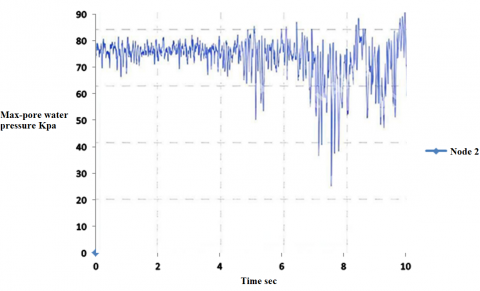
Figure 14 shows the pore-water pressure for node 1 and node 2 of three values of earthquake: the pore-water pressure of node 1 that existed at the dam base is larger than the node 2.
Figure 14. Max-pore water pressure
(a)
(b)
(c)
Figure 15. Increasing of pore-water pressure of node 1 fore (a) 0.04 g; (b) 0.06 g; (c) 0.08 g
(a)
(b)
(c)
Figure 16. Increasing of pore-water pressure of node 2 fore (a) 0.04 g; (b) 0.06; g (c) 0.08 g
As Sultanov and Umarkhonov [9] clarified in his study The maximum pore-water pressure at the base is the larger and equal to 80 kPa and 110 kPa and Khattab and Khalil [10] observed that maximum pore-water pressure at the dam base and equal to 51 kPa for earthquake value 0.3 g.
Figures 15-16 show the increasing of pore-water pressure of node 1 and node 2 of three values of earthquake.
It was concluded that the increasing of earthquake value effect on the stability of the dam that expressed by pore-water pressure, acceleration and displacement.
Increasing of pore-water pressure through the core of the dam may increase the amount of the seepage through the dam body and the dam foundation, also the increasing of displacement may cause separation some part of dam materials and that that threaten the dam to fail.
[1] US Geological Survey. (2010). The science of earthquakes. http://earthquake.usgs.gov/learn/kids/eqscience.php, accessed on 3 November 2010.
[2] Roy, D., Dayal, U., Jain, S.K. (2007). IITKGSDMA guidelines for seismic design of earth dams and embankments, provisions with commentary and explanatory examples. Indian Institute of Technology Kanpur.
[3] Pelecanos, L. (2013). Seismic response and analysis of earth dams. Doctoral dissertation, Imperial College London.
[4] Narita, K. (2000). Design and construction of embankment dams. Dept. of Civil Eng., Aichi Institute of Technology.
[5] Li, L., Wang, R.Z., Sheng, J.B. (2006). Study on evaluation models of severity degree of dam failure impact. Journal of Safety and Environment, 6(1): 1-4.
[6] Mirsaidov, M.M., Toshmatov, E.S. (2023). Dynamic behavior of earth dams under different kinematic impacts. In E3S Web of Conferences, 376: 01103. https://doi.org/10.1051/e3sconf/202337601103
[7] Balmforth, D. (2021). Independent Reservoir Safety Review Report. https://assets.publishing.service.gov.uk/media/609a8fe28fa8f56a34b10ee8/reservoir-safety-review-report.pdf, accessed on 15 April 2022.
[8] Seghir, T., Fourar, A., Zeroual, A., Massouh, F. (2020). Dynamic modelling of the behaviour of the Ouarkiss earthen dam under seismic loads. GeoScience Engineering, 66(1): 40-52. https://doi.org/10.35180/gse-2020-0029
[9] Sultanov, K., Umarkhonov, S. (2023). Dynamic behavior of earth dams under short-term semi-harmonic loads. In E3S Web of Conferences, 420: 07014. https://doi.org/10.1051/e3sconf/202342007014
[10] Khattab, S.A., Khalil, A.A. (2013). Numerical modeling of pore water pressure development in MOSUL dam. Journal of Engineering and Technology, 31(4): 618-631. http://doi.org/10.30684/etj.31.4A.2
[11] Fattah, M.Y., Alwash, H.H., Hadi, S.A. (2016). Behavior of Khassa Chai earth dam under earthquake excitation. Engineering and Technology Journal, 34(15): 2784-2795. https://doi.org/10.30684/etj.34.15A.1
[12] Al-Hadidi, M.T., Abbas, I.H. (2021). Seismic performance of Al-wand earth dam: Numerical analysis. In Journal of Physics: Conference Series, 1895(1): 012015. https://doi.org/10.1088/1742-6596/1895/1/012015
[13] Sammen, S.S., Majeed, M.Q., Majeed, Q.G. (2021). Stability assessment of zoned earth dam under water particles fluidity effect: Hemren Dam as case study. Journal of Advanced Research in Fluid Mechanics and Thermal Sciences, 79(2): 27-38. https://doi.org/10.37934/arfmts.79.2.2738
[14] Deraa, M.G., Jalut, Q.H., Abbas, J.M. (2019). Numerical modeling to the dynamic response of Mindali earth dam. International Journal of Civil Engineering and Technology, 10(8): 1-11.
[15] Khalil, A. (2012). Numerical modeling of pore water pressure development within a thin clay core in an earth dam. Al-Rafadain Engineering Journal, 20(1): 93-109. https://doi.org/10.33899/rengj.2012.47163