Jessica Kanopp dos Reis*![]() | Calisa K. Lemmertz
| Calisa K. Lemmertz![]() | Felipe Roman Centeno
| Felipe Roman Centeno![]()
© 2023 IIETA. This article is published by IIETA and is licensed under the CC BY 4.0 license (http://creativecommons.org/licenses/by/4.0/).
OPEN ACCESS
A novel two-zone model has been developed to predict the smoke layer height in compartments under pre-flashover fire conditions. This model is premised on the resolution of a mass balance in the upper layer of the compartment, employing the MQH correlation to approximate upper layer temperature. Furthermore, Zukoski’s plume entrainment model is utilized to derive the mass flow rate of gases. This model aims to enhance existing methodologies for estimating smoke layer height, such as the widely recognized Zukoski's model, by accommodating vertical openings in the compartment walls and necessitating the resolution of a single differential equation. To validate its efficacy, the smoke layer heights generated by this model under varying fire scenarios were contrasted with those produced by a more intricate two-zone model (which resolves multiple differential equations) and with experimental data documented in the literature. Across all tested scenarios, the proposed model demonstrated considerable concordance with both aforementioned benchmarks. Notably, even in compartments with diverse useful areas and types of openings (window/door), the results procured using the proposed model displayed significant accuracy.
computational simulation, compartment fire, mathematical modelling, smoke layer height, two-zone model
Smoke is universally acknowledged as the predominant cause of fatalities in fire incidents, as noted by Hurley et al. [1]. Over recent years, the domain of analytical fire modelling has witnessed considerable advancements. An array of models, characterized by varying levels of complexity, have been formulated and are currently employed by fire engineers in their respective projects. Fire modelling is often utilized to evaluate the efficiency of both passive and active protection systems in the built environment.
The emergent smoke layer in a compartment fire is typically treated as a distinct control volume, characterized by uniform modelling properties such as mass, plume entrainment, density, temperature, compartment dimensions, and opening dimensions, among other factors that influence the development of the smoke layer. Two-zone models represent a secondary type of deterministic fire model, partitioning the room into a finite number of volumes or control zones. Fundamentally, zone modelling necessitates that a space, room, or compartment be bifurcated into two zones or control volumes to account for mass and energy driven by fire. Conservation equations of mass and energy are numerically solved for both zones at each time step.
A multitude of studies over time have sought to elucidate smoke movement in compartments using zone models, as evidenced by the works in references [2-7]. An advanced two-zone mathematical model was developed by Li et al. [8], incorporating the sprinkler cooling effect. Fire sprinklers, widely employed active fire protection systems, are commonly installed in commercial and industrial buildings. It is crucial to note that the smoke filling within the compartment is influenced by the sprinklers' activation due to their cooling effect, which diminishes the heat release rate and subsequently the smoke production. Li et al. [8] calculated the smoke filling time in an adjacent space under sprinkler cooling. A series of experiments was conducted to validate the model, wherein the smoke layer height was experimentically measured. The model's results exhibited significant agreement with the experimental results, indicating that the smoke filling was slower due to reduced volumetric smoke flow under sprinkler cooling.
A zone model was formulated by Yi et al. [9] to study the impact of differing positions of make-up air supply on the performance of a mechanical exhaust system in an atrium. The conservation of mass and energy were incorporated to study the smoke-filling process. Transient variations in smoke layer temperature and smoke layer height were predicted under differing fire sizes, exhaust rates, and make-up air conditions. The model's results were juxtaposed against experimental data, as well as the results from a CFD (Computational Fluid Dynamics) model, FDS (Fire dynamics simulator), and a zone model CFAST (Consolidated Fire and Smoke Transport Model). The authors inferred that the results predicted by the presented model demonstrated significant agreement with the experimental data and FDS results. However, the results predicted by the CFAST model did not correspond well with the experimental data for the scenario wherein the smoke layer interface was positioned below the air inlet.
The utility of zone models (BRANZFIRE version 2019. 1 and Zukoski’s equation) and a CFD model (FDS version 5.3) was analysed by Bong [10] to determine when the zone model approximation is valid and when the CFD model ought to be employed to predict smoke development in a compartment fire. The study [10] deduced that, in general, FDS demonstrated favourable smoke layer-height comparisons against full-scale experimental tests, albeit with a considerable uncertainty of the smoke layer height and temperature in the fire's early stages, which was reduced in its latter stages. A significant agreement in predictions from BRANZFIRE and FDS was observed for fire enclosures with instantaneous steady-state fires (no growth phase), provided the fire size and enclosure size were within a reasonable range (0.010 to 0.150). Bong [10] concluded that data reduction methods and the assessed zone models (Zukoski’s equation and BRANZFIRE) should not be employed if the fire is too diminutive relative to the enclosure size, as they would yield inaccurate predictions of the smoke layer height and average layer temperature. CFD models could be employed to investigate the specifics of the smoke properties in the early stages of growing fires, wherein the smoke transport lag and the plume effects cannot be discerned in BRANZFIRE.
In this study, a novel two-zone model is introduced for determining the smoke layer height in a compartment. The impetus for the development of this new model is the realization that, despite the widespread use of the model proposed by Zukoski [11] in the fire community and its endorsement by the renowned Handbook of Fire Protection Engineering [12], it does not account for the presence of openings in the compartment, such as doors and windows. Consequently, this research endeavours to augment the concept introduced by Zukoski [11] by considering vertical openings in the compartment. While there exist other two-zone models that already accommodate vertical openings in the compartment, they are more intricate than the model proposed by Zukoski [11], necessitating the resolution of several differential equations, as opposed to Zukoski [11], requiring the resolution of merely one. Simpler mathematical models are easier to implement and demand less computational resources, rendering them highly advantageous for engineering estimates.
Zone models represent the fire environment within an enclosure (compartment) as one or two homogeneous layers known as control volumes or zones. Generally, two zones are considered, where the upper zone, which is known as the upper layer, consists of uniform (hot) smoke gases produced by the fire, and the lower layer consists of uniform (cold) ambient gases. Most zone models are based on the same fundamental principles and assume mass and energy conservation equations applied to each zone.
The fire plume drags (entrains) the surrounding air as it rises, reducing the temperature and concentration of the combustion gases and growing their volume. This mixture of combustion products and entrained air impinges the ceiling and spread as a hot jet outward under the ceiling. When the ceiling jet reaches the compartment walls, it is deflected downwards. The hot gases in the ceiling and wall jets redistribute themselves across the upper volume of the room, and a relatively high-temperature upper layer of uniform thickness is formed.
The volume and temperature of the hot upper layer may evolve over time, but as mentioned before, the temperature in each layer is considered uniform and the interface between them is considered perfectly horizontal. In reality, this interface is not perfectly horizontal, as there will always be fluctuations due to turbulent flows between the hot (upper) and cold (lower) layers. However, as there is much less mixing at the interface than in the fire plume [13], the assumption of a perfectly horizontal interface in zone models is adequate.
To determine the time required to fill a room with the combustion products from the fire (i.e., smoke), Zukoski [11] assumed the fire was a point source of heat addition ($\dot{Q}$) and the fuel mass flow rate was neglected. The upper layer was taken as an adiabatic region and the lower boundary of this layer was considered horizontal (i.e., the upper layer is considered to have a uniform thickness). For modelling purposes, Zukoski [11] considered a room (compartment) with a small leak opening at the floor level, total compartment height (H) and a lower layer height ($\mathrm{Z}_{\mathrm{int}}$)-that is the interface height between lower and upper layers. This small leak assumption was made by Zukoski [11] to simplify the model, since it allows to neglect the pressure term of the energy equation that would have to be considered if the compartment was completely sealed. The mass flow rate through the leak opening due to the expansion of the hot gases was given by $\dot{m}_e$. The mass flow rate of the plume from the lower layer to the upper layer was given by $\dot{m}_p$.
A mathematical model to determine how the room geometry and fire characteristics influence the transient behaviour of smoke layer height, smoke temperature and smoke movement was developed by Brani and Black [12]. In relation to the reference [11], one difference of the method developed by Brani and Black [12] is that the model does not assume a constant air pressure in relation to the vertical position or time, it calculates the air in and outflow through the openings based on conservation principles and basic fluid mechanics equations. By these means, the model is capable to deal with the variation in the ventilation during the fire, as it would happen if a door or window fail during the fire. The mass, energy and momentum conservation equations are applied in the upper (zone 2) and lower (zone 1) layers, thus being used to determine the mass flow of air and smoke through the opening, the temperatures of the two zones, the vertical pressure profiles in each zone and also the smoke layer height.
2.1 New model development
One way to break down the fire analysis into a compartment is with the staged fire analysis, observing the entry and exit of mass through the compartment openings as the fire progresses. The mass flows, in turn, depend on the pressure differences at the opening. Thus, one has [1]:
Stage A: In the first stage of the fire, the internal pressure is greater than the external pressure of the compartment. This is due to the expansion of hot gases, which have a greater volume than cold gases.
Stage B: Stage B only lasts a few seconds and is often ignored. The smoke layer has just reached the top of the vent and hot gases have started to come out.
Stage C: In this stage, hot gases flow through the top of the opening and mass balance requires that cold gases of equal mass flow into the compartment through the bottom of the opening. In stage C, air enters because of the pressure difference, which is the differential of stage B. This stage can last for a considerable time, until the room is completely filled with smoke or until a flashover occurs.
Stage D: This stage is often referred to as the "well mixed" stage, where the compartment is filled with smoke that is assumed to be well mixed, i.e., assumed to have some unique average temperature.
In this article, a two-zone model was developed in order to estimate the transient smoke layer height in a compartment during the stratified fire stage (pre-flashover- Stage C), taking into account the flow of gases through vertical openings.
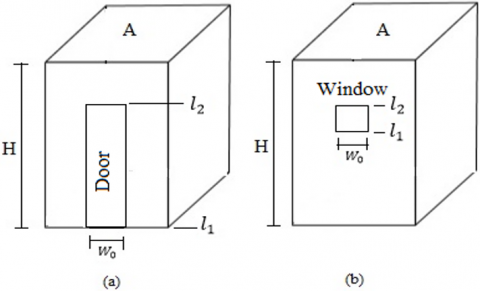
Figure 1 shows the characteristics/divisions analysed in a two-zone model, where the height Zn is the location of the neutral pressure plane. The gas above Zn is flowing from the compartment to the surroundings (smoke outflow), while the gas below Zn is flowing into the compartment (ambient air inflow). In the present model, smoke exits through the vertical opening (illustrated at the left boundary in Figure 1 (a)). The lines of static pressure as a function of the compartment height (z) are sketched on Figure 1 (b).
Figure 1. (a) Representation of the smoke layer under a horizontal ceiling; (b) Vertical pressure profiles
In the zone 2 (the upper layer, above the smoke layer interface) there is a bidirectional flow pattern at the vertical opening. The amount of air and smoke in each direction depends on the air pressure difference that exists across the vent. For the flow entering zone 1 (the lower layer, below the smoke layer) and zone 2, the temperature and pressure of the entering air are assumed to be those of zone 1 and zone 2, respectively. In the model proposed here, the mass balance in the hot upper layer is solved, as given by the following equation:
$\frac{d m_{u l}(t)}{d t}=\frac{d\left(\rho_{u l} D A\right)}{d t}=\dot{m}_p(t)+\dot{m}_{i n, u l}(t)-\dot{m}_{o u t, u l}(t)$ (1)
where, $\rho_{u l}$ is the density in the upper layer ($\mathrm{kg} / \mathrm{m}^3$), determined as $\rho_{u l} \cong \frac{348}{T_{u l}}$ [13], D is the thickness of the upper layer ($D=H_c-Z_{i n t}$) (m), Tul is the upper layer temperature (K), Hc is the ceiling height (m), A is the area (m²), $\dot{m}$ is the mass flow rate (kg/s) and the subscripts ul, p, in and out, represent respectively, the upper layer, plume, inflow and outflow.
The plume entrainment model developed by Zukoski [11] was used to calculate the plume mass flow rate, $\dot{m}_p$. This expression is given by:
$\dot{m}_p(t)=0.21\left(Q^*(t)\right)^{1 / 3} \rho_{b l} \sqrt{g Z_{i n t}} Z_{i n t}^2$ (2)
where,
$Q^*(t)=\frac{\left(1-\lambda_r\right) \dot{Q}(t)}{\rho_{b l} c_p T_{b l} \sqrt{g Z_{i n t}} Z_{i n t}^2}$ (3)
where, $T_{b l}$ is the temperature (K) in the lower layer, $c_p$ is the specific heat of the cold air at constant pressure (J kg-1 K-1), $\rho_{b l}$ is the density in the bottom layer (kg m-3), g is Gravitational constant (m s-2), $\lambda_r$ is is the fraction of energy radiated from the fire, and $\dot{Q}(t)$ is the heat release rate (kW).
An important difference between the proposed model and the model developed by Zukoski [11], is that the present model applies the mass balance to the upper layer (Eq. (1)), while the model developed by Zukoski [11] does it to the lower layer. The mass balance in the upper layer allows the proposed model to consider smoke flow out through openings, while a mass balance in the lower layer does not allow, this as the lower layer is constituted only by cold air. So, when the mass balance is applied to the lower layer, all the smoke produced is accumulated inside the compartment, there is no smoke leaving the compartment through existent openings. This can be an unrealistic situation, since in real fires, whenever there is an opening; the smoke will escape through it as soon as it reaches the top pf the opening, which in turn, will reduce the smoke thickness. That is the main advantage of the proposed model, allowing openings to be considered without increasing the level of modeling complexity. Other zone models that consider vertical openings have to solve four differential equations (i.e., mass and energy for each layer), while the proposed model solves only one differential equation (i.e., the mass balance in the upper layer).
To estimate the upper layer temperature in the proposed model, the well-known and widely applied MQH correlation [14] was used. This correlation was selected to estimate the upper layer temperature due to its easy applicability. The MQH correlation [14] is a semi-empirical correlation derived from an energy balance on the well-stirred gas layer in the upper portion of the room, and is given by:
$T_{u l}=T_{a m b}++480\left(\frac{\dot{Q}}{\sqrt{g} \rho_{a m b} c_p T_{a m b} A_o \sqrt{H_o}}\right)^{\frac{2}{3}}\left(\frac{h_k A_T}{\sqrt{g} \rho_{a m b} c_p A_o \sqrt{H_o}}\right)^{\frac{-1}{3}}$ (4)
where, $T_{a m b}$ is the ambient temperature (K), g is gravitation constant (m s-2), $\rho_{a m b}$ is the density of the ambient air (kg m-3), $A_o$ is the opening area (m²), $H_o$ is the opening height (m), $h_k$ is the effective heat transfer coefficient ($\mathrm{kW} / \mathrm{m}^2$) described in reference [14] and $A_T$ represents the surface area of the compartment boundaries, disregarding the opening area ($A_T=A_{\text {walls }}+A_{\text {floor }}+A_{\text {ceiling }}-A_0$).
The vertical velocity of the plume ($u_v$) is determined according to Eq. (5) [15]:
$u_v=\frac{5}{6}\left(\frac{9}{10 \pi \alpha^2}\right)^{\frac{1}{3}} g^{\frac{1}{3}}\left(\rho_{a m b} c_p T_{a m b}\right)^{\frac{-1}{3}}\left[\pi u\left(\frac{6 \alpha}{5} Z_{i n t}\right)^2 c_p\left(\rho_{a m b}-\rho\right) T_{a m b}\right]^{\frac{1}{3}} Z_{i n t} \frac{-1}{3}$ (5)
where, α is the entrainment coefficient (-), u is vertical speed (m s-1) and $Z_{\text {int }}$ layer height (m).
Correlations to quantify the ceiling jet velocity in the radial direction (parallel to the ceiling) were developed by Cui et al. [16]. The correlations for the maximum ceiling jet velocities are [16]:
$U_r=0.947\left(\frac{\dot{Q}}{H}\right)^{1 / 3}$ for $r / H \leq 0.15$ (6)
$U_r=0.197 \frac{(\dot{Q} / H)^{1 / 3}}{(r / H)^{5 / 6}}$ for $r / H>0.15$ (7)
where, r is the distance from the plume centerline axis to the point at which we wish to examine the ceiling jet properties is denoted r and is given in (m), and H is the height of the compartment. The pressure profiles and flows through the openings were estimated through the following equations. Outside the compartment, the hydrostatics law reveals a linear decrease in static pressure as a function of height:
$P_{a m b}(z)=P_{r e f}-\rho_{a m b} g\left(Z_{i n t}-Z_{r e f}\right)$ (8)
Inside the compartment, in the lower layer region, the classic assumption is that the temperature is equal to the ambient temperature [14]. In a compartment with a vertical opening, the pressure difference between the upper layer and the external environment for the smoke outlet is not constant, as illustrated in Figure 1 (b). Rather, the pressure difference evolves as:
$\Delta P_{u l}(z)=\left(\rho_{a m b}-\rho\right) g\left(Z_{i n t}-Z_n\right)$ (9)
From Eq. (8), the mass flow rate of smoke out of the vent can be calculated as an integral [8]:
$\dot{m}_{\text {out }, u l}=C_{d, o u t} \int_{Z_n}^{H_0} \rho_{u l} v(z) W_0 d z$ (10)
where, $H_0$ denotes the height of the opening (m), $W_0$ is the width of the opening (m), $C_{d, out}$ is the flow coefficient outside the compartment (-) and $\rho_{u l}$ represents the density of the gases in the upper layer of the compartment.
According to the Bernoulli equation, there is a relationship between velocity and pressure differences along a flow line:
$p+\frac{1}{2} \rho v^2+\rho g Z_{\text {int }}=constant$ (11)
The smoke velocity at the opening as a function of height, v (z), is the given by (Eq. (11) and Eq. (12)) [13]:
$v(z)=\sqrt{\frac{2 \Delta P(z)}{\rho_{u l}}}=\sqrt{2\left(\frac{\rho_{a m b}}{\rho_{u l}}-1\right) g\left(z-Z_n\right)}$ (12)
Therefore, by replacing Eq. (12) in Eq. (10) and solving the integral, we obtain:
$\dot{m}_{\text {out }, u l}=\frac{2}{3} \rho_{u l} W_0 C_{d, \text { out }} \sqrt{2\left(\frac{\rho_{a m b}}{\rho_{u l}}-1\right) g}\left(H_o-Z_n\right)^{2 / 3}$ (13)
Note that Eq. (13) is used in the present model to obtain the last term of Eq. (1).
For compartments where the openings` air inflow and smoke outflow are not infinitely large, there is a loss of pressure to the incoming air as it flows through the opening. This pressure difference is given by:
$\Delta P_{u l}(z)=\left(\rho_{a m b}-\rho_{u l}\right) g\left(Z_n-\left(H_c-D\right)\right)$ (14)
Thus, the mass flow rate of air into the upper layer is given by:
$\dot{m}_{i n, u l}=C_{d, i n} \rho_{a m b} \sqrt{2\left(1-\frac{\rho_{u l}}{\rho_{a m b}}\right) g\left(Z_n-\left(H_c-D\right)\right)}\left(H_c-D\right) W_0+C_{d, i n} \int_{H_c-D}^{Z_n} \rho_{a m b} \sqrt{2\left(1-\frac{\rho_{u l}}{\rho_{a m b}}\right) g\left(Z_n-Z_{i n t}\right)} W_0 d z$ (15)
For quasi-permanent conditions, the mass balance at the opening of the compartment is given by:
$\dot{m}_{\text {out }, u l}=\dot{m}_{i n, u l}+\dot{m}_{i n, b l}$ (16)
where, $\dot{m}_{o u t, u l}$ is the mass flow rate of smoke leaving the compartment, $\dot{m}_{i n, u l}$ is the mass flow rate of fresh air entering the upper layer, and $\dot{m}_{i n, b l}$ is the mass flow rate of fresh air entering the lower layer.
Substituting Eq. (13) and Eq. (15) in Eq. (16), we have Eq. (17), which is solved to obtain the height of the neutral plane, Zn, along with Eq. (13):
$\begin{aligned} & \dot{m}_{\text {out }, u l}=\frac{2}{3} \rho_{u l} W_0 C_{d, o u t} \sqrt{2\left(\frac{\rho_{a m b}}{\rho_{u l}}-1\right) g}\left(H-Z_n\right)^{\frac{2}{3}}=C_{d, i n} \rho_{a m b} \sqrt{2\left(1-\frac{\rho_{u l}}{\rho_{a m b}}\right) g\left(Z_n-\left(H_c-D\right)\right)}\left(H_c-D\right) W_0 \\ & +C_{d, i n} \int_{H_c-D}^{Z_n} \rho_{a m b} \sqrt{2\left(1-\frac{\rho_{u l}}{\rho_{a m b}}\right) g\left(Z_n-Z_{i n t}\right)} W_0 d z \\ & \end{aligned}$ (17)
The heat release rates $\dot{Q}$ (in kW) from compartment fires were modelled by a $t^2$-transient fire curve [2, 16, 17] at the beginning of the smoke-filling calculations, and then, after a specified time $t_s$, they were treated as constant rates:
$\dot{Q}=\left\{\begin{array}{c}\varepsilon t^2 t<t_s \\ Q_o t \geq t_s\end{array}\right.$ (18)
where, $\varepsilon$ is the growth factor (specified according to the growing velocity of a fire: slow, medium, fast, and ultra-fast growth), $Q_o$ is the heat release rate during constant burning, and $t_s$ is the transition time from the t²-fire growth to constant fire burning (s) $\left(t_s=\left(\frac{Q_o}{\varepsilon}\right)^{1 / 2}\right)$ (data from Eq. (18)).
The proposed model was tested by comparing its results to the results obtained through other two well-established zone models: the widely used model developed by Zukoski [11], which do not account for vertical openings, and a more detailed model [12], which accounts for vertical openings, but requires the solution of 4 differential equations. Additionally, the obtained results from the proposed method were compared to experimental results available in the literature to assess the applicability and validity of the method for different fire scenarios.
3.1 Verification: Comparisons with other zone models
Similarly, to what has been done by Brani and Black [12], a standard set of conditions corresponding to a specific room geometry, initial air properties, and fire characteristics were established to be used for the comparison between the different methods results. Figure 2 presents the room geometry and the established standard conditions can be found in Table 1.
In Table $1, T_{a m b}$ is the ambient temperature $(\mathrm{K}), P_o$ is the initial pressure $(\mathrm{Pa}), A$ is the compartment floor area $\left(\mathrm{m}^2\right)$ (the compartments have a square floor area), $l_1$ is the height of the bottom of the opening in relation to the floor $(\mathrm{m}), l_2$ is the maximum height of the top of opening (m), $W_0$ is the width of the opening (m) and the maximum heat release rate in this compartment is $\dot{Q}=2880 \mathrm{~kW}$.
In the present work six cases are considered for the verification of the new model, as described in Table 2.
Figure 2. Schematic representation of the room with an opening like: (a) Door; (b) Window
Table 1. Initial conditions, geometry and fire characteristics [13]
|
Air Properties |
Compartment Geometry |
Fire Characteristics |
|
$T_{a m b}$=298K
$P_{r e f}$=101300Pa |
H=2.5m A=20-60m² $W_0$=0.5m $l_1$=0-1.70m $l_2$=0.80-2.50m |
$\dot{Q}=\varepsilon t^2$
$\mathcal{\varepsilon}$=0.05kW/s² |
Table 2. Studied cases [12]
|
Cases |
A (m2) |
l1 (m) |
L2 (m) |
W0 (m) |
$A_0 \sqrt{H_0}\left(m^{5 / 2}\right)$ |
|
1 |
20 |
0 |
2 |
0.5 |
1.4414 |
|
2 |
40 |
0 |
2 |
0.5 |
1.4414 |
|
3 |
60 |
0 |
2 |
0.5 |
1.4414 |
|
4 |
40 |
0 |
0.8 |
1 |
0.715 |
|
5 |
40 |
0.85 |
1.65 |
1 |
0.715 |
|
6 |
40 |
1.7 |
2.5 |
1 |
0.715 |
In the present model, the upper layer temperatures were obtained using the correlation in Eq. (4), developed by Li et al. [8], and compared to the results presented by Brani and Black [12]. As the results were consistent to what was expected, the study was continued with the analysis of mass flow rates and smoke layer heights.
Figure 3 shows transient curves of the mass flow rates of smoke exiting through the compartment opening, obtained by applying the proposed model and the model developed by by Brani and Black [12] for cases 1 and 5 (Table 2). All six tested cases presented good agreement between the proposed model and the more detailed model results [12], despite Figure 3 shows only results for cases 1 and 5 for the sake of brevity.
Figure 3. Smoke mass flow rates for (a) cases 1 and (b) case 2, comparing the results of the model [13] and the developed model
From the comparison between the results obtained from cases 1-3 for the mass flow rates, it was observed that for the same opening characteristics, when the floor area is increased, a longer time is required for the smoke to start flowing out the compartment. This was an expected result since the top of the door is in the same height for all the 3 cases and in the cases with a larger floor area there is a larger volume (space) above the top of the door that must to be filled with smoke before the top of the door is reached by the bottom of the smoke layer, which requires a longer time. For this same reason, the time-gradient of mass flow rate of smoke was steeper for smaller compartment floor areas.
The vertical location and the size of the room openings greatly influence the transient behaviour of the room temperature, the smoke layer height, and the movement of smoke within a room. This can be observed comparing the results of cases 4-6, that present the same floor area and ventilation factor, but the opening is placed at different heights of the wall. For example, case 4 presents the opening in a lower position (closer to the floor), the smoke takes a longer time to reach the top of the opening and to start to flow out the compartment. Additionally, an opening located closer to the ceiling (case 6) will reduce smoke build-up within the compartment as compared to the same sized opening located closer to the floor; this happens since, as soon the smoke reaches the top of the opening, it starts to flow out, reducing the smoke build-up inside the compartment.
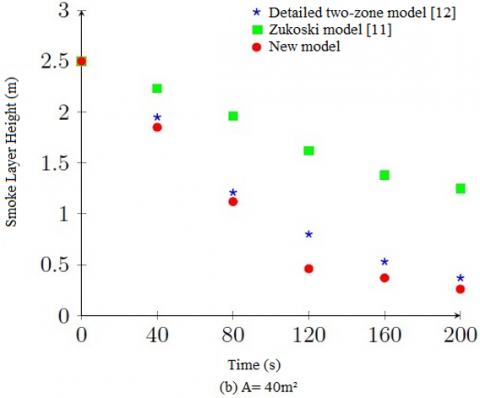
Figure 4 shows the comparison of the smoke layer height as a function of time obtained by the models proposed by Zukoski [11], Brani and Black [12] and the model proposed in the present work for the cases 1 and 5 (Table 2).
A good agreement between the new model and the model proposed by Brani and Black [12] (reference model) was observed for all tested cases, as can be seen in Figure 4 for cases 1 and 5. The smoke layer height obtained using the model proposed by Zukoski [11] did not show a good agreement when compared to the two-zone models that take into account the vertical openings.
Figure 4. Smoke layer height for cases 1 and 5, comparing the three highlighted models
From Figure 4, one can notice a decrease in the smoke layer height over time, which is expected, since the smoke layer is building up with time.
It is possible to notice that in case 1 (Figure 4 (a)), up to 160s, the height of the smoke layer according to Zukoski’s model [11] was higher than the one obtained through the other models and, after 160s there was an inversion of this behaviour, with the model [11] presenting smaller values for the smoke layer height. A possible reason for this inversion in the behaviour is the fact that the model [11] considers only small leaks instead of openings (door or window), so the smoke keeps building up at a quite constant rate, while for the models that consider openings, the natural exhaustion of smoke through the openings after the smoke interface reaches the top of the opening reduces the smoke build-up, especially for the door cases.
The absolute relative deviation between the results obtained from the different models can be calculated for each time step using Eq. (19).
$D R M=100 . \frac{|V O-V B|}{V B}$ (19)
where, VO is the value obtained at each time step by the model that is being compared to the reference model (model developed by Zukoski [11] or the newly proposed model), and VB is the value obtained at each time step by the reference model (model developed by Merci and Beji [13]). The DRM is calculated at each time step and, after that, the average of all time steps is performed.
Calculating the averaged absolute relative deviation for the case 1 we obtained 26.51% using the model proposed by Zukoski [11] and 6.38% for the newly developed model. So, a quantitative improvement of the proposed model can be noticed in relation to the model of reference [11].
For case 5 (Figure 4 (b)) there is good agreement of results when comparing the proposed model to the model of reference [12], for all the studied time interval. The averaged absolute relative deviation of the smoke layer height for case 5 is 96.17% when applying the model proposed by Zukoski [11] and 19.15% for the proposed model. Analysing the result presented using the model developed by Zukoski [11] it was expected that the smoke layer would grow faster since this model do not consider vertical openings, however, the model of reference [11] is showing a slower growth of the smoke layer. As the model developed by Zukoski [11] did not show compatible results with the physics of the problem (considering that it assumes that there are no vertical openings), this can be considered an aspect to be improved in the model [11], which in turn is the objective of the new model.
In case 5, where there is a window instead of a door, the results of the developed model are considered good, with just small variations when compared with the result obtained by Brani and Black [12]. It should be noted here that the results of the newly proposed model provide a lower smoke height, which means, it is a model with conservative results, therefore, favours fire safety.
3.2 Comparison to experimental data from literature
The objective of this subsection is to evaluate the performance of the proposed model on estimating the smoke layer height. Zukoski [11]. The results of the smoke layer height over time for different fire scenarios were compared. Three different experimental cases are used to test the models: a multiple compartment [3], an atrium [6] and a single compartment [18].
3.2.1 Building with multiple compartments [3]
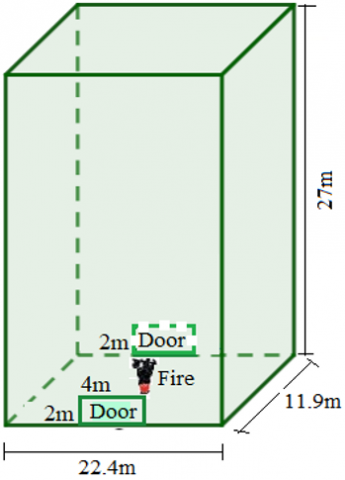
Full-scale experiments were performed by Lai et al. [3] in a structure with 3 rooms and a shaft, to represent a building. In the present work, only the smoke layer height data obtained for Room 1(fire room) is considered. Room 1 dimensions are 5.4m (L)×5.4m (W) and 3.0m (H) and it has two opposite doors (openings), both with dimensions 2.0m (H)×0.8m (W). One of the doors is connected to the outside of the building, while the other is connected to room 2. Wind conditions were stagnant. The compartment geometry can be seen in Figure 5.
Lai et al. [3] performed eight experiments in their work. The experimental scenario chosen here is the number 0-1-C. This experiment considers that vent 1, which connects the room 2 to the shaft is closed (not shown in Figure 5). The aim of this experiment was to understand the smoke dynamics when a fire started in room 1 [3].
The fire source used in the experiments was a 26cm diameter pan of unleaded gasoline with a heat release rate of 50kW and the initial ambient temperature for this experiment was 27℃.
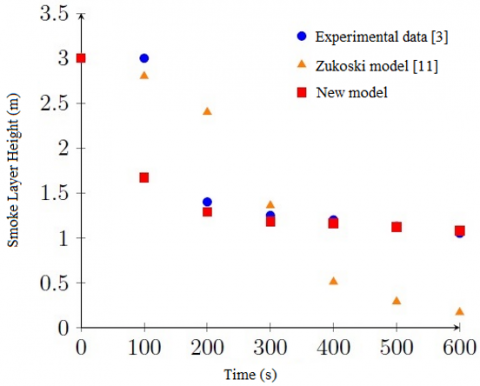
In Figure 6 the smoke layer height results as a function of time obtained through the model developed by Zukoski [11] and the model developed in this paper, being compared to the experimental data from Lai et al. [3].
Figure 5. Dimensions of the building with multiple compartments and the room under study (room 1)
Figure 6. History of smoke layer heights for room 1 in the multi-compartment case
The transient smoke layer height result obtained through the model of Zukoski [11], diverged significantly from the experimental data, presenting significantly higher values for the time 200s and then significantly lower values after 400s. Meanwhile, the newly proposed model presented very close results to those reported in the experimental data, for most of the time steps. The results obtained using the new model show a smaller smoke layer height up to 100s of simulation, this means that the smoke layer was built up faster than in the actual experiment, however, after that, the results become very similar to the experimental ones, and the model was capable to accurately predict the smoke layer height. This faster build-up of the smoke layer in the proposed model compared to experimental results may be related to the assumed growth of fire used in the simulations that was probably faster than in the experiments.
3.2.2 Atrium
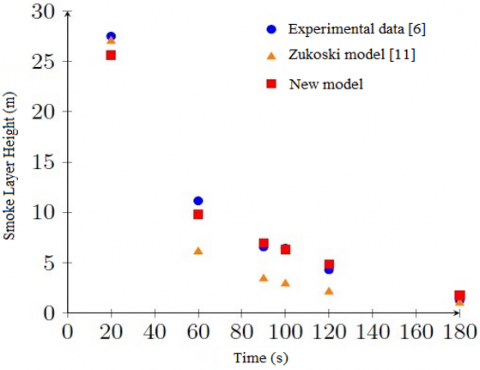
Experiments performed in the PolyU/USTC atrium were used by Qin et al. [6] to validate an FDS model used to study the smoke movement in an atrium under fire scenario. The geometry of the atrium facility is presented in Figure 7. The atrium had two opposite-side doors with dimensions 4m (W)×2m (H). The initial ambient temperature of the experiment was 18℃. The fire source was an oil burner, with heat release rate of 560kW, placed at the centre of the atrium floor.
Figure 8 presents the smoke layer height time curve obtained through the model developed by Zukoski [11] and the two-zone model developed in the present work, compared to the experimental data from Qin et al. [6].
Figure 7. Atrium dimensions
Figure 8. History of smoke layer heights for the Atrium
As discussed before, the model developed by Zukoski [11] assumes only a small leak at the compartment floor level, as well as it is in the case of this atrium, where both openings are very small compared to the size of the compartment (as the opening area is 16m² and the volume of the compartment is 7197.12m³), and as they are placed near the atrium floor, the assumption made in the model of Zukoski [11] seems to be adequate and the results obtained represent quite well the experimental data, much better than the other assessed fire scenarios. It is important to notice that in the atrium scenario, the compartment doors are only 2m high and for this reason, the smoke layer reaches the top of the door and starts to flow out only at the end of the experiment.
This improvement in the quality of the results obtained through the model of reference [11] may also be expected for cases in which the compartment volume is much higher in relation to the compartment opening, even if the opening is not located near the floor.
Note that the Smoke layer height results obtained through the newly proposed model are in a good agreement with the experimental data, showing a much better prediction of the smoke layer height compared to the Zukoski’s model [11] so far. Quantitatively speaking, Table 3 shows that the Time-averaged relative absolute deviation for the proposed model in relation to the experimental data were much lower than the deviations observed for the model proposed by Zukoski [11]. For example, for the Multiple compartment case, the deviation presented by the proposed model was 9.25%, while for the same case, the deviation of the model proposed by Zukoski [11] was 43.21%. From these results, we can conclude that for the two scenarios investigated so far (i.e., compartments with smaller dimensions, representative of residential rooms, and larger compartments, with a big volume that takes time to be filled with smoke and with openings considered small compared to the volume of the compartment), the proposed model was capable to provide better predictions of the smoke dynamics relatively to Zukoski’s model [11].
3.2.3 Compartment T-2 [18]
Fifteen sets of full-scale compartment experiments were performed by Alpert [15]. The compartment dimensions were $5.6 \mathrm{~m}(\mathrm{~L}) \times 5.6 \mathrm{~m}(\mathrm{~W}) \times 6.2 \mathrm{~m}(\mathrm{H})$, and had an opening at floor level, $0.35 \mathrm{~m}\left(W_0\right)$ and $0.25 \mathrm{~m}\left(H_0\right)$, with no forced smoke extraction system [10], The room geometry is depicted in Figure 9.
The fire source was a kerosene pool fire and $\dot{Q}$ was varied for the different tests. The temporal variation of $\dot{Q}$ was not reported, and only its maximum was reported, so, in the present work, a constant release rate of $195 \mathrm{~kW}$ is used.
Figure 9. T-2 compartment geometry
Figure 10. History of smoke layer heights for case T-2
Figure 10 shows the smoke layer height time curve obtained through the model of reference [11] and the new model, compared to the experimental data for the compartment case T-2 [18-20] (data reported by Yi et al. [9]). Figure 10 shows a reasonably good agreement when comparing the experimental data to both models, with the newly proposed model showing more accurate results for the initial simulation times. In the result obtained, the model of reference [11] presented smaller smoke layer heights for all the simulation interval compared to the experimental data, while the proposed model presented closer results until around 60s, and then also presented smaller smoke layer heights.
3.3 Characteristics of the compartments and models’ results
A smoke layer height study ass carried out in Section 3.2 for different configurations of compartments using the Zukoski’s model [11] and the model proposed in the present article. The calculation of the time-averaged relative absolute deviation of smoke layer height results in relation to the experimental measurements (using Eq. (19) taking VB as the experimental value obtained at each time step provided by each experimental work) is now analysed, as shown in Table 3.
As can be seen through the results presented in Table 3, the newly proposed model presented a better agreement with the experimental data than the model of reference [11] for all three scenarios assessed. Note that Zukoski’s model [11] presented slightly better results for the scenarios of the Atrium and Compartment T-2 than for the scenario of the multi-compartment. This is related to the fact that in these two scenarios the openings are very small compared to the size of the compartment and are placed at the floor level. This is a good approximation to the assumption made by Zukoski [11], where only small leaks at the floor level are considered instead of openings.
Table 3. Time-averaged relative absolute deviation for Zukoski’s model [11] and the newly developed model
|
Compartment |
Models |
Time-Averaged DRM |
Volume (m³) |
|
Multi compartment
Atrium Compartment T-2 |
Zukoski [11] New Model Zukoski [11] New Model Zukoski [11] New Model |
43.21% 9.25% 36.71% 12.26% 36.33% 25.6% |
87.48
7197.1
194.4 |
Table 4. Compartment geometrical characteristics
|
Compartment |
A0 (m²) |
$\mathbf{A}\left(\mathbf{m}^2\right)$ |
$A_0 / A_p$ |
$A_0 \sqrt{H_0}\left(m^{5 / 2}\right)$ |
|
Multi-compartment |
3.2 |
29.16 |
0.0199 |
4.52 |
|
Atrium |
16 |
266.5 |
0.0086 |
22.62 |
|
Compartment T-2 |
0.0875 |
31.36 |
0.0006 |
0.04 |
Table 5. Ratios between A/H, A0/V, L/W, L/H, W/H and H0/H
|
Compartment |
A/H |
Ao/V |
L/W |
L/H |
W/H |
H0/H |
|
Multi-compartment |
9.72 |
0.0366 |
1.48 |
2.66 |
1.8 |
0.67 |
|
Atrium |
9.87 |
0.0022 |
0.83 |
1.88 |
0.44 |
0.07 |
|
Compartment T-2 |
5.05 |
0.0005 |
1 |
0.90 |
0.90 |
0.04 |
For the newly developed model, we can see from Table 3 that it performed better for the multi-compartment scenario, followed by the Atrium scenario and the Compartment T-2. The time-averaged DRM values obtained for the Multi-compartment and the Atrium scenarios were similar. It can be related to the fact that the proposed model considers openings (and Zukoski's model only considers a small leak). In this manner, no conclusions relating directly the volume of the compartment to the accuracy of the models could be drawn.
Table 4 shows the main geometrical characteristics of each compartment, such as: the area of the openings (Ao), the area of the wall (Ap), the floor area (A) and the ventilation factor ($A_0 \sqrt{H_0}$). Table 4, presents a ratio between the ventilation factor and, comparing the three analyzed experimental cases, better results are obtained in the multiplecompartment and atrium, which can be explained by making a ratio between the area of the opening and the area of the walls of the compartment, which can be seen that this ratio is lower in the compartment T2 case (ratio of 0.0199 for the multiple compartments, 0.0086 in the atrium and 0.00063 for the compartment T2 case). Table 5 presents some ratios that may help to establish when the models work better.
The basic assumption of all fire zone models is that each compartment can be divided into a small number of control volumes, each with uniform temperature and composition. This assumption of uniform layers is considered to be true when the ratio between the compartment width (W), length (L) and height (H) is low [18]. As stated in reference [9], for considering a zone model applicable to a compartment, it is recommended that its ratios are L/H≤3 and L/W≤3, which are in agreement with the compartments analysed in this paper, as shown in Table 5.
Comparing the time-averaged DRM values for the proposed model to the ratio between the compartment floor area and the compartment height (A/H), we can draw an important conclusion. As we can see, the smallest time-averaged DRMs were obtained for the largest A/H ratios. And as can be seen, both the ratio A/H and the time-averaged DRMs were close for the multi-compartment and atrium scenarios. This indicates that the new model may lead to better results when applied to compartments with higher A/H ratios.
Looking closely at the ratio between the opening height and the compartment height (Ho/H), we can see that the model of [5] performed a bit better for the cases with low ratios Ho/H. Comparing the time-averaged DRM and this ratio, it is noted that the atrium and the T-2 compartment presented very close deviations and also ratios in the same order of magnitude. This may indicate that for compartments with a smaller H0/H ratio, the model of reference [5] may perform slightly better. However, this affirmative may be only valid when the opening is positioned close to the floor. Except from the multi-compartment scenario, the compartment openings are reasonably small when compared to the size of the compartment, so they are considered small openings, placed at the floor level (which is similar to the leaks considered in the model by Mowrer [5]), thus, the model of reference [5] may perform better for large volume compartments, when the openings are near the floor.
It can also be stated that the newly proposed model presented very good results (qualitative and quantitative) for all tested compartments, such as typical residential buildings and small offices (small compartment volumes and typical openings), and large industrial environments and shopping centres (large compartment volumes and high storeys), while the model of reference [5] presented better results only for compartments characteristic from industrial environments and shopping centres.
This work aimed to present a new two-zone model to determine the smoke layer height (Zint) in pre-flashover compartment fires. For the development of the present model, the mass balance in the upper layer of the compartment is solved, using the following sub-models: the MQH correlation [14] to approximate the upper layer temperature, plume entrainment model [11] to calculate the mass flow rate of gases through the heated combustion zone, to determine the values of Zn and consequently Zint for each time interval.
In the present work, the two-zone model developed by Brani and Black [12] was used as a reference model to compare the results obtained by Zukoski [11] and the one developed in the present work. Additionally, the models of Zukoski [11] and the newly proposed model were compared with different sets of experimental data available in the literature, with the purpose of evaluating the performance of the models. Among the analysed scenarios, there were compartments with different types of openings (windows and doors of several sizes), different floor areas, different opening positions and different heat release rates.
With the newly developed model, a good agreement was obtained with the results presented by Brani and Black [12]. The smoke layer height profile presented using Zukoski’s model [11] did not show a good agreement when compared with the other two two-zone models, since Zukoski [11] does not consider openings in the compartments (doors and windows) in its model. Analysing the experimental scenarios, even for compartments with different geometrical characteristics (from office-like compartments to atrium-like compartments), the new model presented a good agreement with the experimental data, showing a better prediction capacity than the model developed by Zukoski [11] for all the studied scenarios. The improvement of the proposed model predictions compared to the model proposed by Zukoski [11] was quantified through the time-averaged DRM (Eq. (19)). For the multiple-compartment scenario the time-average DRM for the proposed model was 9.25%, while for the Zukoski’s model [11] was 43.21%. For the atrium scenario the proposed model presented a time-average DRM of 12.26% compared to 36.71% for the other model, and for the compartment T-2 scenario, the proposed model resulted in a time-average DRM of 25.6%, compared to 36.33%. So, as can be concluded through these results, there was a significate improvement in the predictions made by the proposed model compared those obtained using well-stablished model developed by Zukoski [11] for all the tested scenarios.
Several aspects were analysed during the validation of the model, to identify its applicability for different scenarios, such as the ratio between the dimensions of the compartments, the ratio between the opening area and the compartment volume, the ratio between the floor area and the height of the compartment and the ratio between the opening height and the compartment height. It was observed that the new model presented better results when applied to compartments with higher ratios between A/H, despite for all compartment’s geometrical configurations tested it performed quite well both qualitatively and quantitatively, performing better than Zukoski’s model [11].
Finally, it can be stated that the newly proposed model is a good one to estimate the transient smoke layer height in pre-flashover compartment fires being a model as easy as Zukoski’s to be used and providing more accurate results.
More accurate predictions of the smoke layer height may play a crucial role in enhancing both, the safety of individuals, and the effectiveness of firefighting and emergency response efforts in case of a fire. Accurate Smoke layer height predictions may support fire safety engineers on designing better and more efficient evacuation plans, potentially reducing injuries and fatalities. Additionally, during a fire emergency, accurate smoke layer height predictions can help firefighters to anticipate the conditions inside the building, and make decisions on if and how ventilate the building, potentially improving visibility and reducing the spread of toxic gases.
He main objective of this work was to develop a model to calculate the smoke layer height with the same low level of difficulty (to be implemented/used) as Zukoski's model [11], but allowing to consider vertical openings through which smoke can exit and fresh air ca come in the fire compartment. In the verification chapter (section 3.1) the new model is being compared to the Brani and Black’s model [12], this being a more sophisticated model (with more complicated implementation) than both, the Zukoski’s model [11] and the new model, however, it is verified here that the new model provides results very similar to those of the more sophisticated model (Brani and Black [12]).
As suggestions for future work, the model should be investigated and possibly adapted to consider horizontal openings in the ceiling, and to predict the smoke layer height in adjacent compartments.
The study was funded by the Coordenação de Aperfeiçoamento de Pessoal de Nível Superior-Brasil (CAPES) (Finance Code: 001) and CNPq/Brazil (Grant No.: 407036/2021-0).
|
Z |
Layer height, m |
|
H |
Compartment height, m |
|
$\dot{Q}$ |
Heat release rate, kW |
|
$\dot{m}$ |
Mass flow, kg s-1 |
|
ρ |
Density, kg m-3 |
|
T |
Temperature, K |
|
c |
Specific heat, J kg-1 K-1 |
|
g |
Gravitational constant, m s-2 |
|
hk |
Heat transfer coefficient, kW m-2. K-1 |
|
A |
Area, m² |
|
U |
Velocity, m s-1 |
|
D |
The thickness of the upper layer, m |
|
P |
Pressure, Pa |
|
Cd,out |
Flow coefficient outside, Cd≈0.6–0.7 |
|
W0 |
Width of the opening, m |
|
Ao |
Opening area, m² |
|
Ho |
Opening height, m |
|
AT |
Surface area, m² |
|
uv |
Vertical velocity in the plume, m s-1 |
|
v |
Velocity at the height z, m s-1 |
|
t |
Time, s |
|
ts |
Transition time, s |
|
l1 |
Minimum opening height, m |
|
l2 |
Maximum opening height, m |
|
V |
Volume, m³ |
|
L |
Length, m |
|
W |
Width, m |
|
Greek symbols |
|
|
$\alpha$ |
Entrainment coefficient |
|
ɛ |
Fire growth rate, kW s-2 |
|
Subscripts |
|
|
int |
Lower layer |
|
n |
Neutral plane |
|
amb |
Ambient |
|
p |
Plume |
|
ul |
Top layer |
|
bl |
Bottom layer |
|
r |
Radial |
|
in |
Inflow |
|
out |
Outflow |
[1] Hurley, M.J., Gottuk, D.T., Hall Jr, J.R., Harada, K., Kuligowski, E.D., Puchovsky, M., Torero, J., Watts, J., Wieczorek, C.J. (Eds.). (2015). SFPE Handbook of Fire Protection Engineering. Springer. New York.
[2] Li, Y.Z., Huo, R., Zhou, J.J., Jin, X.H., Cui, E., Chow, W.K. (1999). A study on the smoke movement in atrium fire. Fire Science and Technology, 8: 4-6. https://doi.org/10.1016/j.ssci.2011.01.001
[3] Lai, C.M., Chen, C.J., Tsai, M.J., Tsai, M.H., Lin, T.H. (2013). Determinations of the fire smoke layer height in a naturally ventilated room. Fire Safety Journal, 58: 1-14. https://doi.org/10.1016/j.firesaf.2013.01.015
[4] Zhou, Y., Meng, Q. (2017). A simple solution of the smoke filling equation. Fire Technology, 53: 1479-1484. https://doi.org/10.1007/s10694-017-0648-0
[5] Mowrer, F.W. (1999). Enclosure smoke filling revisited. Fire Safety Journal, 33(2): 93-114. https://doi.org/10.1016/S0379-7112(99)00023-5
[6] Qin, T.X., Guo, Y.C., Chan, C.K., Lin, W.Y. (2009). Numerical simulation of the spread of smoke in an atrium under fire scenario. Building and Environment, 44(1): 56-65. https://doi.org/10.1016/j.buildenv.2008.01.014
[7] Nishino, T. (2017). Two-layer zone model including entrainment into the horizontally spreading smoke under the ceiling for application to fires in large area rooms. Fire Safety Journal, 91: 355-360. https://doi.org/10.1016/j.firesaf.2017.03.049
[8] Li, S.C., Chen, Y., Li, K.Y. (2011). A mathematical model on adjacent smoke filling involved sprinkler cooling to a smoke layer. Safety Science, 49(5): 670-678. https://doi.org/10.1016/j.ssci.2011.01.001
[9] Yi, L., Chow, W.K., Li, Y.Z., Huo, R. (2005). A simple two-layer zone model on mechanical exhaust in an atrium. Building and Environment, 40(7): 869-880. https://doi.org/10.1016/j.buildenv.2004.08.018
[10] Bong, W.J. (2012). Limitations of zone models and CFD models for natural smoke filling in large spaces. Department of Civil and Natural Resources Engineering University of Canterbury Christchurch, New Zealand. http://doi.org/10.26021/2161
[11] Zukoski, E.E. (1978). Development of a stratified ceiling layer in the early stages of a closed‐room fire. Fire and Materials, 2(2): 54-62. https://doi.org/10.1002/fam.810020203
[12] Brani, D.M., Black, W.Z. (1992). Two-zone model for a single-room fire. Fire Safety Journal, 19(2-3): 189-216. https://doi.org/10.1016/0379-7112(92)90033-9
[13] Merci, B., Beji, T. (2022). Fluid Mechanics Aspects of Fire and Smoke Dynamics in Enclosures. CRC Press.
[14] McCaffrey, B.J., Quintiere, J.G., Harkleroad, M.F. (1981). Estimating room temperatures and the likelihood of flashover using fire test data correlations. Fire Technology, 17: 98-119. https://doi.org/10.1007/BF02479583
[15] Alpert, R.L. (1972). Calculation of response time of ceiling-mounted fire detectors. Fire Technology, 8: 181-195. https://doi.org/10.1007/BF02590543
[16] Cui, E., Chow, W.K., Yuan, L.M., Li, P.D. (1998). Preliminary experimental studies on atrium smoke with a new full-scale burning facility. Eurofire, 98: 11-13.
[17] Li, Y.Z., Huo, R., Cui, E., Chow, W.K. (1999). Experimental studies on smoke filling in atria with large fire. In Proceedings of 1999 International Symposium on City Fire Safet, 99: 187-193.
[18] Hägglund, B., Jansson, R., Nireus, K. (1985). Smoke filling experiments in a 6×6×6 meter enclosure. Försvarets Förskningsanstalt.