Hari Maghfiroh![]() | Oyas Wahyunggoro*
| Oyas Wahyunggoro*![]() | Adha Imam Cahyadi
| Adha Imam Cahyadi![]()
© 2023 IIETA. This article is published by IIETA and is licensed under the CC BY 4.0 license (http://creativecommons.org/licenses/by/4.0/).
OPEN ACCESS
Mitigating pollution in the transportation sector necessitates the deployment of zero-emission solutions, such as electric vehicles (EVs). One significant challenge with EVs is the limited lifespan of the battery, a key and costly component. To circumvent this issue, a potential solution lies in the integration of batteries with supercapacitors to create a Hybrid Energy Storage System (HESS). This combination can notably decrease the peak current of the battery, thereby prolonging its lifespan, and ultimately, contributing to the long-term cost-effectiveness of EVs. A critical component of the HESS is the Energy Management Strategy (EMS), tasked with optimizing energy distribution. A Low-Pass Filter (LPF) serves as an uncomplicated, real-time EMS. The current study introduces a novel approach for determining the optimal cut-off frequency of the LPF, termed the Ragone Plot with Fine Tuning (RPFT). The Ragone plot provides a general cut-off frequency for the battery and drive cycle, while fine-tuning is employed to optimize it. Simulation results reveal that the RPFT method outperforms the Fast Fourier Transform (FFT) method, thereby proving its efficacy. The application of RPFT resulted in a reduction of battery peak current and battery current root mean square (BCRMS) by up to 29.80% and 9.99%, respectively. This study offers valuable insights for improving energy management in electric vehicles and underscores the potential of the RPFT method in extending battery lifespan and enhancing the cost-effectiveness of EVs.
electric vehicles, Hybrid Energy Storage System, energy management, low pass filter, Ragone plot
The transportation sector stands as a significant contributor to environmental pollution, accounting for 35% of carbon dioxide emissions in 2020 [1]. As a solution, the adoption of electric vehicles (EVs) has been proposed, heralding an era of emission-free transportation. However, EVs are faced with several challenges that limit their effectiveness [2]. One critical issue is the limitations of battery electric vehicles (BEVs) [3], which include: inadequate power density to serve EVs' peak load, frequent charge-discharge cycles that negatively impact battery life, and difficulties in cooling large power batteries.
To address these challenges, the implementation of a HESS has been suggested. The HESS combines various Energy Storage Systems (ESS) to offset the shortcomings of each individual system. It has been demonstrated that HESS can enhance the overall system performance, lifespan, cost-effectiveness, and efficiency [4]. Specifically, in an EV context, a well-designed HESS can improve the efficiency of the power supply system and extend battery life by reducing battery stress [5]. Moreover, the HESS facilitates instantaneous power requirement compatibility and the capability to deliver substantial energy over long distances [6].
Broadly, ESSs are categorized into high-energy and high-power types. While high-energy types can sustain energy provision over extended periods, enabling longer vehicle travel, they offer limited power. Conversely, high-power types can deliver substantial energy instantaneously, making them suitable for vehicle acceleration, but their energy provision is short-lived. Batteries fall under the high-energy category; therefore, they can only offer limited energy during vehicle acceleration due to charge-discharge current limitations. High battery currents can rapidly diminish battery life—a significant concern given the high cost of EV batteries. Hence, the integration of a high-power energy source is necessary to supplement the battery's limitations. Research has suggested that the battery-supercapacitor HESS configuration is particularly promising for EV applications [7].
The successful operation of a HESS necessitates an effective EMS to manage power distribution among the ESSs. The EMS aims to satisfy constraints, use the ESS efficiently, improve fuel economy, reduce emissions, and enhance drivability and comfort [8]. Among the various EMS methods, which are categorized into rule-based, optimization-based, and learning-based methods [9], rule-based methods have been lauded for their robustness and fast computation times, thus making them highly implementable [10, 11].
In this study, a rule-based EMS method, the low-pass filter (LPF), is employed due to its simplicity and robust performance, and its ability to provide good dynamics and cycle reduction [12-15]. The LPF method in EMS works by decoupling the low-frequency power and assigning it to the battery, while the high-frequency signal is directed to the supercapacitor. Frequency domain EMS has been shown to extend battery life by managing transient phenomena in power demand [3, 16]. However, determining the cut-off frequency remains a challenge in the LPF method. To address this, the current study proposes the RPFT for determining the optimal cut-off frequency. The Ragone plot provides a general cut-off frequency for the battery and drive cycle, while fine-tuning helps optimize this frequency. The performance of this method is compared to the FFT method in a specific drive cycle.
The principal objective of this study is to extend battery life by reducing peak current and RMS current through the use of HESS and LPF as the EMS method. The key contributions of this study include the proposal of the RPFT method for determining the LPF EMS cut-off frequency and a comparison of its performance with the FFT method. The most effective method, based on our analysis, is suggested for future studies utilizing LPF EMS.
The remainder of this paper is organized as follows: Section II describes the system modeling and the use of LPF as EMS. Section III analyzes the results, and Section IV concludes the study.
2.1 System modeling
2.1.1 Electric vehicle model
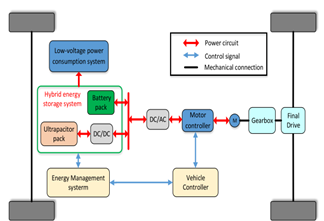
The electric vehicle model in the form of city car is adopted from [17] the configuration is shown in Figure 1. Its parameters are listed in Table 1, it was adopted from the same source with some modifications. From Figure 1, there are two power sources used which are battery and supercapacitor (SC).
Table 1. EV model parameters
|
Parameters |
Value |
Unit |
|
Vehicle mass (Mveh) |
775 |
kg |
|
Traction motor power (Pm_max) |
30 |
kW |
|
Traction motor efficiency(μ) |
0.9 |
- |
|
Windward area (Af) |
2.04 |
m2 |
|
Rolling resistance coefficient (croll) |
0.0112 |
- |
|
Air resistance coefficient (Cd) |
0.25 |
- |
|
Wheel radius (rw) |
0.252 |
m |
|
Transmission ratio (G) |
6.515 |
- |
|
Auxiliary load |
180 |
W |
|
Energy Storage System Parameters |
||
|
Battery rated capacity |
120 |
Ah |
|
Battery rated voltage |
144 |
V |
|
SC module-rated capacity |
33 |
F |
|
SC module-rated voltage |
94.5 |
V |
The HESS of battery and supercapacitor is divided into four topologies: passive, semi-active supercapacitor, semi-active battery, and active [18, 19]. In this study, a semi-active supercapacitor with one DC-DC converter on the SC side is used. This configuration has a trade-off between cost and power-sharing capability. Compared to the passive configuration, the semi-active has better energy sharing since there is one DC-DC converter that can control the energy flow. On the other side, compared to an active configuration which uses a DC-DC converter in each energy storage, the semi-active configuration is simpler and cheap.
The load for the HESS in this system is the power for the traction motor (propulsion load) and low voltage power consumption or called auxiliary load. The propulsion load is varies based on the driver's comment through the gas pedal, whereas the auxiliary power treated as constant power.
Figure 1. HESS configuration in EV [17]
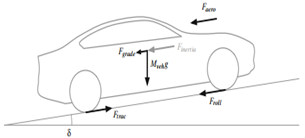
The electric vehicle is modelled using Newton’s motion law which is based on the force acting on the vehicle as illustrated in Figure 2. The Eq. (1) is the equation of motion for a vehicle. vs is the longitudinal velocity, Ftrac is traction force, Froll is wheel friction force, Faero is force air friction, Fgrade is the force of gravity. Formulas for calculating wheel friction, air friction, and gravitational force are respectively shown in Eqs. (2)-(4). Where Mveh is the vehicle mass, ρair is the air density (1.25 kg/m3 under normal conditions), g is the acceleration due to gravity, and δ is the angle of inclination of the road.
$\frac{d v_s}{d t}=\left(F_{\text {trac }}-F_{\text {roll }}-F_{\text {aero }}-F_{\text {grade }}\right) \div M_{\text {veh }}$ (1)
$F_{\text {roll }}=c_{\text {roll }} M_{\text {veh }} g \cos (\delta)$ (2)
$F_{\text {aero }}=\frac{1}{2} \rho_{\text {air }} A_f C_d v_s^2$ (3)
$F_{\text {grade }}=M_{\text {veh }} g \sin (\delta)$ (4)
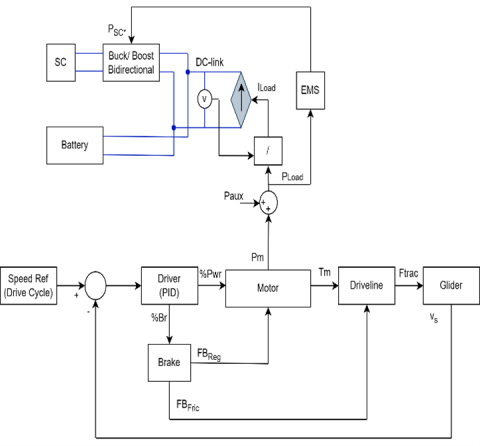
Figure 3 depicts the block diagram for the simulation design. The black line represents a control signal, whereas the blue line represents an electrical connection. In this instance, we utilize the Urban Dynamometer Driving Schedule (UDDS) as the speed reference, which is derived from a regular drive cycle. This signal is conveyed to the driver block, which uses the speed references to decide whether to power on or brake. This block is made up of a PID control that acts as a driver replacement and processes the difference in speed between reference speeds and observed speeds (vs). The brake block calculates the portion of braking (%Br) which is assigned for regenerative braking (FBReg) and friction braking (FBFric) based on Eq. (5). The Motor block then received the signal for the percentage of powering (%Pwr) and regenerative braking which was then multiplied by the maximum Powering/ Braking torque to get the motor torque (Tm) as in Eq. (6). The motor block calculates the motor power using Eq. (7). In the driveline block, the processes inside it calculate the Ftracbased on Eq. (8) utilizing the torque signal from the motor where Tspinloss in losses in the motor spin. The Glider block uses Eq. (1) to determine the vehicle's acceleration and speed. The power required by the system is load power (PLoad) which is motor power (Pm) plus the auxiliary load (Paux). This power is sent to the EMS block for power allocation to the SC. Whereas, the battery takes the rest of the power required by the system since it is uncontrolled.
$F B_{F r i c}=F B_{\text {max }}-F B_{\text {Reg }}$ (5)
$T_m=\left(\% P w r * T_{m \_\max }\right)+\left(F B_{R e q} * r_w / G\right)$ (6)
$P_m=\left(T_m\left(v_s G / r_w\right)\right) / \mu$ (7)
$F_{\text {trac }}=\left(T_m-T_{\text {spinloss }}\right) * G \div r_w-F B_{\text {Fric }}$ (8)
Figure 2. Force acting on a moving vehicle [20]
Figure 3. Simulation design block diagram
2.1.2 Energy storage system (ESS) model
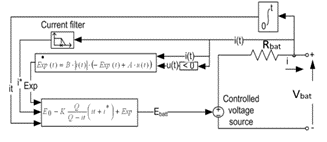
In the EV model used, there are two ESS used. Battery as the main supply and SC to support and as an energy buffer for the battery. The battery used is a lithium-ion (Li-ion) type, while the model used uses the battery model in the MATLAB software which refers to the Generic Battery Model (GBM). GBM itself refers to the model proposed by Tremblay and Dessaint [21] which has been validated experimentally with good accuracy (±5% error) for the 20-100% SoC range on Li-ion batteries.
Furthermore, the battery is modelled with a controlled voltage source and internal resistance. The value of the controlled voltage source is set based on Eq. (9) for discharging conditions and Eq. (10) for charging conditions. All variables used are described in the Nomenclature. Furthermore, Figure 4 shows a block diagram illustration of the battery model used.
Figure 4. Battery model [21]
$\begin{aligned} V_{b a t}=E_0-R_{b a t} & \cdot i-K \frac{Q}{Q-i t}(i *+i t)+A \cdot \exp (-B \cdot i t)\end{aligned}$ (9)
$\begin{aligned} V_{b a t}=E_0-R_{b a t} \cdot i-K \frac{Q}{i t+0.1 Q} i *-K \frac{Q}{Q-i t} i t +A \cdot \exp (-B \cdot i t)\end{aligned}$ (10)
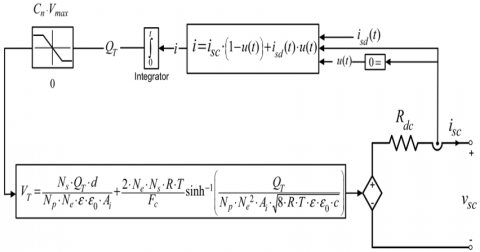
The supercapacitor model used refers to the non-linear Stern-Tofel model [22]. In the Stern-Tofel model, the total capacitance (CT) of the supercapacitor is a combination of Helmholtz's capacitance (CH) and Gouy-Chapman's capacitance (CGC), the formulation of the model is shown in Eqs. (11)-(14). Furthermore, the self-discharging current equation and supercapacitor voltage are shown in Eq. (15) and Eq. (16), respectively.
Figure 5 shows the block diagram of the supercapacitor model consisting of a voltage source and the supercapacitor's internal resistance. The voltage source used is a controlled voltage source where the voltage value is controlled as shown in Figure 5.
Figure 5. Supercapacitor model [22]
The battery and SC specification used is listed in Table 1 for its capacity and rated voltage. Whereas the rest of the variable value is using MATLAB default value. For more detail about the battery and SC models see studies [21, 22], respectively.
$C_T=\frac{N_p}{N_S}\left(\frac{1}{C_H}+\frac{1}{C_{G C}}\right)^{-1}$ (11)
$C_H=\frac{N_e \cdot \varepsilon \cdot \varepsilon_0 \cdot A_i}{d}$ (12)
$C_{G C}=\frac{F \cdot Q_T}{2 \cdot N_e \cdot R \cdot T} \sinh \left(\frac{Q_T}{N_e^2 \cdot A_i \sqrt{8 R T \varepsilon \varepsilon_0 C}}\right)$ (13)
$Q_T=\int i_{S C} d t$ (14)
$i_{s d}=N_e \cdot I_f \cdot \varepsilon^{\left(\frac{\alpha F c\left(\frac{V_{\text {init }}}{N_s}-\frac{V_{\max }}{N_s}-\Delta V\right)}{R T}\right)}$ (15)
$\begin{aligned} & V_{S C} =\frac{N_e Q_T d}{N_p N_e \varepsilon \varepsilon_0 A_i} +\frac{2 N_e N_S R T}{F} \sinh ^{-1}\left(\frac{Q_T}{N_p N_e^2 A_i \sqrt{8 R T \varepsilon \varepsilon_0 c}}\right)-R_{S C} i_{S C}\end{aligned}$ (16)
2.2 LPF as EMS
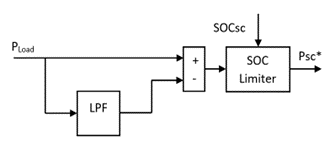
The EMS has an important role for HESS. It manages the power distribution for each ESS. Filter-based energy management is part of the rule-based EMS class. In this study, the type of filter chosen is a low-pass filter (LPF). The EMS design using LPF is illustrated in Figure 6. This process is inside the EMS block of Figure 3. The power demand (PLoad) is sent to LPF. The output of LPF is a low frequency for the battery. Since no DC-DC converter in the battery, the signal output from the LPF is used to get the reference power for the SC by subtracting the power demand signal with it. After that, the SoC limiter needs to be added because the LPF method cannot accommodate the constrain except frequency. To avoid SC being over-charged and over-discharged, the SoCSC is limited to 50-100%. According to the study [23], the charge of SC is not allowed to go down below 50% of the maximum voltage. The final output is a power reference for SC, PSC*, which then send to the DC-DC converter. The challenging task of LPF as EMS is finding the best cut-off frequency. Therefore, in this study, the RPFT is proposed.
Figure 6. EMS design using LPF
2.2.1 Ragone plot
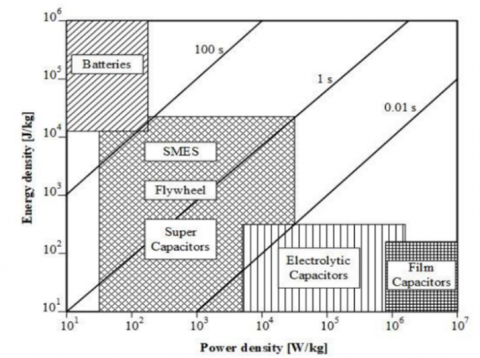
The Ragone plot is a plot that shows the relation between power density and energy density of an energy storage system (ESS). Figure 7 shows a Ragone plot of some ESS. It is seen that the battery has high energy density with low power density. On the other hand, the supercapacitor has a low energy density with a high-power density. From this plot, the cut-off frequency (fc) is calculated using Eq. (17) [24-27]. This method was used by the study [24] to determine the cut-off frequency of LPF EMS before then they add an adaptation algorithm to improve the performance. Based on the Ragone plot in Figure 7 and Eq. (17), the cut-off frequency is chosen at point (102, 104) of the Ragone plot which is 0.01Hz.
The fc is then substituted in Eq. (18) which is the first order LPF transfer function. This LPF will attenuate the signal with a frequency higher than the determined cut-off frequency. The rest with the high frequency is sent to the SC. However, the Ragone plot gives the cut-off frequency for the general battery and drive cycle. Each battery has a different and specific working frequency. Therefore, the specific cut-off frequency is important to optimize the battery performance.
Figure 7. Ragone plot [28]
$f_c=\frac{\rho_{\text {power }}[\mathrm{W} / \mathrm{kg}]}{\rho_{\text {enerqi }}[\mathrm{J} / \mathrm{kg}]}$ (17)
$L P F=\frac{\omega}{s+\omega}=\frac{1}{\left(\frac{1}{2 \pi f_c}\right) s+1}$ (18)
2.2.2 FFT
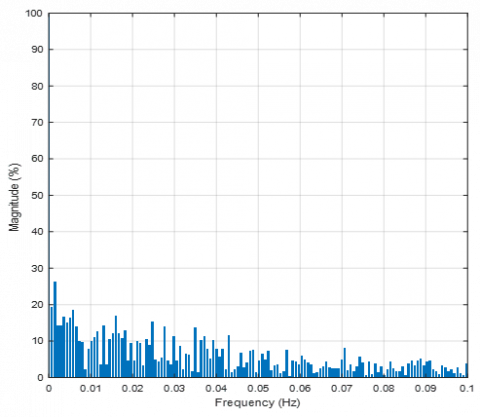
The spectrum analysis method is used to know the frequency of the power demand of the electric vehicle. Since every drive cycle has different power demand, this method is not track-independent, which will give a different result if the drive cycle is not the same. There is two spectrum analysis method that can be used which is FFT and Power Spectral Density (PSD). FFT gives the result of the magnitude of each frequency, whereas PSD gives the power density in each frequency. In this study, the FFT method is used.
The step used for finding cut-off frequency using the FFT method is as follows:
a) Apply the power demand signal to FFT.
b) Calculate the magnitude spectrum.
c) Find the cut-off frequency for which the magnitude is below the magnitude spectrum threshold.
In this study, the maximum magnitude of the spectrum is divided by 10 to set the threshold for selecting the cutoff frequency. This threshold is used to exclude any frequencies in the spectrum that have a magnitude below 1/10th of the maximum magnitude. This is done to avoid selecting a cutoff frequency that is affected by noise or other low-level signals in the data. By excluding these low-level signals, we can select a more reliable cutoff frequency for the LPF. The value of 1/10 used in this code is arbitrary and can be adjusted depending on the specific application and the noise level in the data. If the noise level is low, a higher threshold value can be used, while if the noise level is high, a lower threshold value may be more appropriate.
The FFT analysis is done using MATLAB and the result is shown in Figure 8. The bar graph shows the percentage magnitude compared to the maximum magnitude spectrum. This method is already used by studies [28, 29]. Based on Figure 8, the cut-off frequency is 0.009Hz which is close to that of the Ragone plot method.
Figure 8. FFT of UDDS drive cycle
2.2.3 Proposed method
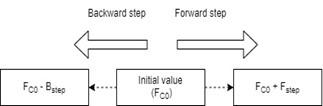
As the Ragone plot only gives the general approximation for battery cut-off frequency. Hence, another method is required to get the optimal value of the cut-off frequency to ensure the battery in HESS works optimally. The proposed method is RPFT. Fine-tuning is referred to as the Proportional Integral Derivative (PID) control which finds the best PID’s gain result from the initial value. The RPFT step is illustrated in Figure 9. The initial value of the cut-off frequency is from Ragone Plot which is 0.01Hz. Then, searching the best result from the frequency above and below this initial value by adding or subtracting it with the determined step. The forward step (Fstep) and backward step (Bstep) used in this study is 0.01 and 0.002, respectively. The search is stopped when the new cut-off frequency value has a worse performance compared with the previous one.
Figure 9. Fine tuning step
The performance of the proposed method is compared to the Ragone plot and FFT based on four criteria which are delta-SoC, distance per kWh, maximum battery current (I bat max), and Battery Current Root Means Square (BCRMS). In terms of distance per kWh, the higher value is better. On the other hand, in terms of delta-SoC, maximum battery current, and BCRMS, the lower value is better. The main objective of this study is to prolong the battery lifetime; therefore, battery peak current and BCRMS are the main criteria. Whereas the others are used to know the effect of the proposed system and EMS on the traveling distance. The battery aging parameter based on the BCRMS is calculated using Eq. (19) [30]. Where Tf is the simulation time.
BCRMS $=\sqrt{\frac{1}{T_f} \sum_{i=1}^{T f} I_{b a t}^2}$ (19)
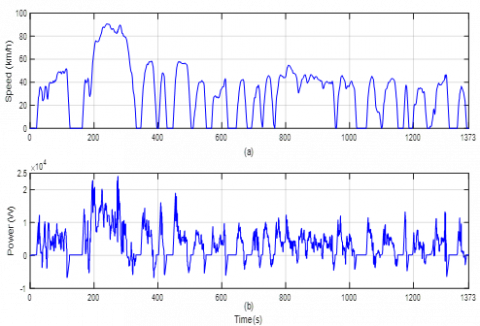
In this simulation test, the UDDS drive cycle is used. The gradient of the track is 0% or no elevation. Figure 10 (a) shows the speed profile of the UDDS driving cycle, while Figure 10 (b) is the power demand with the corresponding drive cycle. At the initial condition, the battery and supercapacitor’s SoC are set to 95%. The test is done in the C505 and UDDS drive cycles. The first one is part of the UDDS drive cycle at time 0-505 seconds or known as C505 which refers to the cold start of UDDS. This C505 has a distance of 5.82 km whereas the UDDS has 12.07 km in total. The short distance is used to faster the fine-tuning process while the long distance to test the best cut-off frequency from the fine-tuning process. The performance of the proposed method is compared to the Ragone plot and FFT method.
Figure 10. UDDS drive cycle: (a) speed; (b) power
3.1 C505 drive cycle
The result of the test in the C505 drive cycle is summarized in Table 2. The cut-off frequency from Ragone Plot and FFT is 0.01Hz and 0.009Hz, respectively. Based on Table 2, the lower frequency from 0.01Hz in this test is 0.009Hz has a worse performance. Therefore, the backward step is not performed. The first forward frequency is 0.02Hz and its performance better than the initial cut-off frequency from the Ragone plot. Therefore, the forward step is continued. The second forward frequency is 0.03Hz and it also has better performance than the previous frequency, the forward step is continued. The third forward frequency is 0.04Hz. Compared to the performance of frequency 0.03Hz, the cut-off frequency of 0.04Hz has better delta-SoC and distance per kWh whereas it has a worse maximum battery current and BCRMS with a higher value of it. Since the difference in delta-SoC and distance per kWh is only small compared to those of I bat max and BCRMS, the cut of frequency of 0.03Hz is selected in this fine-tuning test.
Table 2 shows that, in terms of the delta-SoC of the battery, the higher fc, it decreases. This is due to the higher cut-off frequency; the battery can absorb more energy from regenerative braking. Whereas in the battery only, all the regenerative braking energy is absorbed by the battery. The distance per kWh has a pattern of increased with the higher fc. While the battery only has the highest distance per kWh. This happens since in HESS; the battery also uses the energy to charge the SC after the SC gives its energy to reduce the peak current. The higher the fc, means the lower the power allocation for the SC. As a result, SC also absorbs a small amount of power from the battery. In terms of battery peak current, it has a concave pattern, where the lowest peak current is at the fc=0.03Hz. Therefore, this is the best LPF cut-off for this specified HESS. Since different battery and SC specifications will give different results. The last, BCRMS criteria have random patterns. However, the battery only has the highest BCRMS, then its value is nearly the same at fc between 0.009-0.03Hz and increases at fc=0.04Hz.
Table 2. C505 drive cycle test results
|
Cut-off Frequency (fc) |
Delta-SoC (%) |
Distance per kWh (km/kWh) |
I Bat Max (A) |
BCRMS |
|
Bat only |
3.60 |
8.58 |
155.85 |
48.47 |
|
0.009 |
3.80 |
8.20 |
146.48 |
44.06 |
|
0.01 |
3.80 |
8.21 |
146.45 |
44.04 |
|
0.02 |
3.78 |
8.26 |
133.92 |
44.17 |
|
0.03 |
3.73 |
8.32 |
109.42 |
44.69 |
|
0.04 |
3.71 |
8.36 |
114.55 |
45.37 |
Compared to the cut-off frequency from the Ragone plot and FFT, the one from fine-tuning(0.03Hz) has superior in the three criteria which are delta-SoC, distance per kWh, and I bat max. Whereas, in terms of BCRMS, it only has small differences. Compared to battery only EVs, the cut-off frequency from fine-tuning has a lower peak battery current and BCRMS by 29.79% and 7.80%, respectively, which means reducing battery stress. On the other side, it has a bit smaller value of delta-SoC and distance per kWh. The lower delta-SoC and distance per kWh are due to the battery charge the SC and not all the energy from the regenerative braking can be absorbed by the battery. This is due to SC is the priority to get the regenerative energy. However, the longer the battery lifetime, it can be used longer and as a result, the total distance of the vehicles is higher.
3.2 UDDS drive cycle
The best cut-off frequency from the first test was then tested in the second test with a longer distance. The test result is resumed in Table 3. It is clearly seen that the frequency from the RPFT still has the best performance value in most of the criteria used. Compared to the battery-only EV, the proposed system can reduce the maximum battery current and BCRMS by 29.80% and 9.99% respectively. Although, it has a small reduction in delta-SoC and distance per kWh. The reduction in delta-SoC is due to some portion of regenerative energy being absorbed by the SC. Whereas, the distance per kWh decreases since the total energy consumed in the HESS is higher than that of a battery-only EV. Compared to the Ragone plot and FFT method, the proposed method has the same result as previous test, which is superior in terms of delta-SoC, distance per kWh, and battery peak current.
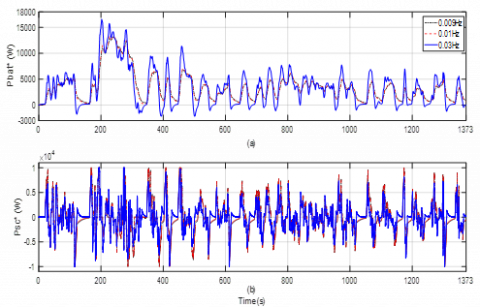
In more detail, Figure 11 shows the power-sharing which is the power distributed to the battery and supercapacitor after passing the LPF for the UDDS drive cycle. It is seen that the pattern is the same. The lower cut-off frequency for the battery means lower power is distributed to the battery and vice versa. Figure 11 (a) shows that the higher the cut-off frequency, the higher amplitude, and fluctuation. On the other hand, the lowest cut-off frequency has the slowest response since it has a higher time constant. The cut-off frequency of 0.03Hz has a higher battery power portion compared to the others. Whereas the cut-off frequency of 0.009Hz and 0.01Hz has nearly the same pattern. In the power references for SC, Figure 11 (b), it can be seen, at some periods its value is zero due to SoC SC limitation. When it reaches the SoC limit, the SC cannot give or receive power. It is seen that, with the higher cut-off frequency of the LPF, the SC contributes lower power.
Figure 11. Power sharing: (a) battery power; (b) SC power
Table 3. UDDS drive cycle test results
|
Cut-off Frequency (fc) |
Delta-SoC (%) |
Distance per kWh (km/kWh) |
I Bat Max (A) |
BCRMS |
|
Bat only |
6.94 |
9.24 |
155.85 |
36.24 |
|
0.009 |
7.31 |
8.81 |
146.48 |
30.92 |
|
0.01 |
7.30 |
8.82 |
146.45 |
30.99 |
|
0.03 |
7.17 |
8.93 |
109.41 |
32.62 |
Compared to the four criteria used, the higher cut-off frequency will behave close to the battery-only EV. For example, in the delta-SoC, distance per kWh, and BCRMS. As can be seen in the trend data in Table 2 and Table 3. On the other hand, the peak current has a different pattern. In this criterion, the fine tune plays an important role. The lower the cut-off frequency, the higher portion of power for SC which makes SC give more power events not in the peak power. On the contrary, the higher cut-off frequency limits the power portion from SC. Therefore, the right cut-off is necessary for optimal results. In this study, it was obtained from fine-tuning.
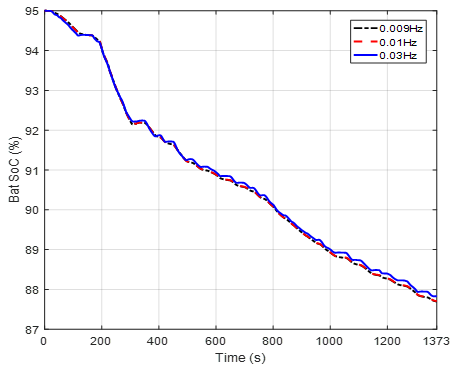
The SoC of the battery is shown in Figure 12 (a). It displays the SoC pattern from starting until the end of the EV movement. The final SoC curve shows that a cut-off frequency of 0.03Hz has the highest final value. The higher cut-off frequency of LPF on the battery side means a higher portion of power is allocated for the battery until the point where no power is allocated for SC, and it has the behavior of a battery-only EV. The higher value of the final SoC since most of the energy from regenerative braking is absorbed by the battery. It is also due to, the SC only giving a small portion of energy, hence, it does not absorb energy from the battery. In the lower cut-off frequency, after giving a high amount of power to reduce the peak current, SC absorbs energy from the battery since it has a lower voltage.
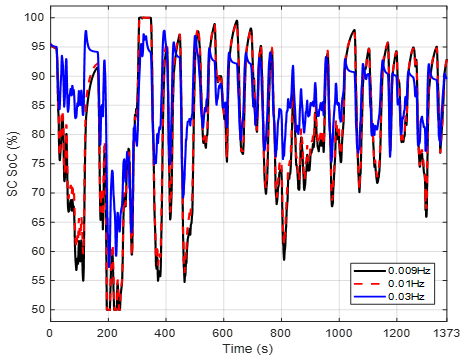
The SoC of the supercapacitor is depicted in Figure 12 (b). It fluctuates over time, the decreasing value means SC gives power, while the increasing value means SC gets power. The SC can absorb power in two way which is from regenerative braking and the battery. It absorbs battery power when its voltage is below the DC link after giving its power to the system. The final SoCSC value is 92.92%, 92.87%, and 89.52% for the cut-off frequency of 0.009Hz, 0.01Hz, and 0.03Hz, respectively. The curve from fc=0.03Hz is different, since at a high cut-off frequency of the battery’s LPF, only a small portion of the energy is allocated to the SC.
(a)
(b)
Figure 12. SoC changes: (a) battery; (b) SC
The simulation results reveal that the RPFT method, employing an optimized cut-off frequency, surpasses the performance of both the Ragone plot only and FFT methods. This superiority is evident in terms of delta-SoC, distance per kWh, and peak battery current. A heightened cut-off frequency substantially diminishes the power portion allocated to the supercapacitor (SC), thus nudging the system's behavior towards that of a battery-only EV. Conversely, a reduced cut-off frequency augments the power portion for the SC, thereby supplying more power beyond peak power demands. However, it is imperative that the optimal cut-off frequency is precisely calibrated through fine-tuning to achieve the desired results. A decrease in peak currents and BCRMS by as much as 29.80% and 9.99%, respectively, is achieved by the RPFT method, thereby effectively extending the battery's lifespan.
These findings hold substantial implications for HESS EV energy management, offering practical advantages such as improved battery performance, extended lifespan, and decreased maintenance costs. The RPFT method emerges as a promising solution for optimizing energy use in HESS EVs, thereby enhancing the overall efficiency and reliability of these vehicles.
In future studies, the development of an adaptive algorithm, such as one based on fuzzy logic, could be explored. This would allow for the recognition of different drive cycles and dynamic adjustment of the cut-off frequency. Such an advancement would enable the control system to adapt to different driving scenarios, ensuring optimal energy management across a range of conditions.
This research was funded by the Directorate General of Higher Education (DIKTI), Ministry of Education, Culture, Research, and Technology, Research Grant: Penelitian Disertasi Doktor (PDD) with contract number 228/UN27.22/PT.01.03/2023.
|
Vbat |
Battery non-linear voltage, V |
|
E0 |
Battery constant voltage, V |
|
Exp(s) |
Exponential zone dynamics, V |
|
Rbat |
Battery internal resistance, Ω |
|
K |
Polarization constant, Ah-1 or Ω |
|
i* |
Low frequency current dynamics, A |
|
i |
Battery current, A |
|
it |
Battery extracted capacity, Ah |
|
Q |
Battery capacity, Ah |
|
A |
Exponential voltage, V |
|
B |
Exponential capacity, Ah-1 |
|
Ai |
Interfacial area between electrodes and electrolyte, m2 |
|
c |
Molar concentration, mol/m3 |
|
r |
Molecular radius, m |
|
F |
Faraday constant, C/ mol |
|
iSC |
SC current, A |
|
VSC |
SC voltage, V |
|
RSC |
SC total resistance, Ω |
|
CT |
SC total capacitance, F |
|
Ne |
Number of layer of electrodes |
|
NA |
Avogadro constant, mol⁻¹ |
|
NP |
Number of parallel SC |
|
NS |
Number of series SC |
|
QT |
Electric charge, C |
|
R |
Ideal gas constant, J/K⋅mol |
|
d |
Molecular radius, Angstrom |
|
T |
Operating temperature, K |
|
If |
Leakage current, A |
|
ɛ |
Permitivity of material, F/m |
|
ɛ0 |
Permitivity of free space, F/m |
|
α |
Charge transfer coefficient |
|
ΔV |
Voltage changes, V |
[1] Verma, S., Mishra, S., Gaur, A., Chowdhury, S., Mohapatra, S., Dwivedi, G., Verma, P. (2021). A comprehensive review on energy storage in hybrid electric vehicle. Journal of Traffic and Transportation Engineering (English Edition), 8(5): 621-637. https://doi.org/10.1016/j.jtte.2021.09.001
[2] Ren, G., Shan, S., Ma, G., Shang, X., Zhu, S., Zhang, Q., Yang, T. (2019). Review of energy storage technologies for extended range electric vehicle. Journal of Applied Science and Engineering, 22(1): 69-82. https://doi.org/10.6180/jase.201903_22(1).0008
[3] Zhang, Q., Deng, W., Wu, J., Ju, F., Li, J. (2016). Power management control strategy of battery-supercapacitor hybrid energy storage system used in electric vehicles. Advances in Battery Manufacturing, Service, and Management Systems, 319-354. https://doi.org/10.1002/9781119060741.ch14
[4] Guenther, S., Weber, L., Bensmann, A.L., Hanke-Rauschenbach, R. (2022). Structured analysis and review of filter-based control strategies for hybrid energy storage systems. IEEE Access, 10: 126269-126284, https://doi.org/10.1109/ACCESS.2022.3226261
[5] Rimpas, D., Kaminaris, S.D., Aldarraji, I., Piromalis, D., Vokas, G., Papageorgas, P.G., Tsaramirsis, G. (2022). Energy management and storage systems on electric vehicles: A comprehensive review. Materials Today: Proceedings, 61: 813-819. https://doi.org/10.1016/j.matpr.2021.08.352
[6] Bououchma, Z., Sabor, J. (2021). Online diagnosis of supercapacitors using extended Kalman filter combined with PID corrector. International Journal of Power Electronics and Drive Systems. IJPEDS, 12(3): 1521-1534. https://doi.org/10.11591/ijpeds.v12.i3
[7] Hemmati, R., Saboori, H. (2016). Emergence of hybrid energy storage systems in renewable energy and transport applications-A review. Renewable and Sustainable Energy Reviews, 65: 11-23. https://doi.org/10.1016/j.rser.2016.06.029
[8] Tran, D.D., Vafaeipour, M., El Baghdadi, M., Barrero, R., Van Mierlo, J., Hegazy, O. (2020). Thorough state-of-the-art analysis of electric and hybrid vehicle powertrains: Topologies and integrated energy management strategies. Renewable and Sustainable Energy Reviews, 119: 109596. https://doi.org/10.1016/j.rser.2019.109596
[9] Ehsani, M., Singh, K.V., Bansal, H.O., Mehrjardi, R.T. (2021). State of the art and trends in electric and hybrid electric vehicles. Proceedings of the IEEE, 109(6): 967-984. https://doi.org/10.1109/JPROC.2021.3072788
[10] Xu, N., Kong, Y., Chu, L., Ju, H., Yang, Z., Xu, Z., Xu, Z. (2019). Towards a smarter energy management system for hybrid vehicles: A comprehensive review of control strategies. Applied Sciences, 9(10): 2026. https://doi.org/10.3390/app9102026
[11] Teng, T., Zhang, X., Dong, H., Xue, Q. (2020). A comprehensive review of energy management optimization strategies for fuel cell passenger vehicle. International Journal of Hydrogen Energy, 45(39): 20293-20303. https://doi.org/10.1016/j.ijhydene.2019.12.202
[12] Asensio, E.M., Magallan, G.A., De Angelo, C.H., Serra, F.M. (2020). Energy management on battery/ultracapacitor hybrid energy storage system based on adjustable bandwidth filter and sliding-mode control. Journal of Energy Storage, 30: 101569. https://doi.org/10.1016/j.est.2020.101569
[13] Jiao, Y., Månsson, D. (2021). A study of the energy exchange within a hybrid energy storage system and a comparison of the capacities, lifetimes, and costs of different systems. Energies, 14(21): 7045. https://doi.org/10.3390/en14217045
[14] Ramos, G.A., Costa-Castelló, R. (2022). Energy management strategies for hybrid energy storage systems based on filter control: Analysis and comparison. Electronics, 11(10): 1631. https://doi.org/10.3390/electronics11101631
[15] Tao, F., Zhu, L., Fu, Z., Si, P., Sun, L. (2020). Frequency decoupling-based energy management strategy for fuel cell/battery/ultracapacitor hybrid vehicle using fuzzy control method. IEEE Access, 8: 166491-166502. https://doi.org/10.1109/ACCESS.2020.3023470
[16] Traoré, B., Doumiati, M., Morel, C., Olivier, J.C., Soumaoro, O. (2020). New energy management algorithm based on filtering for electrical losses minimization in Battery-Ultracapacitor electric vehicles. In 2020 22nd European Conference on Power Electronics and Applications (EPE'20 ECCE Europe), IEEE, pp. 1-7. https://doi.org/10.23919/EPE20ECCEEurope43536.2020.9215748
[17] Yi, F., Lu, D., Wang, X., Pan, C., Tao, Y., Zhou, J., Zhao, C. (2022). Energy management strategy for hybrid energy storage electric vehicles based on pontryagin’s minimum principle considering battery degradation. Sustainability, 14(3): 1214. https://doi.org/10.3390/su14031214
[18] Ferahtia, S., Djeroui, A., Mesbahi, T., Houari, A., Zeghlache, S., Rezk, H., Paul, T. (2021). Optimal adaptive gain LQR-based energy management strategy for battery-supercapacitor hybrid power system. Energies, 14(6): 1660. https://doi.org/10.3390/en14061660
[19] Lencwe, M.J., Chowdhury, S.P.D., Olwal, T.O. (2022). Hybrid energy storage system topology approaches for use in transport vehicles: A review. Energy Science & Engineering, 10(4): 1449-1477. https://doi.org/10.1002/ese3.1068
[20] Onori, S., Serrao, L., Rizzoni, G. (2016). Hybrid electric vehicles: Energy management strategies. Springer Briefs in Electrical and Computer Engineering. https://doi.org/10.1007/978-1-4471-6781-5
[21] Tremblay, O., Dessaint, L.A. (2009). Experimental validation of a battery dynamic model for EV applications. World Electric Vehicle Journal, 3(2): 289-298. https://doi.org/10.3390/wevj3020289
[22] Miniguano, H., Barrado, A., Fernández, C., Zumel, P., Lázaro, A. (2019). A general parameter identification procedure used for the comparative study of supercapacitors models. Energies, 12(9): 1776. https://doi.org/10.3390/en12091776
[23] Hussain, S., Ali, M.U., Park, G.S., Nengroo, S.H., Khan, M.A., Kim, H.J. (2019). A real-time bi-adaptive controller-based energy management system for battery-supercapacitor hybrid electric vehicles. Energies, 12(24): 4662. https://doi.org/10.3390/en12244662
[24] Snoussi, J., Ben Elghali, S., Benbouzid, M., Mimouni, M.F. (2018). Auto-adaptive filtering-based energy management strategy for fuel cell hybrid electric vehicles. Energies, 11(8): 2118. https://doi.org/10.3390/en11082118
[25] Traoré, B., Doumiati, M., Morel, C., Olivier, J.C., Soumaoro, O. (2019). Energy management strategy design based on frequency separation, fuzzy logic and Lyapunov control for multi-sources electric vehicles. In IECON 2019-45th Annual Conference of the IEEE Industrial Electronics Society, 1: 2676-2681. https://doi.org/10.1109/IECON.2019.8927661
[26] Syahbana, D.F., Trilaksono, B.R. (2019). MPC and filtering-Based energy management in Fuel Cell/Battery/Supercapacitor Hybrid Source. In 2019 International Conference on Electrical Engineering and Informatics (ICEEI), IEEE, pp. 122-127. https://doi.org/10.1109/ICEEI47359.2019.8988849
[27] Snoussi, J., Elghali, S.B., Mimouni, M.F. (2019). Sizing and control of onboard multisource power system for electric vehicle. In 2019 19th International Conference on Sciences and Techniques of Automatic Control and Computer Engineering (STA), IEEE, pp. 347-352. https://doi.org/10.1109/STA.2019.8717231
[28] Dang, Q.B., Ngoc, N.D., Phuong, V.H., Ta, M.C. (2019). Implementation of frequency-approach-based energy management for EVs using typhoon HIL402. In 2019 IEEE Vehicle Power and Propulsion Conference (VPPC), IEEE, pp. 1-6. https://doi.org/10.1109/VPPC46532.2019.8952271
[29] Dang, Q.B., Dinh, A.V., Vo-Duy, T., Ta, M.C. (2019). An energy management system based on Fuzzy-LPF for HESS of Electric Vehicles. In 2019 IEEE Vehicle Power and Propulsion Conference (VPPC), IEEE, pp. 1-5. https://doi.org/10.1109/VPPC46532.2019.8952515
[30] Zhang, X., Lu, Z., Lu, M. (2020). Vehicle speed optimized fuzzy energy management for hybrid energy storage system in Electric Vehicles. Complexity, 2020. https://doi.org/10.1155/2020/2073901