Priyo Heru Adiwibowo*![]() | Muhammad Zohri
| Muhammad Zohri![]()
© 2023 IIETA. This article is published by IIETA and is licensed under the CC BY 4.0 license (http://creativecommons.org/licenses/by/4.0/).
OPEN ACCESS
With the escalating demand for renewable energy, numerous nations and communities have begun their transition towards sustainable resources, particularly solar energy. Among these, Photovoltaic Thermal (PVT) technology, capable of simultaneous electricity and heat production, has garnered significant attention. This study presents a mathematical and theoretical analysis of the performance of PVT systems enhanced with fin collectors. The proposed model utilizes exergy and improvement potential analysis to predict the performance of PVT systems equipped with fins under three levels of solar intensity: 400W/m2, 600W/m2, and 800W/m2. Concurrently, ten airspeed rates ranging from 0.01kg/s to 0.10kg/s were employed as variables. The energy balance equation is formulated as a 3×3 matrix, which is inverted and iterated until it converges to a new temperature value. This value is then processed and analyzed through an exergy approach, improvement potential, and sustainability index. Our findings indicate that the average maximum exergy output is 163.52 watt at a solar intensity of 800W/m2. The optimal improvement potential and sustainability index were found to be 322.92 watt and 2.039, respectively, also at a solar intensity of 800W/m2. These results suggest that the optimal exergy output, sustainability index, and improvement potential are achieved at a solar intensity of 800W/m2.
photovoltaic thermal system, fin collector, exergy optimization
The development of clean and sustainable energy technologies has been rapidly progressing, with solar energy playing a pivotal role due to its abundant and sustainable nature [1, 2]. This surge in demand aligns with the increasing concerns over global warming and environmental pollution. Photovoltaic technology, an innovation that converts solar energy into electrical energy, has seen substantial growth, reflecting the mounting interest in optimizing renewable energy sources. This growth is evident in the surge in electricity capacity generated by solar panels, escalating from 23 GW in 2009 to a remarkable 627 GW in 2019 [3]. Consequently, the annual market demand for photovoltaic technology is steadily increasing [4, 5]. In Indonesia, the development of solar panel applications for both on- and off-grid systems has already begun. This on-grid system could be promising in terms of economic analysis and lower-cost opportunities [6].
The integration of solar collector technology, capable of generating heat for various applications such as drying and space heating, with solar panels has led to the development of Photovoltaic Thermal (PVT) technology. This integration provides a viable solution for simultaneous heat and electricity generation. Typically, the conversion efficiency of electrical energy from sunlight ranges from 20% to 25%, dissipating the remaining energy as heat [7]. The collector can serve as a cooling mechanism for solar panels, utilizing mediums such as liquid fluids [8], air [9], heat pipe collectors [10], phase change materials [11], and thermoelectric [12], among others, depending on the conditions.
The interest in PVT technology has been steadily increasing due to its ability to generate both electricity and heat energy simultaneously [13]. The combined energy output is approximately 75%, compared to separate solar collector and photovoltaic technology [14]. This integration yields benefits such as heating and air conditioning in buildings [15] and can produce power independently or in a hybrid manner [16]. Applications of PVT technology are diversified, extending to space heating, water heating, space cooling, and power generation [17]. An additional benefit is that it can be installed on a house roof without obstructing the view, thus saving installation space [18].
Numerous methods have been developed to predict variables based on solar intensity and weather conditions aimed at enhancing the efficiency of PV technology. For instance, the Artificial Neural Network (ANN) method was employed by Gouda et al. [19]. Furthermore, Behera and Nayak [20] developed a mathematical model to predict the PV's output voltage, while Jang et al. [21] conducted investigations under various weather conditions. Chen et al. [22] investigated the prediction of variables affecting voltage and current performance, such as air humidity, wind conditions, air pressure, and solar radiation. Similarly, Zazoum [23] examined the influence of wind speed, cloud cover, humidity, and wind direction on the incoming electricity of solar panels. Lari and Sahin [24] proposed the Matern 5/2 Gaussian Process Regression (GPR) algorithm to estimate the incoming power of solar panels, considering factors like solar flux, air humidity, and wind speed.
Research conducted by Khanjari et al. on the energy and exergy analysis of Photovoltaic Thermal (PVT) technology with nanofluid cooling resulted in calculated energy efficiency and estimated exergy efficiency of 15% and 13.2%, respectively [25]. The outcomes from their study underline the significant impact of nanofluid in PVT coolers [26]. In a separate study, Tripathi et al. developed a cooling collector using a helical plate model for PVT technology, yielding exergy efficiency values between 11.1% and 13.4% and energy efficiency values ranging from 59% to 92% [27]. Thus, the helical plate model proved to influence PVT cooling substantially. Furthermore, an economic and exergo-economic energy analysis of PVT technology was undertaken by Fudholi et al. [28].
In their exploration of drying technology implementation, Fudholi et al. utilized collector fins, applying the exergy approach. This methodology resulted in an exergy efficiency of up to 30% [29]. Compared to systems without fins, the use of fin technology manifested superior results. Moreover, using fin collector technology coupled with the improvement potential approach demonstrated notable enhancement in the drying process, with a maximum improvement potential value of 1070 watts [30]. The exergy approach was employed, which evaluates energy quality within solar collector or photovoltaic (PV) systems [31]. Multiple collector designs, including flat plate, trapezoidal, and inverted trapezoidal shapes, were developed and tested using the exergy approach by Fernández et al. [32]. The comparative analysis of the three design tests suggested the need to develop a new and improved design.
The promise of PVT technology lies in its dual advantage of generating heat and electricity concurrently. Employing fins in PVT technology can enhance the system's overall efficiency. However, prior studies on PVT technology, especially those involving collector fins, have not utilized the sustainability index (SI), improvement potential (IP), and exergy approaches for the work optimization evaluation of the PVT system. Consequently, this research aims to analyze the sustainability index, improvement potential, and exergy in PVT technology using fins collector. Despite its potential, this method of enhancing potential is rarely applied in PVT technology. With the aid of a mathematical model, it is anticipated that recommendations can be made for future PVT technology development to maximize the utilization of solar intensity and air flow rate.
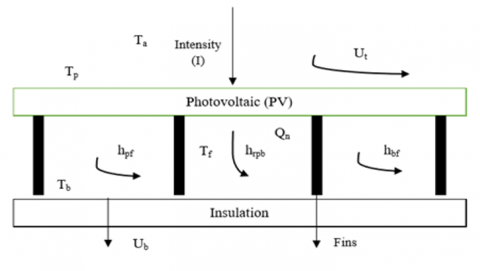
Installing fins collectors for solar collectors is highly useful to increase efficiency levels of heat absorption. Hence, its application on PVT can improve this technology’s overall performance. The fins design in this modeling follows the solar panel size. This study’s solar panel size is 120cm and 53cm wide. While the fins’ length is 20cm and 3cm wide, 50 fins will be simulated in this study. Several stages are involved in completing the mathematical modeling of the PVT system utilizing fins. Firstly, it is necessary to establish a mathematical model equation that aligns with the system design proposed for the schematic heat transfer in the PVT system, as depicted in Figure 1. Secondly, the heat transfer equation is formulated in matrix form based on the derived equation results and organized into groups according to the constraints and calculations, as presented in Table 1. Thirdly, the matrix is subsequently partitioned into its variables, coefficients, and constants. The predicted temperature value is computed using Microsoft Excel and subsequently analyzed using the exergy, SI, and IP methodologies to determine the optimal value:
Figure 1. Schematic of the energy balance in the PVT fin’s absorber
Table 1. Calculations and limitations of heat transfer
|
Limitations |
Calculations |
No. |
|
Heat transfer in solar panels (PV panels) |
$\begin{gathered}\tau \alpha\left(1-\eta_{\text {cell }}\right) I=U_t\left(T_p-T_a\right)+h_{p f}\left(T_p-T_f\right)+ \\ h_{r p b}\left(T_p-T_b\right)+Q_n\end{gathered}$ |
(1) |
|
Heat transfer in the air duct |
$2 m C\left(T_f-T_i\right) / W L=h_{p f}\left(T_p-T_f\right)+h_{b f}\left(T_b-T_f\right)+Q_n$ |
(2) |
|
Heat transfer of the bottom plate |
$h_{r p b}\left(T_p-T_b\right)=U_b\left(T_b-T_a\right)+h_{b f}\left(T_b-T_f\right)$ |
(3) |
|
Make a matrix form of equations 2 to 4 by grouping variables, constants, and coefficients in the heat transfer equation |
$\left[\begin{array}{ccc}K_1 & -h_{p f}+Q_n-h_{r, p b} & \\ h_{p f}+Q_n & -\left(K_2\right) & h_{b f} \\ h_{r p b} & h_{b f} & -\left(K_3\right)\end{array}\right]\left[\begin{array}{c}T_p \\ T_f \\ T_b\end{array}\right]=\left[\begin{array}{c}K_4 \\ -K_5 \\ -K_6\end{array}\right]$ |
(4) |
|
where, $\begin{aligned} & \mathrm{K}_1=\left(U_t+h_{p f}+h_{r p b}+Q_n\right), \mathrm{K}_2=\left(h_{p f}+h_{b f}+\frac{2 \dot{m} C}{W L}+Q_n\right), \mathrm{K}_3=\left(h_{r p b}+h_{b f}+U_b\right), \mathrm{K}_4=U_t T_a+\tau \alpha\left(1-\eta_{\mathrm{cell}}\right) I, \mathrm{K}_5=\left(\frac{2 \dot{m} C}{W L}\right) T_i, \\ & \mathrm{~K}_6=U_b T_a, Q_n=\frac{N}{A_{\text {fin }}}\left(2 k A_n l h_c\right)^{0.5} \operatorname{tanMH}\left(T_f-T_i\right), M=\left(\frac{2 h_c l}{k w}\right)^{0.5}, U_b=k_t / l_t, U_t=\left(\frac{1}{h_w+h_{r p a}}\right)^{-1}\end{aligned}$. |
|
|
The equations from 1 to 4 are used to estimate the temperature vector [T] by matrix inversion is shown in Table 1.
$[T]=[A]^{-1}[K]$
Invert $[\mathrm{A}]^{-1}$ is a matrix inversion to calculate a new temperature matrix $\left[\mathrm{T}^{\prime}\right]$. The new temperature $\left[\mathrm{T}^{\prime}\right]$ is likened to the early approximation temperature [T] until the converged condition. The variance between early approximation temperature and new temperature values ranges 0.001℃. This process realized suitable convergence for the temperature of PV ($\mathrm{T}_{\mathrm{p}}$), the temperature of air ($\mathrm{T}_{\mathrm{f}}$), and the temperature of the lining ($\mathrm{T}_{\mathrm{b}}$). The repetition procedure is from 4 to 5 periods. Subsequently, the exergy value, sustainability index, and improvement potential were planned to use the fins collector, as shown in Table 2.
Table 2. Calculations and limitations for improvement potential, sustainability index, and exergy
|
Limitations |
Calculations |
|
Heat transfer coefficient from photovoltaic to bottom |
$h_{r p b}=\frac{\sigma\left(T_p+T_b\right)\left(T_p^2+T_b^2\right)}{\left(\frac{1}{\varepsilon_p}+\frac{1}{\varepsilon_b}-1\right)}$ |
|
Heat transfer coefficient from photovoltaic to ambient |
$h_{r p a}=\varepsilon_p \sigma\left(T_p^2+T_{s k y}^2\right)\left(T_p-T_{s k y}\right)$ |
|
The temperature of the atmosphere |
$T_{\text {sky }}=0.0552 T_a^{1.5}$ |
|
The heat transfer coefficient of convection |
$h=\frac{k}{D_h} N u$ |
|
Channel width |
$D_h=\frac{4 W d}{2(W+d)}$ |
|
The nusselt numbers for the laminar flow area |
$N u=5.4+\frac{0.00190\left[\operatorname{RePr}\left(\frac{D_h}{L}\right)\right]^{1.71}}{1+0.00190\left[\operatorname{RePr}\left(\frac{D_h}{L}\right)\right]^{1.71}}$ |
|
The nusselt numbers for the transition flow area |
$\mathrm{Nu}=0.116\left(\operatorname{Re}^{2 / 3}-125\right) \operatorname{Pr}^{1 / 3}\left[1+\left(\frac{\mathrm{D}_{\mathrm{h}}}{\mathrm{L}}\right)^{2 / 3}\right]\left(\frac{\mu}{\mu_{\mathrm{w}}}\right)^{0.14}$ |
|
The nusselt numbers for the turbulent flow area |
$N u=0.018 \operatorname{Re}^{0.8} \operatorname{Pr}^{0.4}$ |
|
Reynolds number |
$R e=\frac{\dot{m} D_h}{A_{c h} \mu}$ |
|
Prandtl number |
$P r=\frac{\mu C}{k}$ |
|
For destruction of exergy [33] |
$\sum E x_{\text {destruction }}=\sum E x_{\text {input }}-\sum\left(E x_{\text {thermal }}-E x_{\text {photovoltaic }}\right)$ |
|
For input of exergy |
$E x_{\text {input }}=A N I\left[1-\frac{4}{3}\left(\frac{T_a}{T_s}+\frac{1}{3}\left(\frac{T_a}{T_s}\right)^4\right)\right]$ |
|
For output of exergy |
$\sum\left(E x_{\text {thermal }}-E x_{\text {photovoltaic }}\right)=\sum E x_{\text {input }}-\sum E x_{\text {destruction }}$ |
|
For thermal energy in PVT |
$E x_{\text {thermal }}=\dot{m} C\left(T_o-T_i\right)\left[1-\frac{T_a+273}{T_0+273}\right]$ |
|
For exergy of photovoltaic |
$E x_{\text {photovoltaic }}=\eta_p A S$ |
|
For the PVT exergy |
$E x_{p v t}=E x_{\text {thermal }}+E x_{p v}$ |
|
For exergy efficiency |
$\eta_{\text {exergy }}=\frac{E x_{\text {output }}}{E x_{\text {input }}}$ |
|
Sustainability index (SI) [34, 35] |
$S I=\frac{1}{1-\eta_{\text {exergy }}}$ |
|
For the improvement potential (IP) |
$I P=\left(1-\eta_{\text {exergy }}\right)$ Exergy destruction |
|
The photovoltaic efficiency |
$\eta_{p v}=\eta_{\text {ref }}\left[1-\beta_{r e f}\left(T_{p v}-T_{\text {ref }}\right)\right]$ |
|
The temperature of coefficient |
$\beta_{\mathrm{ref}}=\frac{1}{\left(T_O-T_{\mathrm{ref}}\right)}$ |
|
The thermal efficiency |
$\eta_{t h}=\dot{m} C\left(T_0-T_i\right) / I A$ |
|
The specific heat of the fluid |
$C=1.0057+0.000066(T-27)$ |
|
The concentration of air |
$\rho=1.1774-0.00359(T-27)$ |
|
Conduction of thermal |
$k=0.02624+0.0000758(T-27)$ |
|
The viscosity |
$\mu=[1.983+0.00184(T-27)] 10^{-5}$ |
Table 3 shows the air mass flow in PVT technology with fins with exergy input, exergy output, and exergy destruction values. We use air mass flow values from 0.01kg/s to 0.10kg/s or 10 air mass flow variations. At the same time, the solar intensity variations are from 400W/m2 600W/m2 and 800W/m2. These three levels or levels of solar intensity represent three conditions, low, medium, and high solar intensity. This study uses a theoretical approach or mathematical modeling. The results of mathematical calculations show that the maximum exergy output value is 241.10 watt at 0.06kg/s air mass flow with solar intensity at 800W/m2. Moreover, the maximum destruction exergy is 390.91 watt at 0.10kg/s of air mass flow and 800W/m2 sun intensity. The minimum exergy output is 47.78 watt at a 400W/m2 sun intensity and 0.01kg/s of air mass flow. In addition, the minimum destruction exergy is 174.72 watt at 0.06kg/s of air mass flow with a 400W/m2 solar intensity. Thus, the recommendation for solar intensity with maximum exergy output is at an 800W/m2 solar intensity level and a 0.06kg/s air mass flow.
Table 3. The input, output, and destruction of exergy in PVT technology fins
|
No. |
Mass Flow Rate (kg/s) |
400 (W/m2) |
600 (W/m2) |
800 (W/m2) |
|||
|
Output (watt) |
Dest (watt) |
Output (watt) |
Dest (watt) |
Output (watt) |
Dest (watt) |
||
|
1 |
0.01 |
47.78 |
188.82 |
84.40 |
270.51 |
135.81 |
337.41 |
|
2 |
0.02 |
54.36 |
182.25 |
102.90 |
252.01 |
176.87 |
296.35 |
|
3 |
0.03 |
58.16 |
178.45 |
114.68 |
240.23 |
204.17 |
269.05 |
|
4 |
0.04 |
60.42 |
176.19 |
122.04 |
232.87 |
222.23 |
250.99 |
|
5 |
0.05 |
61.53 |
175.08 |
126.53 |
228.39 |
234.00 |
239.21 |
|
6 |
0.06 |
61.89 |
174.72 |
128.92 |
225.99 |
241.10 |
232.12 |
|
7 |
0.07 |
44.58 |
192.03 |
82.90 |
272.02 |
141.52 |
331.69 |
|
8 |
0.08 |
39.40 |
197.21 |
66.95 |
287.97 |
105.82 |
367.40 |
|
9 |
0.09 |
37.64 |
198.97 |
60.93 |
293.98 |
91.35 |
381.87 |
|
10 |
0.10 |
36.84 |
199.77 |
57.46 |
297.46 |
82.31 |
390.91 |
|
Average |
|
50.26 |
186.35 |
94.77 |
260.14 |
163.52 |
309.70 |
Figures 2 to 4 describe the average input exergy, output exergy, and destruction exergy in PV/T technology using Fins collectors. The exergy input is 236.61 watts using a 400W/m2 solar intensity. The average exergy output is 50.26 watt, and the destruction exergy is 186.35 watt, as shown in Figure 2. For solar intensity at 600W/m2 the exergy input is 354.91. The average value of exergy output is 94.77 watts, and the destruction exergy is 260.14 watt, as shown in Figure 3. Meanwhile, at an 800W/m2 solar intensity, the exergy input is 473.22 watt. The average value of exergy output is 163.52 watt, and the average value of exergy destruction is 309.70 watt, as shown in Figure 4 below. Of the three solar intensity comparisons, the maximum average value of exergy output is 163.52 watt at an 800W/m2 solar intensity. Thus, the recommendation to get the optimum exergy output is at an 800W/m2 solar intensity.
The exergy efficiency at different solar intensities can be determined by comparing the average output exergy value to the input exergy value. The exergy efficiency value obtained under a solar intensity of 400W/m2 is 21.24%. The solar intensity at 600W/m2 is observed to be 26.70%, while at 800W/m2. It is found to be 34.55%. In contrast to prior investigations on exergy efficiency, Kalogirou et al. [36] employed solar collectors and achieved an exergy yield efficiency of 13.50%. According to Bosanac et al. [37], using an air-based photovoltaic (PVT) system yields an efficiency of 10.75%. In contrast, Sarhaddi et al. [38] reported an efficiency of 15.00% for a PVT system employing flat plates. The study conducted by Joshi et al. [39] reports that the power conversion efficiency (PCE) achieved through photovoltaic (PV) systems utilizing the ∇-groove collector is 13.06%. The utilization of collector fins can potentially enhance the system’s exergy efficiency.
A comparison of improvement potential with airflow rates in PVT technology with collector fins is explained in Figure 5 below. The airspeed rate data used is 10 data variations ranging from 0.01kg/s to 0.10kg/s. The result of calculating the improvement potential at a 400W/m2 solar intensity is 129.02-168.66. Furthermore, the potential improvement yields 143.90-249.30 watts at a 600W/m2 solar intensity. Meanwhile, at an 800W/m2 solar intensity, the improvement potential is around 113.85-322.92 watts. Compared to the solar intensity variations, the most optimal improvement potential is 322.92 watts at an 800W/m2 solar intensity with a 0.10kg/s air speed rate. At the same time, the minimum improvement potential is 129.02 watts at a 400Watt/m2 solar intensity and a 0.01kg/s airspeed rate. Thus, the recommended improvement potential position is at 800W/m2 solar intensity, as shown in Table 4.
Figure 2. Average exergy output, input, and destruction (400W/m2)
Figure 3. Average exergy output, input, and destruction (600W/m2)
Figure 4. Average exergy output, input, and destruction (800W/m2)
Table 4. The IP dan SI in PVT technology fins
|
No. |
Mass Flow Rate |
400 (W/m2) |
600 (W/m2) |
800 (W/m2) |
|||
|
IP (watt) |
SI |
IP (watt) |
SI |
IP (watt) |
SI |
||
|
1 |
0.01 |
150.69 |
1.253 |
206.18 |
1.312 |
240.58 |
1.402 |
|
2 |
0.02 |
140.39 |
1.298 |
178.95 |
1.408 |
185.59 |
1.597 |
|
3 |
0.03 |
134.58 |
1.326 |
162.61 |
1.477 |
152.97 |
1.759 |
|
4 |
0.04 |
131.20 |
1.343 |
152.79 |
1.524 |
133.12 |
1.885 |
|
5 |
0.05 |
129.56 |
1.351 |
146.97 |
1.554 |
120.92 |
1.978 |
|
6 |
0.06 |
129.02 |
1.354 |
143.90 |
1.570 |
113.85 |
2.039 |
|
7 |
0.07 |
155.84 |
1.232 |
208.48 |
1.305 |
232.50 |
1.427 |
|
8 |
0.08 |
164.37 |
1.200 |
233.65 |
1.232 |
285.25 |
1.288 |
|
9 |
0.09 |
167.32 |
1.189 |
243.51 |
1.207 |
308.15 |
1.239 |
|
10 |
0.10 |
168.66 |
1.184 |
249.30 |
1.193 |
322.92 |
1.211 |
|
Average |
|
147.16 |
1.273 |
192.63 |
1.38 |
209.58 |
1.58 |
Figure 5. Improvement potential versus air flow rates (400W/m2 600W/m2 and 800W/m2)
The comparison of SI with airspeed rate variations is displayed in Figure 6. The airspeed rate data used is 10 data variations ranging from 0.01kg/s to 0.10kg/s. for the data intensity of solar are 400W/m2 600W/m2 and 800W/m2. For the solar intensity of 400W/m2 the SI value is 1.184-1357. And for the solar intensity of 600W/m2 and 800W/m2 the SI values are 1.193-1570 and 1.211-2.039 respectively. The maximum SI value from three solar intensity variations is 2.039 at an airspeed rate of 0.06kg/s with solar intensity of 800W/m2. And the minimum value is 1.184 at the airspeed rate of 0.10kg/s with solar intensity of 400W/m2. Therefore, the recommendation of SI value is with the solar intensity of 800W/m2 and airspeed rate of 0.06kg/s position.
Figure 6. The performance of the sustainability index (SI) with airspeed rate variation
Table 5. Comparison of improvement potential and sustainability index
|
Years |
Collector Designs and Application |
Sustainability Index (SI) |
Improvement Potential/IP (Watt) |
References |
|
2008 |
Solar collector with plates |
NA |
NA |
[40] |
|
2010 |
Solar collector for drying |
NA |
0-17 |
[41] |
|
2010 |
Solar collector with flat-plate |
NA |
NA |
[42] |
|
2013 |
Solar collector using fins and non-fins |
NA |
740-1070 |
[43] |
|
2013 |
Solar collector for drying seaweed |
NA |
0.3-630 |
[29] |
|
2013 |
Solar for warm water application |
NA |
98-404 |
[44] |
|
2014 |
Solar for drying chili application |
NA |
0.135-47 |
[45] |
|
2015 |
Solar for palm application |
NA |
8-455 |
[46] |
|
2016 |
Cooling with nanofluid |
NA |
NA |
[47] |
|
2016 |
Collector with flat transpired |
NA |
NA |
[25] |
|
2016 |
Solar collector |
NA |
NA |
[48] |
|
2017 |
Solar collector |
1.0073 |
NA |
[49] |
|
2017 |
Collector with aluminum plate |
NA |
NA |
[26] |
|
2019 |
Collector ∇-groove |
1.152-1.171 |
NA |
[50] |
|
2022 |
Collector with flat-plate |
1.147-1.174 |
351.92-368.84 |
[51] |
|
2023 |
Collector v-absorber |
1.141-1.157 |
119.09-329.24 |
[52] |
|
2023 |
Collector fins absorber |
1.184-2.039 |
113.85-322.92 |
Present study |
Table 5 shows a comparison of improvement potential and sustainability index as in preceding studies. Improvement potential and sustainability index were rarely examined in previous studies, especially in PVT technology. Akpinar and Koçyiğit [43] conducted research with an improvement potential approach using fins on solar collectors. The improvement potential value ranges around 740-1070 Watt. Esen [41] analyzed with a modeling approach on drying mint leaves. Fudholi et al. [44] have designed a solar collector for drying red chili. The improvement potential results are 0.3-630 watts. Zohri et al. [51] have researched PVT technology with flat plates using a theoretical and experimental approach. The results of the potential improvement approach range around 351.92-368.84. and the sustainability index is 1.147-1.174, in the recent year 2023, the use of a V-groove absorber in PVT has been reported [52] by theoretical approach. The results of SI and IP are 1.141-1.157 and 119.09-329.24 Watt respectively. The values of SI and IP with v-groove and fins are similar. Therefore, fins are recommended for developing PVT technology in the future.
This study has employed mathematical modeling to predict the performance of Photovoltaic Thermal (PVT) technology using a fins collector. An analytical approach has been adopted to evaluate exergy, improvement potential (IP), and the sustainability index (SI) under three solar intensity variations: 800W/m2, 600W/m2, and 400W/m2. Simultaneously, air velocity variations were tested, ranging from 0.01kg/s to 0.10kg/s. The exergy metrics measured included input, output, and destruction exergy. The values for improvement potential and sustainability index were compared, taking into account the changes in both airspeed and solar intensity.
Across the three solar intensities, the highest average exergy output obtained was 163.52 watts, recorded at a solar intensity of 800W/m2. Meanwhile, the most optimal improvement potential and sustainability index values were found to be 322.92 watts and 2.039 respectively, also at a solar intensity of 800W/m2. The exergy analysis of PVT technology with collector fins revealed a superior performance compared to other collector models, as demonstrated by the results in both SI and IP units. Consequently, the use of fins emerges as a promising avenue for future developments in the field of solar collectors.
|
T |
temperature (K) |
|
A |
area of PVT (m2) |
|
h |
heat transfer coefficient (W/m2 K) |
|
L |
length of collector (m) |
|
$\mathrm{U}_{\mathrm{b}}$ |
loss coefficient of bottom collector (W/m2 K) |
|
$\mathrm{U}_{\mathrm{t}}$ |
loss coefficient of top collector (W/m2 K) |
|
I |
solar intensity (W/m2) |
|
$\dot{m}$ |
flow air rate (kg/s) |
|
C |
specific heat of air (J/kg K) |
|
W |
the width of collector (m) |
|
H |
the height of collector (m) |
|
Nu |
the nusselt number |
|
Re |
the reynolds number |
|
Pr |
the prandtl number |
|
Subscripts and greek symbols |
|
|
p |
photovoltaic or PV panel |
|
n |
number of fins |
|
r |
radiative |
|
b |
bottom of collector |
|
f |
fluid |
|
i |
inlet of air |
|
o |
outlet of air |
|
$\eta$ |
efficiency |
|
$\varepsilon_p$ |
emissivity of photovoltaic |
|
$\sigma$ |
Stefan Boltzman constant |
|
$\tau$ |
transmission coefficient |
|
a |
ambient |
|
s |
sky |
|
w |
wind |
[1] Ma, T., Yang, H.X., Lu, L. (2014). Development of a model to simulate the performance characteristics of crystalline silicon photovoltaic modules/strings/arrays. Solar Energy, 100: 31-41. https://doi.org/10.1016/j.solener.2013.12.003
[2] Urrejola, E., Antonanzas, J., Ayala, P., Salgado, M., Ramírez-Sagner, G., Cortés, C., Pino, A., Escobar, R. (2016). Effect of soiling and sunlight exposure on the performance ratio of photovoltaic technologies in Santiago, Chile. Energy Conversion and Management, 114: 338-347. https://doi.org/10.1016/j.enconman.2016.02.016
[3] Secretariat, R. (2020). Renewables 2020 global status report. Report Paris: REN12.
[4] Gu, WB, Ma, T., Ahmed, S., Zhang, Y.J., Peng, J.Q. (2020). A comprehensive review and outlook of bifacial photovoltaic (bPV) technology. Energy Conversion and Management, 223: 113283. https://doi.org/10.1016/j.enconman.2020.113283
[5] Al-Azawiey, S.S., Mohamed, M.M., Arifin, A.B. (2023). Effectiveness of PV/T passive natural air cooling by backside attached fins. International Journal of Energy Production and Management, 8(2): 55-62. https://doi.org/10.18280/ijepm.080201
[6] Arifin, Z., Rosli, M.A.M., Prasojo, Y.J., Alfaiz, N.F., Prasetyo, S.D., Mulyani, W. (2023). Economic feasibility investigation of on-grid and off-grid solar photovoltaic system installation in Central Java. International Journal of Energy Production and Management, 8(3): 169-175. https://doi.org/10.18280/ijepm.080305
[7] Da, Y., Xuan, YM, Li, Q. (2016). From light trapping to solar energy utilization: A novel photovoltaic-thermoelectric hybrid system to fully utilize solar spectrum. Energy, 95: 200-210. https://doi.org/10.1016/j.energy.2015.12.024
[8] Yazdanifard, F., Ebrahimnia-Bajestan, E., Ameri, M. (2016). Investigating the performance of a water-based photovoltaic/thermal (PV/T) collector in laminar and turbulent flow regime. Renewable Energy, 99: 295-306. https://doi.org/10.1016/j.renene.2016.07.004
[9] Nazri, N.S., Fudholi, A., Mustafa, W., Yen, C.H., Mohammad, M., Ruslan, M.H., Sopian, K. (2019). Exergy and improvement potential of hybrid photovoltaic thermal/thermoelectric (PVT/TE) air collector. Renewable and Sustainable Energy Reviews, 111: 132-144. https://doi.org/10.1016/j.rser.2019.03.024
[10] Pei, G., Fu, H.D., Zhu, H.J., Ji, J. (2012). Performance study and parametric analysis of a novel heat pipe PV/T system. Energy, 37(1): 384-395. https://doi.org/10.1016/j.energy.2011.11.017
[11] Kazemian, A., Khatibi, M., Ma, T. (2021). Performance prediction and optimization of a photovoltaic thermal system integrated with phase change material using response surface method. Journal of Cleaner Production, 290: 125748. https://doi.org/10.1016/j.jclepro.2020.125748
[12] Gu, WB, Ma, T., Song, A., Li, M., Shen, L. (2019). Mathematical modelling and performance evaluation of a hybrid photovoltaic-thermoelectric system. Energy Conversion and Management, 198: 111800. https://doi.org/10.1016/j.enconman.2019.111800
[13] Herrando, M., Markides, C.N., Hellgardt, K. (2014). A UK-based assessment of hybrid PV and solar-thermal systems for domestic heating and power: System performance. Applied Energy, 122: 288-309. https://doi.org/10.1016/j.apenergy.2014.01.061
[14] Das, D., Kalita, P., Roy, O. (2018). Flat plate hybrid photovoltaic-thermal (PV/T) system: A review on design and development. Renewable and Sustainable Energy Reviews, 84: 111-130. https://doi.org/10.1016/j.rser.2018.01.002
[15] Joshi, S.S., Dhoble, A.S. (2018). Photovoltaic-thermal systems (PVT): technology review and future trends. Renewable and Sustainable Energy Reviews, 92: 848-882. https://doi.org/10.1016/j.rser.2018.04.067
[16] Herrando, M., Ramos, A., Zabalza, I., Markides, C.N. (2019). A comprehensive assessment of alternative absorber-exchanger designs for hybrid PVT-water collectors. Applied Energy, 235: 1583-1602. https://doi.org/10.1016/j.apenergy.2018.11.024
[17] Ramos, A., Chatzopoulou, M.A., Guarracino, I., Freeman, J., Markides, C.N. (2017). Hybrid photovoltaic-thermal solar systems for combined heating, cooling and power provision in the urban environment. Energy Conversion and Management, 150: 838-850. https://doi.org/10.1016/j.enconman.2017.03.024
[18] Guarracino, I., Mellor, A., Ekins-Daukes, N.J., Markides, C.N. (2016). Dynamic coupled thermal-and-electrical modelling of sheet-and-tube hybrid photovoltaic/thermal (PVT) collectors. Applied Thermal Engineering, 101: 778-795. https://doi.org/10.1016/j.applthermaleng.2016.02.056
[19] Gouda, S.G., Hussein, Z., Luo, S., Yuan, Q.X. (2019). Model selection for accurate daily global solar radiation prediction in China. Journal of Cleaner Production, 221: 132-144. https://doi.org/10.1016/j.jclepro.2019.02.211
[20] Behera, M.K., Nayak, N. (2020). A comparative study on short-term PV power forecasting using decomposition based optimized extreme learning machine algorithm. Engineering Science and Technology, an International Journal, 23(1): 156-167. https://doi.org/10.1016/j.jestch.2019.03.006
[21] Jang, H.S., Bae, K.Y., Park, H.S., Sung, D.K. (2016). Solar power prediction based on satellite images and support vector machine. IEEE Transactions on Sustainable Energy, 7(3): 1255-1263. https://doi.org/10.1109/TSTE.2016.2535466
[22] Chen, C.S., Duan, S.X., Cai, T., Liu, B.Y. (2011). Online 24-h solar power forecasting based on weather type classification using artificial neural network. Solar Energy, 85(11): 2856-2870. https://doi.org/10.1016/j.solener.2011.08.027
[23] Zazoum, B. (2022). Solar photovoltaic power prediction using different machine learning methods. Energy Reports, 8: 19-25. https://doi.org/10.1016/j.egyr.2021.11.183
[24] Lari, M.O., Sahin, A.Z. (2017). Design, performance and economic analysis of a nanofluid-based photovoltaic/thermal system for residential applications. Energy Conversion and Management, 149: 467-484. https://doi.org/10.1016/j.enconman.2017.07.045
[25] Khanjari, Y., Pourfayaz, F., Kasaeian, A.B. (2016). Numerical investigation on using of nanofluid in a water-cooled photovoltaic thermal system. Energy Conversion and Management, 122: 263-278. https://doi.org/10.1016/j.enconman.2016.05.083
[26] Salem, M.R., Ali, R.K., Elshazly, K.M. (2017). Experimental investigation of the performance of a hybrid photovoltaic/thermal solar system using aluminium cooling plate with straight and helical channels. Solar Energy, 157: 147-156. https://doi.org/10.1016/j.solener.2017.08.019
[27] Tripathi, R., Tiwari, G.N., Dwivedi, VK (2016). Overall energy, exergy and carbon credit analysis of N partially covered photovoltaic thermal (PVT) concentrating collector connected in series. Solar Energy, 136: 260-267. https://doi.org/10.1016/j.solener.2016.07.002
[28] Fudholi, A., Sopian, K., Ruslan, M.H., Othman, M.Y. (2013). Performance and cost benefits analysis of double-pass solar collector with and without fins. Energy Conversion and Management, 76: 8-19. https://doi.org/10.1016/j.enconman.2013.07.015
[29] Fudholi, A., Sopian, K., Othman, M.Y., Ruslan, M.H., Bakhtyar, B. (2013). Energy analysis and improvement potential of finned double-pass solar collector. Energy Conversion and Management, 75: 234-240. https://doi.org/10.1016/j.enconman.2013.06.021
[30] Layek, A., Saini, J.S., Solanki, S.C. (2007). Second law optimization of a solar air heater having chamfered rib-groove roughness on absorber plate. Renewable Energy, 32(12): 1967-1980. https://doi.org/10.1016/j.renene.2006.11.005
[31] Benli, H. (2013). Experimentally derived efficiency and exergy analysis of a new solar air heater having different surface shapes. Renewable Energy, 50: 58-67. https://doi.org/10.1016/j.renene.2012.06.022
[32] Fernández, E.F., Almonacid, F., Sarmah, N., Rodrigo, P., Mallick, T.K., Pérez-Higueras, P. (2014). A model based on artificial neuronal network for the prediction of the maximum power of a low concentration photovoltaic module for building integration. Solar Energy, 100: 148-158. https://doi.org/10.1016/j.solener.2013.11.036
[33] Ong, K.S. (1995). Thermal performance of solar air heaters: mathematical model and solution procedure. Solar Energy, 55(2): 93-109. https://doi.org/10.1016/0038-092X(95)00021-I
[34] Sopian, K., Liu, H.T., Kakac, S., Veziroglu, T.N. (2000). performance of a double pass photovoltaic thermal solar collector suitable for solar drying systems. Energy Conversion and Management, 41(4): 353-365. https://doi.org/10.1016/S0196-8904(99)00115-6
[35] Caliskan, H. (2017). Energy, exergy, environmental, enviroeconomic, exergoenvironmental (EXEN) and exergoenviroeconomic (EXENEC) analyses of solar collectors. Renewable and Sustainable Energy Reviews, 69: 488-492. https://doi.org/10.1016/j.rser.2016.11.203
[36] Kalogirou, S.A., Karellas, S., Badescu, V., Braimakis, K. (2016). Exergy analysis on solar thermal systems: A better understanding of their sustainability. Renewable Energy, 85: 1328-1333. https://doi.org/10.1016/j.renene.2015.05.037
[37] Bosanac, M., Sorensen, B., Katic, I., Sorensen, H., Nielsen, B., Badran, J. (2003). Photovoltaic/thermal solar solar collectors and their potential in Denmark. Danish technological institute. Solar Energy Centre.
[38] Sarhaddi, F., Farahat, S., Ajam, H., Behzadmehr, A. (2010). Exergetic performance assessment of a solar photovoltaic thermal (PV/T) air collector. Energy and Buildings, 42(11): 2184-2199. https://doi.org/10.1016/j.enbuild.2010.07.011
[39] Joshi, A.S., Tiwari, A. (2007). Energy and exergy efficiencies of a hybrid photovoltaic-thermal (PV/T) air collector. Renewable Energy, 32(13): 2223-2241. https://doi.org/10.1016/j.renene.2006.11.013
[40] Fudholi, A., Zohri, M., Jin, G.L., Ibrahim, A., Yen, C.H., Othman, M.Y., Ruslan, M.H., Sopian, K. (2018). Energy and exergy analyses of photovoltaic thermal collector with ∇-groove. Solar Energy, 159: 742-750. https://doi.org/10.1016/j.solener.2017.11.056
[41] Esen, H. (2008). Experimental energy and exergy analysis of a double-flow solar air heater having different obstacles on absorber plates. Building and Environment, 43(6): 1046-1054. https://doi.org/10.1016/j.buildenv.2007.02.016
[42] Akpinar, E.K. (2010). Drying of mint leaves in a solar dryer and under open sun: Modelling, performance analyses. Energy Conversion and Management, 51(12): 2407-2418. https://doi.org/10.1016/j.enconman.2010.05.005
[43] Akpinar, E.K., Koçyiğit, F. (2010). Energy and exergy analysis of a new flat-plate solar air heater having different obstacles on absorber plates. Applied Energy, 87(11): 3438-3450. https://doi.org/10.1016/j.apenergy.2010.05.017
[44] Fudholi, A., Sopian, K., Othman, M.Y., Ruslan, M.H. (2014). Energy and exergy analyses of solar drying system of red seaweed. Energy and Buildings, 68: 121-129. https://doi.org/10.1016/j.enbuild.2013.07.072
[45] Ibrahim, A., Fudholi, A., Sopian, K., Othman, M.Y., Ruslan, M.H. (2014). Efficiencies and improvement potential of building integrated photovoltaic thermal (BIPVT) system. Energy Conversion and Management, 77: 527-534. https://doi.org/10.1016/j.enconman.2013.10.033
[46] Fudholi, A., Sopian, K., Yazdi, M.H., Ruslan, M.H., Gabbasa, M., Kazem, H.A. (2014). Performance analysis of solar drying system for red chili. Solar Energy, 99: 47-54. https://doi.org/10.1016/j.solener.2013.10.019
[47] Fudholi, A., Sopian, K., Alghoul, M.A., Ruslan, M.H., Othman, M.Y. (2015). Performances and improvement potential of solar drying system for palm oil fronds. Renewable Energy, 78: 561-565. https://doi.org/10.1016/j.renene.2015.01.050
[48] Gholampour, M., Ameri, M. (2016). Energy and exergy analyses of photovoltaic/thermal flat transpired collectors: Experimental and theoretical study. Applied Energy, 164: 837-856. https://doi.org/10.1016/j.apenergy.2015.12.042
[49] Hazami, M., Riahi, A., Mehdaoui, F., Nouicer, O., Farhat, A. (2016). Energetic and exergetic performances analysis of a PV/T (photovoltaic thermal) solar system tested and simulated under to Tunisian (North Africa) climatic conditions. Energy, 107: 78-94. https://doi.org/10.1016/j.energy.2016.03.134
[50] Fudholi, A., Zohri, M., Rukman, N.S.B., Nazri, N.S., Mustapha, M., Yen, C.H., Mohammad, M., Sopian, K. (2019). Exergy and sustainability index of photovoltaic thermal (PVT) air collector: A theoretical and experimental study. Renewable and Sustainable Energy Reviews, 100: 44-51. https://doi.org/10.1016/j.rser.2018.10.019
[51] Zohri, M., Ramadhan, W., Fudholi, A. (2022). Improvement potential and sustainability index of photovoltaic thermal solar air collector. International Journal of Heat & Technology, 40(3): 743-748. https://doi.org/10.18280/ijht.400312
[52] Zohri, M., Idham, Yuliadi, Ghazali, M. (2023). Performance of photovoltaic thermal technology using v-absorber with exergy, improvement potential and sustainability index analysis. Mathematical Modelling of Engineering Problems, 10(2): 551-557. https://doi.org/10.18280/mmep.100223