Catur E. Widodo![]() | Kusworo Adi
| Kusworo Adi![]() | Rahmat Gernowo
| Rahmat Gernowo![]() | Arif Setiawan*
| Arif Setiawan*![]()
© 2023 IIETA. This article is published by IIETA and is licensed under the CC BY 4.0 license (http://creativecommons.org/licenses/by/4.0/).
OPEN ACCESS
Pleural effusion is the accumulation of fluid in the pleural cavity. The pleural cavity is located between the pleural layer that covers the lungs and the pleural layer that attaches to the inner wall of the chest cavity. This condition generally occurs due to complications of the disease, including Dengue Hemorrhagic Fever (DHF). Information about the severity of DHF suffered by patients is very important to determine therapy and patient observation because improper handling can lead to patient death. Pleural Efusion Index (PEI) is an indicator used to determine the severity of DHF. So far, doctors or radiologists have measured PEI using conventional chest X-rays manually with a ruler. This method is complicated and time-consuming and must be performed by a specialist such as a doctor or radiologist. Meanwhile, doctors or radiologists who can measure PEI are not available all the time. Therefore, an automatic, fast, and accurate system is needed that can measure PEI and is practical for everyone so that DHF treatment can be carried out quickly. In this study, we developed a PEI measurement method automatically using image processing techniques using digital chest images. We implemented this method on a small Raspberry Pi computer so it can become a portable system. With this portable system, a doctor or radiologist can find out the PEI value and at the same time see the patient's condition directly at the treatment site. This system can also measure PEI directly from conventional film images using an attached camera. The design of the computer program includes preprocessing stages, determining the width of the hemithorax, segmentation, and finally measuring the PEI. The material used in this study was 20 chest images of DHF patients suffering from pleural effusion. The correlation between measurements using this system and manual measurements produces a value of 0.70 which means a high correlation.
Dengue Hemorrhagic Fever (DHF), Pleural Effusion Index (PEI), chest image, image processing, automatic measurement, portable system
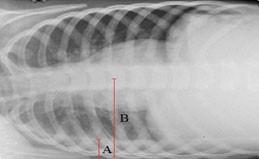
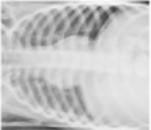
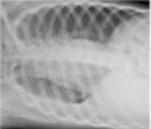
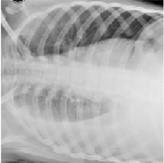
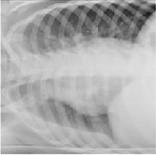
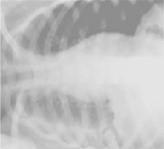
DHF is an infectious disease caused by the dengue virus which is an endemic disease in tropical and subtropical countries [1-4], one of which is Indonesia [5, 6]. One indication of DHF is plasma leakage which causes pleural effusion [7-9]. Pleural effusion is a condition where there is excessive accumulation of fluid in the pleura beyond normal limits. The excessive fluid can be caused by changes in hydrostatic pressure or increased capillary permeability of the pleural vessels [10, 11]. Using a chest X-ray, pleural effusion can be detected by looking at the angles at both ends of the diaphragm. Normal angles must be sharp. If an obtuse angle is found, pleural effusion can be suspected. A radiographic picture of pleural effusion can be seen in Figure 1.
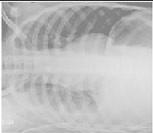
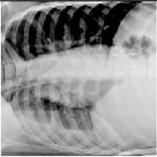
PEI measurements were performed using chest images with the patient lying on his right side. PEI is the ratio (in percent) between the pleural fluid level and the width of the hemithorax. An illustration of PEI measurement can be seen in Figure 2. So far, in measuring PEI, doctors or radiologists still rely on their visual abilities through manual measurements on conventional chest photographs in the form of X-ray films. The effusion fluid margin and hemithorax margin were marked and measured using a ruler.
Figure 1. Radiology image of pleural effusion
Figure 2. The method to determine PEI
From the figure, it could be determined that PEI=the level of pleural effusion fluid (A)/hemithorax width (B)×100%
This method is time-consuming and must be performed by a doctor or radiologist [12, 13]. Even though fast and accurate treatment is needed so that patients can immediately get treatment to prevent shock. To overcome this problem, we need a technology that can provide fast and accurate information. One of them is digital image processing. With a digital system, the use of conventional chest X-rays is no longer needed. The results of direct X-ray irradiation in the form of digital images. With this digital image processing, the effusion and hemithorax boundaries can be determined and measured automatically. In this study, we present a method of measuring PEI automatically using image processing. We hope that this method can replace doctors or radiologists so that PEI measurements can be carried out easily, quickly, and accurately so that further treatment of patients can be carried out immediately.
To be more convincing, we decided to implement such a method using a Raspberry Pi so that it becomes a portable system. With a portable system, the images obtained from radiographs can be analyzed while observing the patient directly. The Raspberry Pi is an inexpensive, card-sized computer for computing. The Raspberry Pi can serve as an efficient base because of its low cost and very complete number of available interfaces [14, 15]. For programming, we use Python as this language is naturally used in Raspberry Pi circles. The system will also use OpenCV, a computer vision library by Intel [16, 17] to assist image processing with resource optimization and low power consumption.
The material used in this study was 20 chest images of DHF patients suffering from pleural effusion. The stages of measuring PEI automatically include preprocessing, determining the width of the hemithorax using mirroring measurement techniques, segmentation, measuring pleural fluid levels, and hardware implementation.
2.1 Preprocessing
Preprocessing consists of enhancement and measurement conversion. Enhancement is performed to reduce noise so that the segmentation result does not have a loophole that would affect the next measurement. Enhancement is performed using a filter median. Measurement conversion is performed so that the image that would be processed would turn into a size of 200×200. By resizing, all image input would be made in the size of 200×200. By resizing, we do not need to limit the size of the image. Images of any size could be used as an input that could be processed under the same method.
2.2 Segmentation
Image segmentation aims to separate an object from its background where the object is the lungs and the background is any object other than the lungs. The output of the segmentation process is a binary image. Segmentation is performed using the threshold method. The threshold process is performed by examining the grey level of each pixel on the image and determining the limit value of the grey level. If the grey level is smaller than the threshold, a pixel is given a value of 0 (dark), and if bigger than the threshold, a pixel is given a value of 1 (white). The threshold value is determined using Otsu's method [18-20]. Thresholding is one of the image segmentation methods separating the object and the background in an image based on the grayscale. The image region which tends to be dark would be made perfectly black with an intensity value of 0 while the image region which tends to be bright would be made perfectly white with an intensity value of 1. Therefore, the output of the segmentation process with the thresholding method is a binary image with a pixel intensity value of 0 or 1 [21]. One of the ways to extract an object from the background is by choosing this model through a threshold. The equation used to convert a grayscale image into a binary image on the thresholding method is shown in Eq. (1).
$g(x, y)=\left\{\begin{array}{ll}1, & \text { if } f(x, y) \geq T \\ 0, & \text { if } f(x, y)<T\end{array}\right\}$ (1)
with f(x,y) as the function of the two variables and T as the threshold. If f(x,y) is bigger or equal to the threshold, then it would be converted into value 1 and if f(x,y) is smaller than the threshold then it would be converted into 0.
Otsu is a method of dynamic threshold selection using the maximization of the addition of the amount of foreground class variant number and background to determine the optimal threshold [22, 23]. This is conducted by separating the image into two classes W1 and W2 on gray level threshold T. Therefore W1={0, 1, 2 ..., T} and W2={T + 1, T + 2, ... L-1} where L is the amount of total gray level from the image. If the amount of pixels on the gray level of i is ni and becomes the amount of total pixels in the given picture, then the probability of the gray level of i to occur is defined in Eq. (2).
$p_i=\frac{n_i}{N}, p_i \geq 0, \sum_{i=0}^{L-1} p_i=1$ (2)
Usually, W1 is an interesting object and W2 is the background. For the background, the probability of the two classes is shown in Eq. (3).
$P_{w 1}=\sum_{i=0}^T p_i a n d P_{w 2}=\sum p_i=1-P_{w 1}$ (3)
It means that W1 and W2 could be calculated as shown in Eqs. (4) and (5).
$\mu_{w 1}=\sum_{i=0}^T \frac{i * p_i}{P_{w 1}}$ (4)
$\mu_{w 2}=\sum_{i=T+1}^{L-1} \frac{i * p_i}{P_{w 2}}$ (5)
Based on Eqs. (4) and (5), it could be derived Eq. (6), i.e.:
$\sigma^2(T)=P_{w 1} P_{w 2}\left(\mu_{w 1}-\mu_{w 2}\right)^2$ (6)
The optimal threshold could be obtained by maximizing variant in class, i.e.:
$T^*=\max _{0<T<L-1} \sigma^2(T)$ (7)
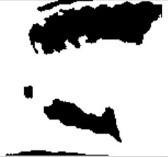
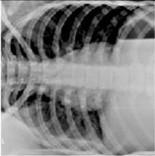
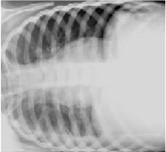
Otsu's method works by determining the threshold minimizing image intra-class variants. Segmentation could achieve a good result if the image histogram has two peaks, the result of the segmentation could be seen in Figure 3. After the segmentation, a morphology operation is performed to remove white dots on the dark area and black dots on the white area [24, 25].
(a)
(b)
Figure 3. (a) Original Image and (b) the segmentation result
2.3 Determining the width of hemithorax
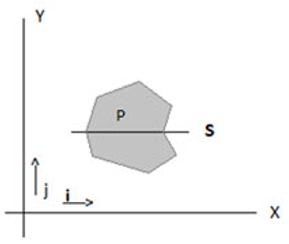
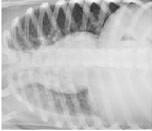
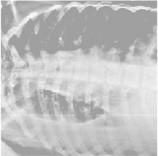
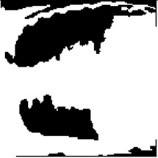
The chest cavity is divided into two compartments, the right hemithorax (in Figure 4 at the bottom) and the left hemithorax (in Figure 4 at the top). Hemithorax width is the distance between the axis of symmetry and the left hemithorax edge. The axis of symmetry is the midline between the right and left hemithorax. The hardest part of this job is how to determine the axis of symmetry. Assuming that the right and left hemithorax are symmetrical, we could determine the axis of symmetry using the mirroring technique. Such mirroring technique would be explained based on the illustration in Figure 4.
Figure 4. Illustration of determining the axis of symmetry
The Object would be called symmetrical towards axis Y=S if every gray level of the pixel on $P_{i, j+S}=P_{i, j-S}$ for i=1, 2, … m and j=1, 2, … n. Therefore, by making an m×n window with S as its axis of symmetry, a perfect symmetry would be obtained if the total absolute value of $\left|P_{i, j+s}-P_{i, j-s}\right|=0$. For the actual image, the possibility to obtain the value of zero is very small, then the axis of symmetry is obtained by taking the smallest value of all trial values of S.
2.4 Measuring PEI
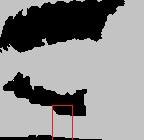
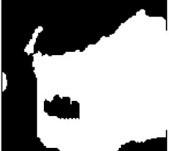
As mentioned before, PEI measurement is performed by comparing the level of pleural fluid and the width of the hemithorax [12, 26, 27]. Hemithorax width has been able to be determined by measuring the distance between the axis of symmetry and the right side of the hemithorax. To determine the level of effusion fluid, we do the following: Based on the observation of many pleural images the level of pleural fluid is not flat for the existence of noise. Therefore, we determine the level of fluid as the width of the fluid divided by the width of the observed area. We determine the observed area to measure the level of pleural level is the rectangle part (red-colored) as seen in Figure 5.
Figure 5. Illustration of pleural effusion width measurement. Pleural effusion width is obtained from the number of white pixels divided by 40
As seen in Figure 5, we determine the width of the rectangle is 40 pixels and the height is 50. This is the area where most pleural fluid pooled. In that area, pleural fluid is at the bottom and white-colored (in this figure, it is grey). Therefore, the height of the pleural could be obtained by counting all white pixels and dividing them by 40 (the width of the rectangle).
2.5 Hardware implementation
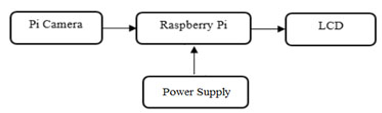
The hardware design we proposed was a Raspberry Pi processor with a Raspbian operating system with an additional camera to capture the image of lungs, and a touchscreen LCD as the graphical interface. Software implementation of the portable system proposed could be categorized into 4 procedural stages: preprocessing, segmentation, determining hemithorax width, and PEI measurement. Each process is significant since the result of one particular process would be sent to the next process. This camera is optional. The camera would be used if the image file is not available in digital form. If the object image is available in the form of a Rontgen photographic sheet, then it should be placed in front of a downlight lamp and captured using the camera. If the image object is the form of a file, then it could be inserted into this system using a flash disk or through a computer network via email or WhatsApp. For that purpose, Raspberry Pi has USB, and Ethernet port. A graphic interface in the form of an LCD touchscreen is highly required so this system does not require any keyboard but only needs to touch the screen with fingers or a stylus pen. Hardware design could be seen in Figure 6.
Figure 6. Hardware design
We have succeeded in compiling our proposed method and implementing it into a system using a Raspberry Pi as shown in Figure 7. We tested it using 20 thoracic images with indications of pleural effusion from DHF patients in the hospital. From the input image, preprocessing, segmentation, hemithorax width determination, and PEI measurement are carried out automatically. The results of PEI measurements using the proposed system were then compared with the results of measurements manually by the radiologist. From the measurement results, we calculated the difference in measurements using the proposed method and manual measurements by radiologists. The measurement results can be seen in Table 1.
Figure 7. Hardware Implementation
Table 1. PEI measurement result
|
No. |
Original Image |
Segmented Image |
PEI |
|
|
1 |
20 |
21 |
||
|
2 |
26 |
27 |
||
|
3 |
32 |
31 |
||
|
4 |
35 |
27 |
||
|
5 |
26 |
35 |
||
|
6 |
38 |
32 |
||
|
7 |
19 |
24 |
||
|
8 |
36 |
36 |
||
|
9 |
24 |
31 |
||
|
10 |
33 |
30 |
||
|
11 |
24 |
27 |
||
|
12 |
27 |
38 |
||
|
13 |
21 |
27 |
||
|
14 |
21 |
23 |
||
|
15 |
23 |
23 |
||
|
16 |
20 |
21 |
||
|
17 |
36 |
32 |
||
|
18 |
34 |
37 |
||
|
19 |
31 |
37 |
||
|
20 |
22 |
20 |
||
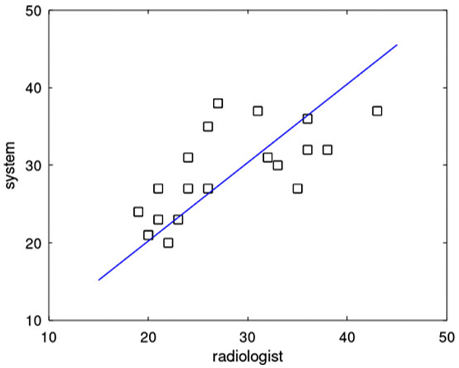
From Table 1, it can be seen at a glance that for each image, the results of measurements using the proposed system and the results of manual measurements by a radiologist are almost the same. Assuming that the correct measurement is the measurement made by the radiologist, we determine the difference based on the simple formula d=| f1 - f2|, where d is the difference, f1 is the measurement by the radiologist, and f2 is the measurement according to our proposed method. It can be seen from Table 1, the difference ranges between 0% (as in Figures 8 and 15) and 9% (as in Figure 5), where out of 20 images, the average difference is 3%. We also plotted the measurement results by the radiologist and the measurement results using the proposed system. The plotting results can be seen in Figure 8.
Figure 8. Result of radiologist measurement
From the plotting results, we get a gradient of m=1.0122, which means that the measurement results using the proposed system are very close to those measured by a radiologist. We also measured the correlation with the results of r=0.70, which means that the results of measurements using the proposed system are highly correlated with the results of measurements by radiologists [28]. With this high correlation, the proposed method can be used as an alternative to easily, quickly, and accurately measure PEI in dengue fever patients.
Based on our research, pleural effusion measurements can be performed automatically using image processing methods. The stages are preprocessing, segmentation, determining the width of the hemithorax, and finally measuring the PEI. The areas considered for measuring pleural effusion are the areas bounded by the axis of symmetry between the right and left pleura, the right pleural edge, the middle of the pleura, and the lower end of the pleura. PEI is measured based on the ratio between the pleural effusion fluid level and the width of the hemithorax. Segmentation with the Otsu method can provide clear object boundaries so that the PEI measurement by the proposed system can be carried out precisely. From the correlation analysis, it can be concluded that the results of PEI measurements using the proposed system have a high correlation with the results of manual measurements by radiologists.
Financial assistance was provided by the Government of the Republic of Indonesia through the Diponegoro University, Semarang.
|
PEI |
Pleural Effusion Index |
|
DHF |
Dengue Hemorrhagic Fever |
|
DSS |
Dengue Shock Syndrome |
|
g |
Binary image |
|
f |
Function two variable |
|
T |
Threshold |
|
W |
Class in image |
|
p |
probability of gray level |
|
Greek symbols |
|
|
σ |
Optimal threshold |
|
Subscripts |
|
|
x, y |
Image dimensions |
[1] Wang, C.C., Wu, C.C., Liu, J.W., Lin, A.S., Liu, S.F., Chung, Y.H., Su, M.C., Lee, I.K., Lin, M.C. (2007). Chest Radiographic presentation in patients with dengue hemorrhagic fever. The American Journal of Tropical Medicine and Hygiene, 77(2): 291-296. https://doi.org/10.4269/ajtmh.2007.77.291
[2] Srikiatkhachorn, A., Krautrachue, A., Ratanaprakarn, W., Wongtapradit, L., Nithipanya, N., Kalayanarooj, S., Nisalak, A., Thomas, S.J., Gibbons, R.V., Mammen Jr., M.P., Libraty, D.H., Ennis, F.A., Rothman, A.L., Green, S. (2007). Natural history of plasma leakage in dengue hemorrhagic fever. The Pediatric Infectious Disease Journal, 26(4): 283-90. https://doi.org/10.1097/01.inf.0000258612.26743.10
[3] Gupta, S., Singh, L., Tandon, R. (2020). Study of pulmonary manifestations among dengue patients in tertiary care hospital of north India. IJCMR, 7(5). http://dx.doi.org/10.21276/ijcmr.2020.7.5.11
[4] Srikiatkhachorn, A., Gibbons, R.V., Green, S., Libraty, D.H., Thomas, S.J., Endy, T.P., Vaughn, D.W., Nisalak, A., Ennis, F.A., Rothman, A.L., Nimmannitaya, S., Kalayanarooj, S. (2010). Dengue Hemorrhagic Fever: the sensitivity and specificity of the WHO definition in identifying severe dengue cases in Thailand, 1994-2005. Clinical Infectious Diseases, 50(8): 113-1143. https://doi.org/10.1086/651268
[5] Harapan, H., Michie, A., Mudatsir, M., Sasmono, R.T., Imrie, A. (2019). Epidemiology of hemorrhagic fever in Indonesia: analysis of five-decade data from the National Disease Surveillance. BMC Research Notes, 350. https://doi.org/10.1186/s13104-019-4379-9
[6] Soegijanto, S., Chilvia, E. (2013). Update management dengue shock syndrome in Pediatric cases. Indonesian Journal of Tropical and Infectious Disease, 4(4): 9-22. http://dx.doi.org/10.20473/ijtid.v4i4.227
[7] Shabbir, M., Ammen, F., Roshan, N., Israr, M. (2018). Nature and clinical course of pleural effusion in dengue fever. International Journal of Internal and Emergency Medicine, 1(1): 1006.
[8] Sharma, S.K., Gupta, B.S., Devpura, G., Agarwal, A., Anand, S. (2007). Pulmonary hemorrhage syndrome associated with dengue hemorrhagic fever. European Respiratory Journal. http://dx.doi.org/10.1183/13993003.congress-2016.PA3716
[9] Ejaz, K., Khursheed, M. (2011). Pleural effusion in dengue. Saudi Medical Journal, 32(1): 46-49.
[10] Nanda, M.A., Seminar, K.B., Nandika, D., Maddu, A. (2018). A comparison study of Kernel Functions in the Support Vector Machine and its application for termite detection. Information, 9(1): 5. https://doi.org/10.3390/info9010005
[11] Hammond, S. N., Balmaseda, A., Pérez, L., Tellez, Y., Saborío, S. I., Mercado, J. C., Videa, E., Rodriguez, Y., Pérez, M. A., Cuadra, R., Solano, S., Rocha, J., Idiaquez, W., Gonzalez, A., Harris, E. (2005). Differences in dengue severity in infants, children and adults in a 3 Year Hospital-based study in Nicaragua. The American Journal of Tropical Medicine and Hygiene, 73(6): 1063-1070. https://doi.org/10.4269/ajtmh.2005.73.1063
[12] Yusnida, A.M., Widodo, C.E., Adi, K. (2017). Chest X-ray segmentation to calculate pleural effusion index in patient with dengue hemorrhagic fever. International Journal of Innovative Research in Advanced Engineering, 4(7). https://doi.org/10.26562/IJIRAE.2017.JYAE10080
[13] Kocijancic, I. (2007). Diagnostic Imaging of small amounts of Pleural Fluid: Pleural Effusion vs. Physiologic Pleural Fluid. Coll. Antropol., 31(4): 1195-1199.
[14] Upton, E., Halfacree, G. (2016). Raspberry Pi User Guide (4th ed.). John Willey & Sons: West Sussex, UK, pp. 18-26.
[15] Monk, S. (2014). Raspberry Pi Cook Book. O’ Reilly Media: Sebastopol, California, pp. 1-29.
[16] Blum, R., Bresnahan, C. (2013). Python Programming for Raspberry Pi in 24 Hours. SAMS Publishing: Indiana, USA, pp.75-141.
[17] Shilpashree, K.S., Lokesha, H., Shiukumar, H. (2015). Implementation of Image Processing on Raspberry Pi. International Journal of Advanced Research in Computer and Communication Engineering, 4(5): 199-202. https://doi.org/10.17148/IJARCCE.2015.4545
[18] Dong, Y. X. (2014). Review of Otsu Segmentation Algorithm. Advanced Materials Research, 989-994, 1959-1961. https://doi.org/10.4028/www.scientific.net/amr.989-994.1959
[19] Senthilkumaran, N., Vaithegi, S. (2016). Image segmentation by using thresholding techniques for medical images. Computer Science & Engineering: An International Journal, 6(1). https://doi.org/10.5121/cseij.2016.6101
[20] Sezgin, M., Sankur, B. (2004). Survey over image thresholding techniques and quantitative performance evaluation. Journal of Electronic Imaging, 13(1). https://doi.org/10.1117/1.1631315
[21] Gonzalez, R.C., Woods, R.E. (2008). Digital Image Processing (Second Edition). Prentice-Hall, Inc: New Jersey.
[22] Otsu, N. (1979). A threshold selection method from gray level histograms. Transactions on Systems Man and Cybernetics, pp. 62-66. https://doi.org/10.1109/TSMC.1979.4310076
[23] Unajan, M.C., Gerardo, B.D., Medina, R.P. (2019). A modified otsubased image segmentation algorithm (OBISA). Proceedings of the International Multi Conference of Engineers and Computer Scientists 2019, Hong Kong.
[24] Breen, E.J., Jones, R., Talbot, H. (2000). Mathematical morphology: A useful set of tools for image analysis. Statistics and Computing, 10: 105-120. https://doi.org/10.1023/A:1008990208911
[25] Sreedhar, K., Panlal, B. (2012). Enhancement of images using morphological transformations. International Journal of Computer Science & Information Technology, 4(1): 33-50. https://doi.org/10.5121/ijcsit.2012.4103
[26] Itai, Y., Kim, H., Ishikawa, S., Yamamoto, A., Nakamura, K. (2007). A segmentation method of lung areas by using snakes and automatic detection of abnormal shadow on the areas. International Journal of Innovative Computing, Information & Control, 3(2): 277-284.
[27] Hazlinger, M., Ctvrtlik, F., Langova, K., Herman, M. (2014). Quantification of Pleural Effusion on CT by simple measurement. Biomedical Papers, 158(1): 107-111. https://doi.org/10.5507/bp.2012.042