Rakhi Jadhav![]() | Anurag Mahajan*
| Anurag Mahajan*![]()
© 2023 IIETA. This article is published by IIETA and is licensed under the CC BY 4.0 license (http://creativecommons.org/licenses/by/4.0/).
OPEN ACCESS
The efficient operation of the Smart Grid is contingent on the accurate analysis of power signals, which are often compromised by disturbances. These power signals, captured by quality monitors, generate substantial volumes of data, thereby necessitating effective compression strategies to facilitate manageable data transfer and collection. Besides mitigating the costs associated with data storage, transmission, and encryption, these compression techniques must ensure minimal reconstruction error to avoid distortion in the original signal. Moreover, it becomes imperative to eliminate noise for the attainment of high-quality signals, critical for disturbance detection. In this paper, a novel method has been developed employing lower-order wavelets (Db3, Db2, Db2, Db2, and Db1). This method decomposes the signal from the first to fifth level utilizing wavelet Packet Transform, testing the efficacy on Phasor measurement Unit data. Simulation results demonstrate enhanced data compression and noise reduction compared to previous designs, with the signal being approximately reconstructed. This innovative approach offers a facile, efficient, economical, and time-saving solution for smart grid data management, marking a significant advancement in this field.
complexity, compression ratio, reconstruction, signal to noise ratio, wavelet transform
Renewable energy generation, typified by solar power, has witnessed significant growth, spurred on by climate and energy challenges [1]. Conventional power sources are rapidly dwindling, with existing plants demonstrating inefficiency, obsolescence, and unsuitability. Complications such as blackouts, brownouts, substantial transmission losses, energy insufficiency, and power quality issues plague the current electrical grid. To overcome these challenges, a comprehensive overhaul of the power supply system is required [2].
Emerging as a modern electric network, the smart grid introduces a paradigm shift in power grid operation, leveraging several advanced technologies [2]. Key components, including measuring and automation devices in the generation and transmission systems, smart meters, and monitors in the distribution systems, are deployed to capture and process extensive real-time power system monitoring and measurement data [3]. Given the voluminous data, there is a critical need for effective compression techniques. A review of lossless and lossy data compression methods reveals that transform-based techniques demonstrate superior data compression and noise reduction compared to Parametric and Mixed Parametric and Transform methods [3]. Notably, wavelet transforms and wavelet packet transforms stand out for their efficacy in compressing non-periodic, transient, and varying frequency signals, localizing both time and frequency [3]. The quality of the electrical signal significantly influences the applicability of smart grid techniques [4]. Several studies have discussed various data compression techniques for managing the extensive data generated by smart meters and phase measurement units in the Smart Grid [5]. The electrical signal is often distorted by voltage sag and swell, transients, harmonics, fluctuating voltage, and notching [6]. Wavelet transform has been employed for segmenting disturbed signals [6], and for identifying system abnormalities using voltage and current signals, thereby reducing storage and bandwidth requirements [7]. Accurate measurement and monitoring of smart grid data are crucial for ensuring power signal quality [8]. Integrated Power Quality Monitoring System (IPQMS) amalgamates data from power quality monitors and analyzers, fault detectors, protective relays, and smart meters [8]. Advanced signal processing techniques are commonly employed in smart grid applications [9]. Lossless compression techniques have proven effective for managing the high sampling rate data of the smart grid [10]. Several methods for detecting faults in the Smart Grid have been reviewed [11].
Smart grid data has been subjected to run-length encoding for compression and encrypted using lightweight methods [12]. Wavelet transform has been used to divide voltage and current disturbance signals at various sampling rates [13]. Resumable load data compression has been employed to reduce complexity in the smart grid [14]. The Daubechies2 (db2) wavelet has shown superior compression of phase measurement unit data compared to the coiflet1 (coif1) wavelet [15]. Compression sensing methods have been tested for compression and reconstruction of low-voltage data [16]. Disturbances in power quality have been segmented by wavelet transform using an adaptive threshold [17]. Minimum description length criterion has been utilized to select a suitable wavelet for compressing the disturbance signal using wavelet transform [18]. Signals have been compressed by selecting wavelets and levels of decomposition based on the frequency of oscillating data [19].
While singular value decomposition demonstrates better compression and reconstruction, it is computationally complex due to matrices [20-22]. Wavelet transform compresses and reconstructs signals more effectively than the discrete cosine transform [23]. Embedded Zerotree Wavelet Transform has been applied for compressing and denoising smart grid data [24]. The best basis for wavelet packet transform is determined by modifying the Shannon entropy with added weights [25]. Wavelet packet decomposition compresses and denoises smart grid data using Daubechies wavelet db2 at the sixth level of decomposition [26]. The optimal tree is determined by the algorithm of Coifman and Wickerhauser using normalized Shannon entropy [26]. The best basis is determined by weighted entropy from the complete tree obtained from wavelet packet transform using Symlet wavelet sym8 at the fourth level of decomposition [27]. The threshold is calculated from the modified minimum description length to reduce noise [27]. However, the methods mentioned in studies [26, 27] are computationally complex as both approximation and detail coefficients are decomposed up to the sixth level [26] and recently in the study [27] at the fourth level using a large number of filters. The discrete wavelet transform improves the compression ratio and reduces complexity [28]. Several data compression methods using wavelet transform have been reviewed [29].
Given these studies, there appears to be potential for further complexity reduction while improving the compression ratio, reconstruction error, and signal-to-noise ratio. In light of this, the proposed method in this paper uses wavelet packet transform, combining different wavelet filters with a suitable threshold at each level. This method aims to reduce complexity while bettering compression, maintaining high quality, and minimizing distortion at the fifth level of decomposition. This approach aims to address the challenges in the current methods, contributing to the body of knowledge in this field.
The paper is structured as follows: Section 1 presents introduction with a detailed review of the relevant literature, highlighting the gaps this study seeks to fill. Section 2 describes the proposed methodology, while Section 3 discusses the experimental setup and results. Finally, Section 4 concludes the paper with key findings and potential directions for future research.
With the proposed method, this study seeks to make a significant contribution to the advancement of smart grid technology. By leveraging wavelet packet transform and combining different wavelet filters with a suitable threshold at each level, it is anticipated that the new method will not only reduce complexity but also improve compression, deliver high quality, and minimize distortion at the fifth level of decomposition. The potential implications of these improvements on the management and operation of the smart grid are profound. The main contribution of this research is the development and testing of a new method for data compression in smart grids. By implementing this new method, it is expected that significant improvements can be achieved in terms of reducing complexity, improving compression, and ensuring high quality and minimal distortion of data.
Through this research, it is hoped that the challenges associated with the operation and management of smart grids can be addressed, thus facilitating the transition from conventional power sources to more sustainable and efficient energy systems.
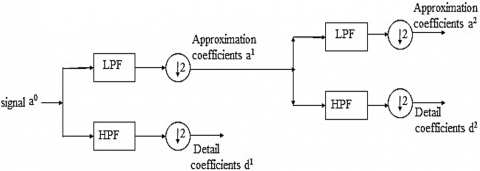
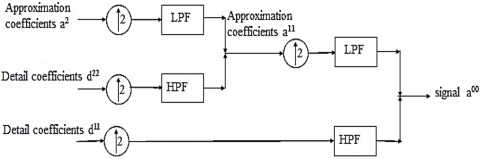
Discrete wavelet transform (DWT) sends the signal through a low pass filter (LPF) and high pass filter (HPF) following decimation by two to get approximation coefficients a1 and detail coefficients d1, respectively, as shown in Figure 1 using multi resolution Pyramid Algorithm. It decomposes only approximation coefficients further up to a suitable level. The detail coefficients d1 are high-frequency coefficients containing noise and hence are thresholded by setting zero the coefficients below the threshold, as per Eq. (1), and now represented by d11. The signal can be reconstructed using upsampling by inverse discrete wavelet transform (IDWT), as shown in Figure 2, using Pyramid Algorithm in reverse [18, 23].
Figure 1. Decomposition using DWT
Figure 2. Reconstruction using IDWT
This section describes the proposed data compression design in a smart grid using wavelet packet transform. The discrete wavelet transform develops into a full wavelet packet tree. The wavelet packet transform decomposes approximation and detail coefficients further. The wavelet coefficients are thresholded for compression and denoising to approximate the accurate regular signal. Hard thresholding sets the coefficients to zero whose absolute values are below a threshold value. Soft-thresholding sets to zero the coefficients having absolute values below a threshold value, and then shrinks the non-zero coefficients to zero [18, 26, 27].
The compression retains the coefficients with disturbances and ignores disturbance-free coefficients which discusses in the results of the proposed design. It suppresses the noise and distorts the data. The threshold $\mathrm{t}_{\mathrm{k}}^{\mathrm{m}}$ operates for absolute maximum value of the original coefficients $\mathrm{C}_{\mathrm{k}}^{\mathrm{m}}$, as shown below at the kth node of level m.
$t_k^m=(1-u) x max \left|C_k^m\right|$ (1)
where, 0≤u≤1 [23]. The threshold can be 100%. The data compression improves as the threshold increases but it distorts the signal and it increases the noise level, hence most care to be taken to select the threshold. The soft thresholding of the coefficients works as shown below.
$C_k^{m m}=\left\{\begin{array}{l}sign\left(C_k^m\right)\left(/ C_k^m /-t_k^m\right) ; \text { if } / C_k^m />t_k^m \\ 0 ; \quad \text { if } / C_k^m / \leq t_k^m\end{array}\right.$ (2)
where, $C_k^{m m}$ are the soft thresholded coefficients [26].
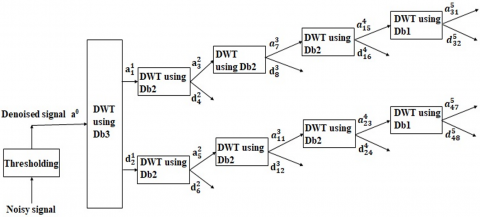
Figure 3. Proposed design of wavelet packet decomposition
In the proposed design, as shown in Figure 3, noisy signal is denoised by using threshold as suitable percentage of the error between original and noisy signal. Discrete wavelet transform is used to decompose approximation and detail coefficients further to get the wavelet packet tree. The compression process selects Daubechies filters Db3, Db2, Db2, Db2 and Db1 up to level 5, respectively, and for reconstruction, Db1, Db2, Db2, Db2 and Db3 in reverse. DWT and IDWT used in Figure 3 and Figure 4 are described in Figures 1 and 2, respectively. It decomposes the denoised signal a0 using db3 wavelet by discrete wavelet transform at level 1. It further decomposes the approximation $a_1^1$ and detail coefficients $\mathrm{d}_2^1$ from level 1 using the db2 wavelet by discrete wavelet transform at level 2. It decomposes the approximation coefficients $a_3^2$, $a_5^2$ from level 2 using Db2 wavelets by discrete wavelet transform at level 3. It further decomposes the approximation coefficients $a_7^3$ and $a_{11}^3$ from level 3 using Db2 wavelets by discrete wavelet transform at level 4. It further decomposes the approximation coefficients $a_{15}^4$ and $a_{23}^4$ from level 4 using Db1 wavelets by discrete wavelet transform at level 5.
Figure 4. Proposed design of wavelet packet reconstruction
The optimal tree decides the coefficients for the compression, and then these coefficients reconstruct the signal. In the optimal tree for compression, the coefficients $\mathrm{a}_{31}^5$ are pure approximation coefficients and hence are not thresholded. The coefficients $\mathrm{d}_{32}^5 \mathrm{~d}_{16}^4, \mathrm{~d}_8^3, \mathrm{~d}_4^2$ and $\mathrm{a}_{47}^5, \mathrm{~d}_{48}^5, \mathrm{~d}_{24}^4, \mathrm{~d}_{12}^3, \mathrm{~d}_6^2$ are not a pure approximation, hence are soft thresholded into coefficients $\mathrm{d}_{32}^{55} \mathrm{~d}_{16}^{44}, \mathrm{~d}_8^{33}, \mathrm{~d}_4^{22}$ and $\mathrm{d}_{47}^{55} \mathrm{~d}_{48}^{55}, \mathrm{~d}_{24}^{44}, \mathrm{~d}_{12}^{33}, \mathrm{~d}_6^{22}$ respectively using Eq. (1) and Eq. (2).
In the optimal tree for reconstruction, the coefficients $a_{15}^{44}$ are reconstructed using inverse discrete wavelet transform by upsampling $\mathrm{a}_{31}^5$ and $\mathrm{d}_{32}^{55}$ with Db1 wavelet. Similarly, the coefficients $a_7^{33}$ are reconstructed using inverse discrete wavelet transform by upsampling $\mathrm{a}_{15}^{44}$ and $\mathrm{d}_{16}^{44}$ with $\mathrm{Db} 2$ wavelet. Similarly, the coefficients $\mathrm{a}_3^{22}$ are reconstructed by upsampling $a_7^{33}$ and $d_8^{33}$ with $d b 2$ wavelet. The coefficients $\mathrm{a}_1^{11}$ are reconstructed by upsampling $\mathrm{a}_3^{22}$ and $\mathrm{d}_4^{22}$ with $\mathrm{Db} 2$ wavelet. The coefficients $a_{23}^{44}$ are reconstructed using inverse discrete wavelet transform by upsampling $\mathrm{a}_{47}^{55}$ and $\mathrm{d}_{48}^{55}$ with Db1 wavelet. Similarly, the coefficients $a_{11}^{33}$ are reconstructed using inverse discrete wavelet transform by upsampling $a_{23}^{44}$ and $\mathrm{d}_{24}^{44}$ with $\mathrm{Db} 2$ wavelet. Similarly, the coefficients $\mathrm{a}_5^{22}$ are reconstructed by upsampling $\mathrm{a}_{11}^{33}$ and $\mathrm{d}_{12}^{33}$ with $\mathrm{db} 2$ wavelet. The coefficients $\mathrm{d}_2^{11}$ are reconstructed by upsampling $\mathrm{a}_5^{22}$ and $\mathrm{d}_6^{22}$ with $\mathrm{Db} 2$ wavelet. The signal $\mathrm{a}^0$ is reconstructed as $\mathrm{a}^{00}$ by upsampling $\mathrm{a}_1^{11}$ and $\mathrm{d}_2^{11}$ by inverse discrete wavelet transform with $\mathrm{Db} 3$ wavelet.
The non-zero coefficients after decomposition and thresholding, as per Eq. (1) and Eq. (2), are the addition of pure approximation coefficients $a_{31}^5$ and detail coefficients $d_{32}^{55}$, $\mathrm{d}_{16}^{44}, \mathrm{~d}_8^{33}, d_4^{22}$, and $\mathrm{a}_{47}^{55}, \mathrm{~d}_{48}^{55}, \mathrm{~d}_{24}^{44}, \mathrm{~d}_{12}^{33}, \mathrm{~d}_6^{22}$ after thresholding.
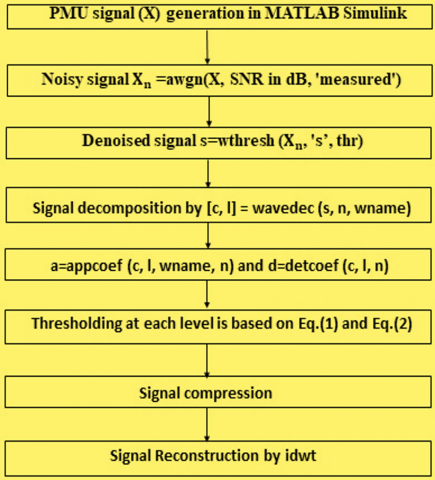
MATLAB algorithm works on the wavelet-packet transform-based proposed design for compressing and denoising data.
As in Figure 5, the Phasor measurement Unit (PMU) signal is generated in MATLAB Simulink. It adds noise using the MATLAB function 'awgn' (add white Gaussian noise). The signal is denoised using the command ‘wthresh’ where 's' is soft thresholding as per Eq. (2), thr is a threshold that can be a suitable percentage of the difference between signals X and $X_n$. It decomposes the signal by command 'wavedec' where n is the decomposition level and 'wname' is the wavelet function. It obtains the approximation coefficients a and detail coefficients d by commands 'appcoef' and 'detcoef' where 'c' is the decomposition vector of wavelet and 'l' is the bookkeeping vector containing level-wise number of coefficients. The threshold is calculated as per Eq. (1) and Eq. (2). The signal is compressed. It reconstructs the signal using 'idwt'.
Figure 5. MATLAB flowchart of the proposed design
It operates the simulated fault current of Phasor measurement Unit (PMU). The file has 8-12 seconds and 18-22 seconds of data before and after the fault hence the total of 30 seconds to detect and analyze abnormal parts in steady signals. It selects one thousand twenty-four samples of the PMU fault current near the disturbance location. The new design measures the performance by the percentage of compression ratio (CR), signal-to-noise ratio (SNR) in dB, and reconstruction error as normalized root mean square error (NRMSE) as below.
$C R=\frac{ { No \,of\, non\, zero\, coef\, ficients \,by \,threshold }}{ { No.\, of \, samples \,in \,the \,original \,signal }} \quad \quad \times 100 \%$ (3)
$N R M S E=\sqrt{\frac{\sum_{i=0}^{N-1}\,\,\,\left[X(i)-X_r(i)\right]\,^2}{N^2}}$ (4)
$S N R 1=\left(\frac{\sum_{i=0}^{N-1}\,\, X_n(i)^2}{\sum_{i=0}^{N-1}\,\,\,\,\left[X_n(i)-X(i)\right]\,\,^2}\right)$ (5)
$S N R 2=\left(\frac{\sum_{i=0}^{N-1} \,\,X_r(i)^2}{\sum_{i=0}^{N-1}\,\,\,\,\left[X_r(i)-X(i)\right]\,^2}\right)$ (6)
X(i) is original signal free from noise. Xn(i) is the noisy signal, Xr(i) is the reconstructed signal, and N represents samples in the original fault signal. SNR1 is the signal-to-noise ratio while transmitting, and SNR2 is receiving side signal-to-noise ratio and decide the success of the reconstructed signal in reducing noise. NRMSE decides how accurately the signal is regenerated.
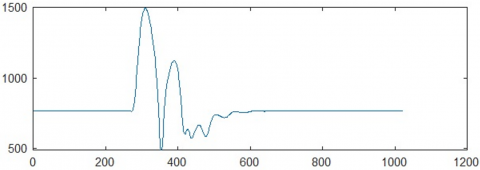
Figure 6 demonstrates the 1,024 samples of the original PMU current signal. The original signal is mixed with different noise levels. The denoised compressed data is transmitted. When denoising reduces the noise, the compression ratio is the result of it. The signal can be approximately regenerated and communicates the fault quickly with power quality. The regeneration of the signal is not accurate as it ignores undisturbed high-frequency detail coefficients having noise, and it does not send them on receiving side. As it sends only a few disturbing coefficients, the signal is approximate.
The threshold values for the coefficients at each level of decomposition are calculated as per Eq. (1) and Eq. (2) and specify the conditions for which it ignores the undisturbed coefficients and displayed in Table 1 for noisy signal of SNR 18.927.
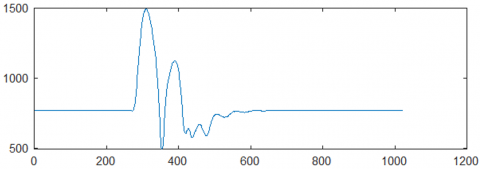
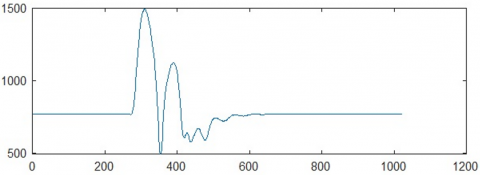
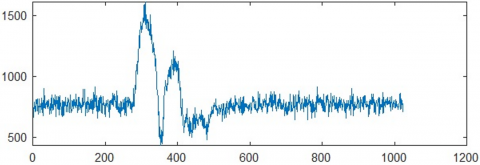
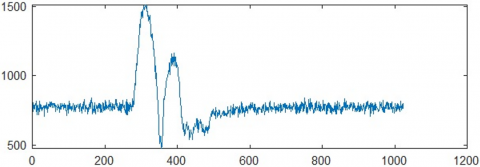
Figure 7 shows the noisy PMU signal with SNR 15.89dB, which improves to SNR 57.81dB in the reconstructed signal shown in Figure 8. Figure 9 shows the noisy PMU signal with SNR 18.927dB, which improves to SNR 57.78dB in the reconstructed signal shown in Figure 10. Figure 11 shows the noisy PMU signal with SNR 21.821dB, which improves to SNR 58.06dB for the reconstructed signal shown in Figure 12. Figure 13 shows the noisy PMU signal with SNR 24.541dB, which improves to SNR 58.163dB in the reconstructed signal shown in Figure 14. Similarly, Figures 15-18 are noisy PMU signals, and Figures 19-22 are their reconstructed signals. Figure 18 shows the noisy PMU signal with SNR 35.349dB, which improves to SNR 60.049dB in the reconstructed signal shown in Figure 22.
It shows improved compression and denoising by the proposed design in Table 2, as analyzed with studies [26, 27]. Figures 7, 9, 11, 13, 15-18 display different noise levels of PMU signal, and Figures 8, 10, 12, 14, 19-22 represent their respective reconstructed signals with improved SNR as per Table 2. The proposed design has achieved 14.94% compression; signal-to-noise ratio improved to 60.1dB, and NRMSE of 0.0250.
Table 3 describes the proposed design having simple lower-order filters with level 5, whereas Khan et al. [26] have utilized db2 up to level 6 and Khan [27] has utilized higher order wavelet sym8 up to level 4. The proposed design utilized few lower order filters due to low levels, whereas, in studies [26, 27], they use more filters due to higher levels. Hence the proposed design has less complexity than studies [26, 27].
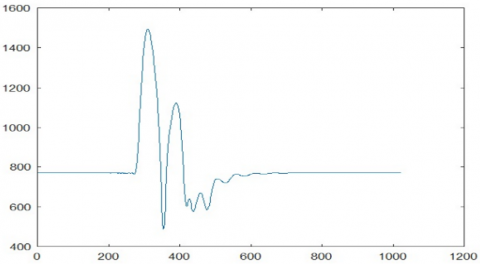
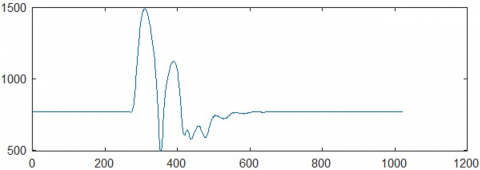
Figure 6. Original faulty PMU signal
Figure 7. PMU signal of SNR 15.89 dB
Figure 8. Reconstruction with SNR 57.81 dB
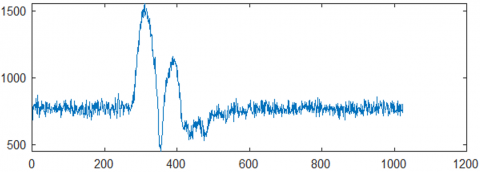
Figure 9. PMU Signal of SNR 18.927 dB
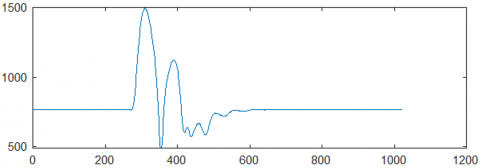
Figure 10. Reconstruction with SNR 57.78 dB
Figure 11. PMU signal of SNR 21.821 dB
Figure 12. Reconstruction with SNR 58.06 dB
Figure 13. PMU signal of SNR 24.541 dB
Figure 14. Reconstruction with SNR 58.163 dB
Figure 15. PMU Signal of SNR 27.82 dB
Figure 16. PMU Signal of SNR 30.316 dB
Figure 17. PMU signal of SNR 32.252 dB
Figure 18. PMU signal of SNR 35.349 dB
Figure 19. Reconstruction with SNR 59.672 dB
Figure 20. Reconstruction with SNR 59.713 dB
Figure 21. Reconstruction with SNR 60.1 dB
Figure 22. Reconstruction with SNR 60.049 dB
Table 1. Threshold for ignoring undisturbed coefficients
|
|
Approximation Coefficients |
Detail Coefficients |
||
|
|
Threshold for Low Pass Coefficients |
Threshold for High Pass Coefficients |
Threshold for Low Pass Coefficients |
Threshold for High Pass Coefficients |
|
Level 2 |
- |
3.3705 |
- |
0.4495 |
|
Level 3 |
- |
3.867 |
- |
0.5491 |
|
Level 4 |
- |
0.4691 |
- |
3.1607 |
|
Level 5 |
- |
1.4835 |
1.2215 |
1.9338 |
Table 2. Performance comparison of PMU data for 1024 samples
|
|
Original Signal SNR (dB) |
% CR |
SNR2 (dB) |
NRMSE |
|
Proposed design |
15.89 |
15.04 |
57.81 |
0.0326 |
|
[26] |
15.89 |
15.2 |
52.393 |
0.436x$10^{-5}$ |
|
[27] |
15.89 |
- |
37.764 |
12.65x$10^{-5}$ |
|
Proposed design |
18.927 |
14.94 |
57.78 |
0.0327 |
|
[26] |
18.931 |
15.5 |
54.928 |
0.243x$10^{-5}$ |
|
[27] |
18.927 |
- |
40.842 |
6.229x$10^{-5}$ |
|
Proposed design |
21.821 |
15.23 |
58.06 |
0.0317 |
|
[26] |
21.826 |
15.6 |
56.939 |
0.153x$10^{-5}$ |
|
[27] |
21.821 |
- |
43.727 |
3.205x$10^{-5}$ |
|
Proposed design |
24.541 |
15.23 |
58.163 |
0.0313 |
|
[26] |
24.547 |
15.3 |
58.07 |
0.118x$10^{-5}$ |
|
[27] |
24.541 |
- |
46.394 |
1.734x$10^{-5}$ |
|
Proposed design |
27.82 |
15.33 |
59.672 |
0.0263 |
|
[26] |
27.826 |
15.4 |
59.151 |
0.092x$10^{-5}$ |
|
[27] |
27.82 |
- |
49.526 |
0.843x$10^{-5}$ |
|
Proposed design |
30.316 |
15.33 |
59.713 |
0.0262 |
|
[26] |
30.321 |
15.4 |
59.653 |
0.082x$10^{-5}$ |
|
[27] |
30.316 |
- |
51.807 |
0.499x$10^{-5}$ |
|
Proposed design |
32.252 |
15.5 |
60.1 |
0.0250 |
|
[26] |
33.84 |
15.5 |
60.051 |
0.075x$10^{-5}$ |
|
[27] |
32.252 |
- |
53.483 |
0.339x$10^{-5}$ |
|
Proposed design |
35.349 |
15.5 |
60.049 |
0.0252 |
|
[26] |
35.778 |
15.5 |
60.029 |
0.075x$10^{-5}$ |
|
[27] |
35.349 |
- |
54.882 |
0.246x$10^{-5}$ |
Table 3. Discussion of complexity in proposed design
|
|
Proposed Design |
[26] |
[27] |
|
Method |
Wavelet Packet Transform |
Wavelet Packet Decomposition |
Wavelet packet Transform with Weighted entropy and modified MDL |
|
Level of Decomposition |
5 |
6 |
4 |
|
Wavelets |
db3, db2, db2, db2, db1 |
Db2 |
Sym8 |
|
Complexity |
Less complex |
More complex |
More complex |
The paper describes the proposed design based on the wavelet packet transform for compressing and denoising data. The proposed design achieved better computational complexity with a better compression and signal-to-noise ratio at level 5 using Db3, Db2, Db2, Db2 and Db1 wavelets. The noisy PMU signal with SNR 15.89dB, achieves CR 15.04%, SNR 57.81dB and NRMSE 0.0326 in the reconstructed signal. The noisy PMU signal with SNR 18.927dB, obtains CR 14.94%, SNR 57.78dB and NRMSE 0.0327 in the reconstructed signal. The noisy PMU signal with SNR 21.821dB, obtains CR 15.23%, SNR 58.06dB and NRMSE 0.0317 for the reconstructed signal. The noisy PMU signal with SNR 24.541dB, improves to SNR 58.163dB and achieves CR 15.23% and reconstructed signal with NRMSE 0.0313. The noisy PMU signal with SNR 32.252dB, improves to SNR 60.1dB and gets CR 15.5% and NRMSE 0.0250 in the reconstructed signal. It has achieved 14.94% compression, signal-to-noise ratio 60.1 dB and NRMSE 0.0250 for PMU data. The data compression and storage are cost-effective, and it transfers the data fast as it uses a smaller number of filters. It is possible to reduce the complexity further. It is possible to further improve data compression and noise reduction and reduce reconstruction errors. It gives a small reconstruction error NRMSE which has a limitation; hence there is future scope to reduce it further.
[1] Wan, C., Zhao, J., Song, Y., Xu, Z., Lin, J., Hu, Z. (2016). Photovoltaic and solar power forecasting for smart grid energy management. CSEE Journal of Power and Energy Systems, 1(4): 38-46. https://doi.org/10.17775/cseejpes.2015.00046
[2] Asaad, M., Ahmad, F., Alam, M.S., Sarfraz, M. (2019). Smart grid and Indian experience: A review. Resources Policy, 74: 101499. https://doi.org/10.1016/j.resourpol.2019.101499
[3] Tcheou, M.P., Lovisolo, L., Ribeiro, M.V., Da Silva, E.A.B., Rodrigues, M.A.M., Romano, J.M.T., Diniz, P.S.R. (2014). The compression of electric signal waveforms for smart grids: State of the art and future trends. IEEE Transactions on Smart Grid, 5(1): 291-302. https://doi.org/10.1109/TSG.2013.2293957
[4] Bollen, M.H.J., Das, R., Djokic, S., Ciufo, P., Meyer, J., Rönnberg, S.K., Zavoda, F. (2017). Power quality concerns in implementing smart distribution-grid applications. IEEE Transactions on Smart Grid, 8(1): 391-399. https://doi.org/10.1109/TSG.2016.2596788
[5] Wen, L., Zhou, K., Yang, S., Li, L. (2018). Compression of smart meter big data: A survey. Renewable and Sustainable Energy Reviews. 91: 59-69. https://doi.org/10.1016/j.rser.2018.03.088
[6] de Andrade, L.C.M., Nanjundaswamy, T., Oleskovicz, M., Fernandes, R.A.S., Rose, K. (2019). Advances in classification and compression of power quality signals. Journal of Control, Automation and Electrical Systems, 30(3): 402-412. https://doi.org/10.1007/s40313-019-00446-1
[7] Lai, C.S. (2014). Compression of power system signals with wavelets. International Conference on Wavelet Analysis and Pattern Recognition, 2014: 109-115. https://doi.org/10.1109/ICWAPR.2014.6961300
[8] Music, M., Hasanspahic, N., Bosovic, A., Aganovic, D., Avdakovic, S. (2016). Upgrading smart meters as key components of integrated power quality monitoring system. 2016 IEEE 16th International Conference on Environment and Electrical Engineering (EEEIC), Florence, Italy. https://doi.org/10.1109/EEEIC.2016.7555554
[9] Uddin, Z., Ahmad, A., Qamar, A., Altaf, M. (2018). Recent advances of the signal processing techniques in future smart grids. Human-Centric Computing and Information Sciences, 8(1). https://doi.org/10.1186/s13673-018-0126-9
[10] Jumar, R., Maaß, H., Hagenmeyer, V. (2018). Comparison of lossless compression schemes for high rate electrical grid time series for smart grid monitoring and analysis. Computers and Electrical Engineering, 71: 465-476. https://doi.org/10.1016/j.compeleceng.2018.07.008
[11] Hlalele, T.S., Sun, Y., Wang, Z. (2019). Faults classification and identification on smart grid: Part-a status review. Procedia Manufacturing, 35: 601-606. https://doi.org/10.1016/j.promfg.2019.05.085
[12] Singh, S. (2019). Improving quality of service in the smart grid using data compression and encryption technique. International Journal of Advance Research, Ideas and Innovations in Technology, 5(3): 2172-2176.
[13] De Andrade, L.C.M., Oleskovicz, M., Fernandes, R.A.S. (2014). Analysis of Wavelet Transform applied to the segmentation of disturbance signals with different sampling rates. 2014 IEEE PES General Meeting | Conference & Exposition, National Harbor, MD, USA. https://doi.org/10.1109/PESGM.2014.6939189
[14] Unterweger, A., Engel, D. (2015). Resumable load data compression in smart grids. IEEE Transactions on Smart Grid, 6(2): 919-929. https://doi.org/10.1109/TSG.2014.2364686
[15] Bhuiyan, B.A., Absar, M.W., Roy, A. (2018). Performance comparison of various wavelets in compression of PMU generated data in smart grid. 3rd International Conference on Electrical Information and Communication Technology, Khulna, Bangladesh. https://doi.org/10.1109/EICT.2017.8275177
[16] Sun, Y., Cui, C., Lu, J., Wang, Q. (2016). Data compression and reconstruction of smart grid customers based on compressed sensing theory. International Journal of Electrical Power and Energy Systems, 83: 21-25. https://doi.org/10.1016/j.ijepes.2016.03.051
[17] Andrade, L.C.M., Oleskovicz, M., Fernandes, R.A.S. (2016). Adaptive threshold based on wavelet transform applied to the segmentation of single and combined power quality disturbances. Applied Soft Computing Journal, 38: 967-977. https://doi.org/10.1016/j.asoc.2015.10.061
[18] Hamid, E.Y., Kawasaki, Z.I. (2002). Wavelet-based data compression of power system disturbances using the minimum description length criterion. IEEE Transactions on Power Delivery, 17(2): 460-466. https://doi.org/10.1109/61.997918
[19] Cheng, L., Ji, X., Zhang, F., Huang, H., Gao, S. (2018). Wavelet-based data compression for wide-area measurement data of oscillations. Journal of Modern Power Systems and Clean Energy, 6(6): 1128-1140. https://doi.org/10.1007/s40565-018-0424-2
[20] De Souza, J.C.S., Lessa Assis, T.M., Pal, B.C. (2017). Data compression in smart distribution systems via singular value decomposition. IEEE Transactions on Smart Grid, 8(1): 275-284. https://doi.org/10.1109/TSG.2015.2456979
[21] Li, Q., Zhang, M., He, S., Li, S. (2018). Instructions data compression for smart grid monitoring using wavelet domain singular value decomposition. Proceedings of the 30th Chinese Control and Decision Conference, Shenyang, China, pp. 5171-5175. https://doi.org/10.1109/CCDC.2018.8408029
[22] Karthika, S., Rathika, P. (2019). An efficient data compression algorithm for smart distribution systems using singular value decomposition. IEEE International Conference on Intelligent Techniques in Control, Optimization and Signal Processing, Tamilnadu, India, pp. 1-7. https://doi.org/10.1109/INCOS45849.2019.8951340
[23] Karthika, S., Rathika, P. (2018). Wavelet transform based compression of electric signal waveforms for smart grid applications. International Journal of Engineering & Technology, 7(4): 5419-5426. https://doi.org/10.14419/ijet.v7i4.23269
[24] Khan, J., Bhuiyan, S., Murphy, G., Arline, M. (2015). Embedded zerotree wavelet based data denoising and compression for smart grid. IEEE Transactions on Industry Applications, 9994(c): 1-11. https://doi.org/10.1109/TIA.2015.2420613
[25] Bhuiyan, S., Khan, J., Murphy, G. (2018). Weighted entropy for data compression in smart grid. 2018 IEEE Industry Applications Society Annual Meeting, Portland, OR, USA, pp. 1-6. https://doi.org/10.1109/IAS.2018.8544486
[26] Khan, J., Bhuiyan, S., Murphy, G., Williams, J. (2016). Data denoising and compression for smart grid communication. IEEE Transactions on Signal and Information Processing over Networks, 2(2): 200-214. https://doi.org/10.1109/TSIPN.2016.2539680
[27] Khan, J. (2021). Weighted entropy and modified MDL for compression and denoising data in smart grid. International Journal of Electrical Power and Energy Systems, 133: 107089. https://doi.org/10.1016/j.ijepes.2021.107089
[28] Jadhav, R.Y., Mahajan, A. (2022). Data compression and noise reduction in smart grid using discrete wavelet transform. Traitement du Signal, 39(5): 1857-1863. https://doi.org/10.18280/ts.390546
[29] Jadhav, R., Mahajan, A. (2023). Review on Data Compression Methods of Smart Grid Power System Using Wavelet Transform. In: Namrata, K., Priyadarshi, N., Bansal, R.C., Kumar, J. (eds), Smart Energy and Advancement in Power Technologies. Lecture Notes in Electrical Engineering, vol. 926. Springer, Singapore. https://doi.org/10.1007/978-981-19-4971-5_18