Slamet Risnanto*![]() | Othman Mohd
| Othman Mohd![]() | Nor Hafeizah
| Nor Hafeizah![]() | Novi Mardiana
| Novi Mardiana![]() | Abdurrohman
| Abdurrohman![]() | Hersusetiyati
| Hersusetiyati![]()
© 2023 IIETA. This article is published by IIETA and is licensed under the CC BY 4.0 license (http://creativecommons.org/licenses/by/4.0/).
OPEN ACCESS
In 2024, Indonesia is poised to conduct a significant national event - the simultaneous general election for both presidential and local leadership positions. Historically, manual voting has been the method of choice since the inaugural election in 1955. However, as Indonesia prepares for future electoral exercises, the potential adoption of electronic voting systems is a consideration that merits comprehensive investigation, given the nation's expansive geographical spread and substantial population, which presents considerable challenges in executing any election. Despite several countries previously implementing electronic voting systems in their general elections, these cases have often culminated in failure, primarily due to concerns surrounding data security, public trust, and technological preparedness. This study, employing the structural equation modelling-partial least squares (SEM-PLS) approach, endeavors to evaluate the multifarious factors that could influence the successful deployment of an electronic voting system in Indonesia. The findings reveal that dimensions such as trust in government, technology, and electoral commissions; technological infrastructure; human resources; and constitutional readiness all significantly contribute to the potential success of electronic voting system implementation. These results are anticipated not only to inform the development and application of electronic voting in Indonesia, but also to provide a foundational platform for future research efforts dedicated to constructing a robust and effective electronic voting framework.
E-Voting, election, construction, optimization, success factors, framework
Electronic Voting (E-Voting) is an electoral process facilitated through electronic means. The numerous benefits of E-Voting, such as enhanced computational speed and accuracy, resource preservation, and cost reduction, have been documented [1-3]. Consequently, progressive nations are contemplating the transition from traditional to electronic voting systems in their general elections. The year 2024 marks a pivotal point in Indonesia's political landscape, with the execution of elections that are crucial for the advancement of democracy in the country. From the inception of the voting process in 1955, up until the thirteenth election in 2024, Indonesia has predominantly relied on traditional voting systems. Although certain aspects, like the counting system, have been technologically augmented, a comprehensive exploration of the influences impacting the successful implementation of E-Voting in Indonesia remains necessary. The anticipated benefits of E-Voting in Indonesia include cost reduction in electoral processes, increased public participation, and improved speed and accuracy in generating election results.
Success stories of E-Voting integration in electoral processes have emerged from countries like Canada, Brazil, India, Estonia, and the Philippines. Out of the many countries that have tried to implement E-Voting, only five of them have achieved consistent success [4]. The failures in other countries can be attributed to various factors such as technological inadequacies [1], security concerns, readiness issues, and lack of public trust [2, 5], despite extensive research on E-Voting over the years [6]. According to the International IDEA's ICTs in Elections Database, out of the 178 studied countries [7], 34 countries have implemented E-Voting systems, either nationally or locally. Nevertheless, numerous countries have struggled with the implementation, primarily due to factors such as lack of voter confidence in technology, as witnessed in Ireland, Germany, and the United States. Data security has also been a significant impediment to the successful application of E-Voting, as observed in the Netherlands.
Given the vast discrepancy between the number of successful and unsuccessful attempts at E-Voting implementation in general elections worldwide, it is reasonable to hypothesize that technology is not the primary determinant of successful E-Voting implementation. This study, therefore, aims to identify the factors contributing to the successful implementation of E-Voting in general elections, how these factors can be adequately prepared by the state to ensure smooth and sustainable E-Voting processes, and how these factors can be leveraged to develop an effective E-Voting framework.
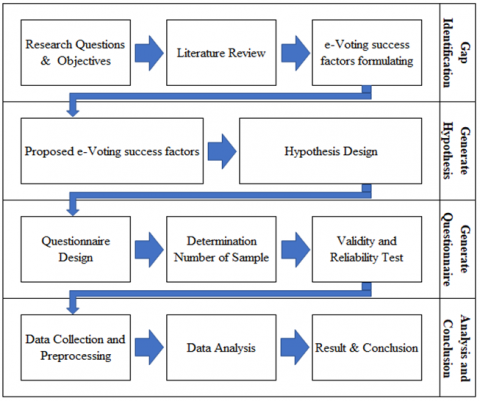
2.1 Research design
This research generally uses quantitative research with the following stages as shown in Figure 1.
2.2 PLS-SEM
PLS-SEM is a nonparametric multivariate statistical method used utilized for examining intricate relationship between variables [8]. In the PLS-SEM model, variables are cleaved into latent and manifest variables. Every latent variable is explained by the corresponding manifest variables. The PLS-SEM approach assesses the relationship between variables using two sequential models: a measurement model for evaluating the relationship between manifest variables and their latent counterparts and a structural model that examines the relations between latent variables [9]. The validity of each manifest variable and the reliability of every latent variable are measured by the measurement model (outer model).
Additionally, to ensure that the empirical data supports the PLS-SEM model, the structural model (inner model) must also be evaluated. Three indicators are utilized to examine the outer model: internal consistency, convergent validity, and discriminant validity. While for the structural model, index values of R2 and Q2 are used after the collinearity test and the significant level of the path coefficients carried out [10].
Figure 1. Research methodology
3.1 E-Voting success factors
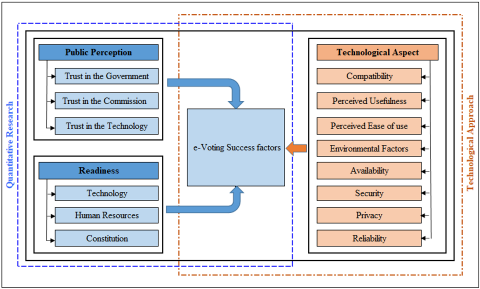
In previous research show that, at least 17 factors that influenced the successful implementation of E-Voting as shown in Table 1. We conclude that these factors can be grouped into 3 main factors, 1) Public Perceptions, 2). Readiness Aspect and 3) Technological Aspect.
In this study, the public perception and readiness aspect was carried out using quantitative research, while the technological aspect was carried out using a technological approach, which will be carried out in further research, The form of the E-Voting success factor mapping is illustrated in Figure 2.
The factors contained in the quantitative research border include public perception consisting of Trust in Government, Trust in Commissions, and Trust in Technology, as well as readiness consisting of the Readiness of Technology, Readiness of Human Resources, and Readiness of the Constitution to become the proposed E-Voting Success Factors.
Table 1. E-Voting success factors
|
[11] |
[12] |
[13] |
[14] |
[15] |
[16] |
[17] |
[18] |
[19] |
[20] |
[21] |
||
|
1 |
Trust in the Government |
X |
X |
X |
X |
X |
X |
|||||
|
2 |
Trust on the E-Voting |
X |
X |
X |
X |
X |
||||||
|
3 |
Trust toward Election Organizer |
X |
X |
X |
X |
|||||||
|
4 |
Compatibility |
X |
||||||||||
|
5 |
Relative Advantage |
X |
X |
|||||||||
|
6 |
Perceived usefulness |
X |
||||||||||
|
7 |
Perceived ease of use |
X |
X |
|||||||||
|
8 |
Complexity |
|||||||||||
|
9 |
Availability |
X |
X |
|||||||||
|
10 |
Security |
X |
X |
X |
X |
|||||||
|
11 |
Privacy |
X |
X |
|||||||||
|
12 |
Reliability |
X |
X |
|||||||||
|
13 |
Technological Readiness |
X |
X |
X |
X |
X |
X |
|||||
|
14 |
Organizational Readiness |
X |
X |
X |
X |
|||||||
|
15 |
Environmental Factors |
X |
||||||||||
|
16 |
Human Resources |
X |
X |
|||||||||
|
17 |
Policy and Law |
X |
X |
Figure 2. E-Voting success factors mapping
3.2 Hypothesis and data collection
From the E-Voting Success Factors mapping as shown in Figure 2, a hypotheses frame was built as follows:
From this hypothesis, 19 questionnaire questions were made to test the validity of each item and the reliability of each variable. The questionnaire build using Likert Scale consist of 5 available choices, 1) Strongly Disagree, 2) Disagree, 3) Neutral, 4) Agree and 5) Strongly Agree. Based on the results of the validity test using Pearson Moment with a significance level of 5% on the perceptions of 30 initial respondents, there was one question that was invalid with a r value less than 0.463, so it had to be excluded from the variable. Invalid questions come from the Trust in Technology variable, and then the remaining 18 questions in the questionnaire are used in the latent variable reliability test. The results of the reliability test showed that each variable met the Cronbach alpha value more than 0.6, with the lowest value is 0.623 and the highest value of 0.858. When the questionnaire is said to be valid and reliable, the next step is to collect data on the respondents.
In this research, respondents used were a sample of 11,632,816 voters in the province of West Java, Indonesia from the Indonesian General Elections Commission (KPU) in 2020. The minimum sample size was determined with an error margin of 5% using 4 formulas/ Table, 1) Taro Yamane, 2) Slovin, 3) Issac Table, and 4) Kreijcie and Morgan Table as state in [28-31].
Data collection was carried out from November 19 to December 4, 2021, using the google form and generated 415 feedbacks. This exceeded the minimum sample requirements according to Table 1 above, which means that the data from the questionnaire results are usable. From the 415 data points collected, 12 were incomplete, so the remaining 403 data points could be further analyzed.
3.3 Data analysis
Based on data collection, the 403 complete data sets have a distribution of respondent profiles in the form of age, education, and occupation, as presented in Table 2.
The next stage was the evaluation of the SEM-PLS model using SmartPLS 3.3.3, SEM-PLS is a non-parametric statistical method for analyzing complex relationships between latent variables. In SEM_PLS theory, the latent variable is a variable that cannot be measured directly, so it requires a manifest variable. Latent variables consist of endogenous variables (which is influenced) and exogenous variable (which influences). clearly presented in the questionnaire question items.
Table 2. Respondent data distribution
|
Respondent Data Description |
Category |
Frequency |
Percentage |
|
Age |
17-125 |
129 |
32 |
|
26-35 |
107 |
26.6 |
|
|
36-45 |
82 |
20.3 |
|
|
46-55 |
68 |
16.9 |
|
|
56-65 |
14 |
3.5 |
|
|
>65 |
3 |
0.7 |
|
|
Education |
Middle Scholl |
1 |
0.2 |
|
High School |
100 |
24.8 |
|
|
Bachelor |
198 |
49.1 |
|
|
Master |
92 |
22.8 |
|
|
Doctoral |
9 |
2.2 |
|
|
others |
3 |
0.7 |
|
|
Occupation |
Student |
92 |
22.8 |
|
Teacher |
12 |
3 |
|
|
Lecturer |
79 |
19.6 |
|
|
State Employee |
47 |
11.7 |
|
|
Private Employee |
95 |
23.6 |
|
|
Enterpreneur |
20 |
5 |
|
|
Unemployment |
27 |
6.7 |
|
|
others |
31 |
7.7 |
In this study, there are 7 latent variables, namely Trust in Government (TGV), Trust in Commission (TCM) and Trust in Technology (TTG), Readiness of Technology (RTI), Readiness of Human Resources (RHR) and Readiness of Constitution (RCS) and Success E-Voting Implementation (SEI). Each latent variable is explained by 2 or 3 manifest variables; so, the number of manifest variables is 19 items
Based on the research hypotheses, 7 possible SEM-PLS evaluation models were obtained. Each SEM-PLS model was evaluated; the results show that in 1 of 7 SEM-PLS models, there is a new phenomenon that strengthens the Readiness of E-Voting as presented in Figure 3 used to evaluate the successful E-Voting Implementation.
The SEM-PLS models were evaluated for the measurement model and structural model based on the results of the PLS-PLS-Algorithm, Bootstrapping, and Blindfolding procedures. The measurement model describes the relationship between the manifest variables and the latent variables, while the structural model describes the relationship between the latent variables in the model.
Figure 3. SEM-PLS model
Evaluation of the measurement models was carried out with the following objectives:
After evaluating the measurement model, the structural model was evaluated to determine a model's predictive ability and the relationships between latent variables in the model. Therefore, the following steps were taken.
Table 3. Internal consistency and AVE
|
Cronbach Alpha |
rho_A |
Composite Reliability |
AVE |
|
|
Readiness of Constitution |
0,852 |
0,874 |
0,931 |
0,870 |
|
Readiness of Human Resources |
0,836 |
0,838 |
0,924 |
0,859 |
|
Readiness of Technology Infrastructure |
0,687 |
0,687 |
0,865 |
0,762 |
|
Successful E-Voting Implementation |
0,848 |
0,849 |
0,908 |
0,767 |
|
Trust in Commission |
0,758 |
0,767 |
0,860 |
0,672 |
|
Trust in Government |
0,769 |
0,777 |
0,866 |
0,684 |
|
Trust in Technology |
0,750 |
0,755 |
0,856 |
0,665 |
Table 4. Fornell-Larcker criterion
|
RCS |
RHR |
RTI |
SEI |
TCM |
TGV |
TTG |
|
|
RCS |
0,933 |
||||||
|
RHR |
0,650 |
0,927 |
|||||
|
RTI |
0,587 |
0,673 |
0,873 |
||||
|
SEI |
0,643 |
0,638 |
0,620 |
0,876 |
|||
|
TCM |
0,505 |
0,649 |
0,560 |
0,529 |
0,820 |
||
|
TGV |
0,398 |
0,474 |
0,528 |
0,513 |
0,498 |
0,827 |
|
|
TTG |
0,540 |
0,540 |
0,606 |
0,581 |
0,540 |
0,584 |
0,815 |
Table 5. Inner VIF
|
RCS |
RHR |
RTI |
SEI |
TCM |
TGV |
TTG |
|
|
RCS |
1,733 |
1,572 |
|||||
|
RHR |
1,733 |
||||||
|
RTI |
1,000 |
||||||
|
SEI |
|||||||
|
TCM |
1,464 |
1,493 |
|||||
|
TGV |
1,657 |
||||||
|
TTG |
1,670 |
1,570 |
Table 6. Path coefficient
|
Original Sample (O) |
Sample Mean (M) |
Standard Deviation (STDEV) |
T Statistics (|O/STDEV|) |
P Values |
|
|
RCS -> TCM |
0,144 |
0,143 |
0,045 |
3,174 |
0,002 |
|
RCS -> TGV |
0,031 |
0,031 |
0,057 |
0,545 |
0,586 |
|
RHR -> TCM |
0,555 |
0,559 |
0,051 |
10,947 |
0,000 |
|
RTI -> TTG |
0,606 |
0,606 |
0,036 |
16,600 |
0,000 |
|
TCM -> SEI |
0,267 |
0,267 |
0,069 |
3,861 |
0,000 |
|
TCM -> TGV |
0,264 |
0,265 |
0,060 |
4,407 |
0,000 |
|
TGV -> SEI |
0,182 |
0,187 |
0,068 |
2,691 |
0,007 |
|
TTG -> SEI |
0,340 |
0,340 |
0,065 |
5,224 |
0,000 |
|
TTG -> TGV |
0,434 |
0,435 |
0,057 |
7,652 |
0,000 |
Table 7. Coefficient of determination
|
R Square |
R Square Adjusted |
|
|
Successful E-Voting Implementation |
0,432 |
0,428 |
|
Trust in Commission |
0,433 |
0,430 |
|
Trust in Government |
0,397 |
0,393 |
|
Trust in Technology |
0,367 |
0,365 |
Table 8. F2 score
|
RCS |
RHR |
RTI |
SEI |
TCM |
TGV |
TTG |
|
|
RCS |
0,021 |
0,001 |
|||||
|
RHR |
0,314 |
||||||
|
RTI |
0,580 |
||||||
|
SEI |
|||||||
|
TCM |
0,086 |
0,077 |
|||||
|
TGV |
0,035 |
||||||
|
TTG |
0,122 |
0,199 |
Table 9. Q2 score
|
Q2 |
|
|
Readiness of Constitution |
|
|
Readiness of Human Resources |
|
|
Readiness of Technology Infrastructure |
|
|
Successful E-Voting Implementation |
0,322 |
|
Trust in Commission |
0,283 |
|
Trust in Government |
0,266 |
|
Trust in Technology |
0,234 |
3.4 Results
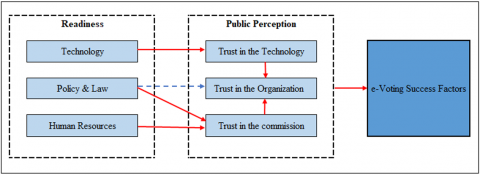
Based on the data analysis and measurements, the results are as presented in Table 10, and Figure 4 below shows an illustration of the new success factor of E-Voting.
The results of quantitative research show that there is a new phenomenon, namely, a change in the proposed E-Voting success factors, which strengthens the factors that influence the success of E-Voting.
Table 10. Data analysis result
|
Variables |
Effect |
Variables |
|
Readiness of Technology / Infrastructure |
Significant effect |
Trust in Technology |
|
Readiness of Constitution |
Unsignificant effect |
Trust in Government |
|
Readiness of Constitution |
Significant effect |
Trust in Commission |
|
Readiness of Human Resources |
Significant effect |
Trust in Commission |
|
Trust in Technology |
Significant effect |
Trust in Government |
|
Trust in Commission |
Significant effect |
Trust in Government |
|
Trust in Technology |
Significant effect |
Success E-Voting |
|
Trust in Government |
Significant effect |
Success E-Voting |
|
Trust in Commission |
Significant effect |
Success E-Voting |
Figure 4. Success factors of E-Voting
The hypothesis that trusts in the government, trust in the commission, trust in technology, technology readiness, human resources readiness, and constitution readiness greatly affects the readiness of general elections using E-Voting is accepted. Furthermore, there is a new phenomenon, a change in the proposed success factor of E-Voting, which further increases the effect of the factors that affect success of E-Voting implementation for general election.
For further research, it is recommended to technological research and design an E-Voting framework as the development of this research. This will undoubtedly contribute to the development of E-Voting technology and its implementation for countries, institutions, or organizations that plan to improve their elections system from conventional to digital.
[1] Riera, A., Brown, P. (2003). Bringing confidence to electronic voting. Electronic Journal of e-Government, 1(1): 14-21.
[2] Goretta, H., Purwandari, B., Kumaralalita, L., Anggoro, O.T. (2018). Technology criteria analysis and E-voting adoption factors in the 2019 Indonesian presidential election. In 2018 International Conference on Advanced Computer Science and Information Systems (ICACSIS), Yogyakarta, Indonesia, pp. 143-149. Https://doi.org/10.1109/ICACSIS.2018.8618215
[3] Budurushi, J., Jöris, R., Volkamer, M. (2014). Implementing and evaluating a software-independent voting system for polling station elections. Journal of Information Security and Applications, 19(2): 105-114. https://doi.org/10.1016/j.jisa.2014.03.001
[4] Wang, K.H.K., Mondal, S.K., Chan, K.C., Xie, X. (2017). A review of contemporary E-Voting: Requirements, technology, systems and usability. Data Science and Pattern Recognition, 1(1): 31-45.
[5] Risnanto, S., Rahim, Y.A., Mohd, O., Abdurrohman, A. (2022). E-Voting: Technology requirements mapping. TEM Journal, 11(3): 1282-1290. http://dx.doi.org/10.18421/TEM113-37
[6] Avgerou, C. (2013). Explaining trust in IT-mediated elections: A case study of E-Voting in Brazil. Journal of the Association for Information Systems, 14(8): 420-451. https://doi.org/10.17705/1jais.00340
[7] Pieters, W. (2006). Acceptance of voting technology: between confidence and trust. In: Stølen, K., Winsborough, W.H., Martinelli, F., Massacci, F. (eds) Trust Management. iTrust 2006. Lecture Notes in Computer Science, vol. 3986. Springer, Berlin, Heidelberg. https://doi.org/10.1007/11755593_21
[8] Sharma, P.N., Shmueli, G., Sarstedt, M., Danks, N., Ray, S. (2021). Prediction-oriented model selection in partial least squares path modeling. Decision Sciences, 52(3): 567-607. https://doi.org/10.1111/deci.12329
[9] Hair Jr, J.F., Hult, G.T.M., Ringle, C.M., Sarstedt, M., Danks, N.P., Ray, S. (2013). Partial Least Squares Structural Equation Modeling (PLS-SEM) Using R. Springer Cham, 46: 1-12. https://doi.org/10.1007/978-3-030-80519-7
[10] Mardiana, N., Farhansyah, A., Nurdiawan, O., Nurhayati, L., Risnanto, S. (2020). COVID-19 website quality towards user satisfaction and intention to use analysis using partial least square-structural equation modeling. In 2020 14th International Conference on Telecommunication Systems, Services, and Applications, TSSA, Bandung, Indonesia, pp. 1-5. https://doi.org/10.1109/TSSA51342.2020.9310808
[11] Alomari, M.K. (2016). Digital divide impact on E-Voting adoption in middle eastern country. In 2016 11th International Conference for Internet Technology and Secured Transactions (ICITST), Barcelona, Spain, pp. 409-412. https://doi.org/10.1109/ICITST.2016.7856741
[12] Aljarrah, E., Elrehail, H., Aababneh, B. (2016). E-Voting in Jordan: Assessing readiness and developing a system. Computers in Human Behavior, 63: 860-867. http://dx.doi.org/10.1016/j.chb.2016.05.076
[13] Adeshina, S.A., Ojo, A. (2020). Factors for E-Voting adoption-analysis of general elections in Nigeria. Government Information Quarterly, 37(3): 101257. http://dx.doi.org/10.1016/j.chb.2016.05.076
[14] Shuaibu, A., Mohammed, A., Ume, A. (2017). A framework for the adoption of electronic voting system in Nigeria. International Journal, 7(3): 258-268. http://dx.doi.org/10.23956/ijarcsse/v7i3/01310
[15] Mpekoa, N., van Greunen, D. (2017). E-Voting experiences: A case of Namibia and Estonia. In 2017 IST-Africa Week Conference (IST-Africa) Windhoek, Namibia, pp. 1-8. http://dx.doi.org/10.23919/ISTAFRICA.2017.8102303
[16] Hapsara, M. (2013). E-Voting Indonesia: A safety-critical-systems model towards standard and framework for Indonesia’s presidential election. In International Conference on Information Technology, pp. 81-86.
[17] Risnanto, S., Abd Rahim, Y., Mohd, O., Effendi, A., Perdana, R.S. (2021). E-Voting: Security, threats and prevention. In 2021 15th International Conference on Telecommunication Systems, Services, and Applications (TSSA) Bali, Indonesia, pp. 1-8. http://dx.doi.org/10.1109/TSSA52866.2021.9768214
[18] Sensuse, D.I., Pratama, P.B. (2020). Conceptual model of E-Voting in Indonesia. In 2020 International Conference on Information Management and Technology (ICIMTech) Bandung, Indonesia, pp. 387-392. http://dx.doi.org/10.1109/ICIMTech50083.2020.9211156
[19] Osho, L.O., Abdullahi, M.B., Osho, O. (2016). Framework for an E-Voting system applicable in developing economies. DSpace Repository. http://dx.doi.org/10.5815/ijieeb.2016.06.02
[20] Salimonu, R.I., Osman, W.R.B.S., Shittu, A.J.K., Jimoh, R.G. (2013). Adoption of E-Voting system in Nigeria: A conceptual framework. International Journal of Applied Information System, 5(5): 8-14. http://dx.doi.org/10.5120/ijais13-450912
[21] Eraky, A. (2017). E-Voting implementation in Egypt. Journal of Contemporary Eastern Asia, 16(1): 48-68. https://doi.org/10.17477/jcea.2017.16.1.048
[22] Kozel, E., Dečman, M. (2022). The impact of trust in government-young voters’ behavioral intention to use I-Voting in Slovenia. NISPAcee Journal of Public Administration and Policy, 15(1): 61-87. https://doi.org/10.2478/nispa-2022-0004
[23] Warkentin, M., Sharma, S., Gefen, D., Rose, G.M., Pavlou, P. (2018). Social identity and trust in internet-based voting adoption. Government Information Quarterly, 35(2): 195-209. https://doi.org/10.1016/j.giq.2018.03.007
[24] Widhiasthini, N.W. (2022). The application of E-Voting in general election: Will it be possible? CosmoGov: Jurnal Ilmu Pemerintahan, 8(2): 88-103. https://doi.org/10.24198/cosmogov.v8i2.42443
[25] Rahmanto, F., Nurmandi, A., Dewi, D.S.K., Salahudin, S. (2021). Stakeholder trust in the use of E-Voting: organizing the election of simultaneous village heads in Sleman Regency 2020. Politik Indonesia: Indonesian Political Science Review, 6(1): 32-52. https://doi.org/10.15294/ipsr.v6i1.23038
[26] Zhu, Y.Q., Azizah, A.H., Hsiao, B. (2021). Examining multi-dimensional trust of technology in citizens’ adoption of E-Voting in developing countries. Information Development, 37(2): 193-208. https://doi.org/10.1177/0266666920902819
[27] Budiana, M. (2022). The use of E voting in the general election system in Indonesia. Legal Brief, 11(5): 2656-2662. https://doi.org/10.35335/legal.v11i5.527
[28] Silalahi, U., Atif, N.F. (2015). Metode penelitian sosial kuantitatif. Refika Aditamma.
[29] Creswell, J., Creswell, D. (2018). Research Design: Qualitative, Quantitative, and Mixed Methods Approaches. SAGE Publications.
[30] Idris, I. (2019). Exploring organizational culture, quality assurance, and performance in higher education. Management and Economics Journal, 3(2): 166-181. http://dx.doi.org/10.18860/mec-j.v3i2.7529
[31] Jufrizen, J. (2018). The effect of organizational culture and Islamic work ethic on permanent lecturers’ job satisfaction, organizational commitment and work performance (No. mq2xz). Center for Open Science. http://dx.doi.org/10.31219/osf.io/mq2xz