Hayder Razzaq Abed*![]() | Hatim A. Rashid
| Hatim A. Rashid![]()
© 2023 IIETA. This article is published by IIETA and is licensed under the CC BY 4.0 license (http://creativecommons.org/licenses/by/4.0/).
OPEN ACCESS
Knowing and developing the construction organizations' maturity level in risk management is critical to ensure they achieve their strategic objectives. This paper aims to design a new construction organizations’ risk-management maturity model (C.ORM3) using new hybrid techniques and a distinct validation strategy based on global and local experience, to assess risk management maturity level in developing countries. A multi-steps methodology was adopted in this research. The study adopted an excessive systematic literature reviews of 22 previous articles on RM maturity and four standards and guidelines for eliciting model components. These components include five attributes with 26 capabilities; 24 capabilities identified from literature review and 2 from experts. These capabilities are evaluated against five levels: immature, ad-hoc, standard, managed, and optimized. The authors adopted a new strategy for validating the model by three groups of global and local experts and verifying the proposed model in a realistic-world case study. This study is the first to use a hybrid method based on the Fuzzy Analytic Hierarchy Process (FAHP) and Fuzzy Synthetic Evaluation (FSE) techniques in evaluating RM maturity (RMM). Iraqi construction organizations validate the practicality of the model. The results showed that the overall RMM level of the Iraqi construction sector is 1.52, between immature and ad-hoc. The model has been converted into a computer template for ease of use by organizations. This study concluded that the suggested C.ORM3 helpful for construction organisations to evaluate their current state of RM and plan for future development.
construction organization, RM maturity, developing countries, FAHP, fuzzy synthetic approach, RMM after COVID-19, Mahalanobis distance
A risk is an event or set of circumstances that, if they occur, have the potential to have either a good or bad impact on the objectives of a project [1]. Risk management entails determining the uncertainty sources (risk identification), calculating the probability and consequences of uncertain conditions or events on a project (risk analysis), formulating response strategies, and subsequently monitoring and reporting throughout the entirety of a project, has become common among construction companies [2]. The maturity of organizations is needed in the knowledge of project management. This will coordinate and direct the implementation of the project by organizational strategy [3]. Risk-mature firms have a culture of openness, understanding, and sensitivity to operational risks and social and financial obligations to stakeholders, the public, and the environment [4]. Thus, a mature organization can achieve an acceptable risk level with minimal losses. The primary advantages of RM maturity (RMM) for project risk management and project management are (I) recognizing risk management's strengths and weaknesses in organizations and projects; (II) offering information that can be used as a benchmark; (III) comparing achievements against PM standards; (IV) identify possibilities for continuing growth; (V) enables an enterprise to enhance its performance indicators [5]. There is a strong relationship between RMM and project success, where it is necessary to use a framework of RM3 in order to identify areas of improvement in projects or organizations and to measure progress in the development of risk management [6, 7].
In recent years, numerous risk maturity models for construction projects have been developed. In 1997, Hillson highlighted the need for a formalized and uniform maturity model to assist firms in developing and improving their risk management processes [8]. This was the first RM maturity model. Zou et al. [9] developed an RMM measuring tool on the Web for the construction industry consisting of five attributes assessed against four levels distributed on a scale from 0 to 1. Using the viewpoints of Chinese construction firms (CCFs), Zhao et al. [10] evaluated 66 best practices of enterprise risk management (ERM) and 16 essential ERM maturity factors that were adopted through reviewing previous studies and expert opinions. Bhosale et al. [11] assessed the present RM procedures of highway construction projects and contractors using the RMMM. The model consists of four levels for evaluating nine attributes. Abdulrahman et al. [12] created an RMMM for Abuja construction organizations participating in Joint Venture projects. This model has four attributes from previous studies measured by five levels. This model has four attributes from previous studies measured by five levels.
Despite the variety of available RMMs, all have two primary components. First, RMMs establish a collection of levels describing the evolution of a project. The second component pertains to measured items: their attributes or capabilities [13]. In previous risk maturity models, many strategies were used for the purpose of verifying the validity of the model and its suitability for the purpose for which it was designed, as well as the diversity of maturity levels in these models and the difference of the examined criteria. most prior models adopted weak processes of validation [13, 14]. Table 1 illustrate validation strategies, maturity level and numbers of criteria used in each RM maturity model.
Table 1. Illustrate validation strategy, maturity level, and criteria for different maturity models
|
Model name |
Validation strategy |
Maturity level |
Criteria |
|
Risk Management Capability Maturity Model [15] |
Literature review & case studies |
5 |
4 |
|
RM3 for construction [16] |
Literature review and five case studies |
4 |
4 |
|
Risk management capability [17] |
Literature review and survey |
5 |
6 |
|
RMM of construction organization [18] |
Literature review & 16 case studies |
4 |
4 |
|
RMM for construction projects [19] |
Literature reviews and questionnaire surveys by 346 participants |
4 |
4 |
|
GRMM [13] |
Literature reviews & two panels of local experts |
Score system |
7 |
|
CRMA [20] |
Literature review & Delphi technique with 28 experts |
- |
5 |
The current study's authors believe that most of the previous models are not suitable for organizations in developing countries. The reason for this belief is that most RMMMs associated in construction organizations depend on four levels to find the maturity of RM, or they lack a detailed explanation of the characteristics of each level. According to Čech and Januška [21], the use of four levels of maturity is not suitable for organizations that do not have experience in risk management, such as in developing countries. Also, the lack of a detailed explanation of each level for each attribute will create ambiguity about the exact level of maturity, especially in companies that lack experience in risk management, as is the case in developing countries. Thus, the authors concluded that the existing models might be inappropriate and there is a need to develop a new model with more than four levels of assessment, with the need to provide a detailed explanation for each level to facilitate the assessment process accurately.
Reviewing the past literature for various RMMs, the authors identified some shortcomings in these models:
(1). Most previous models are unsuitable for organizations in developing countries with poor RM.
(2). Most of these models couldn’t tackle all RM phases.
(3). Most of previous models used ineffective validation strategies [13, 14].
(4). Most of the earlier models did not explain the features of the attributes and capabilities' levels appropriately and understandably. This may sometimes lead to the unreliability of participants' choices.
(5). The relative weight of attributes and capabilities was based on participant opinions, which may not be accurate specially in organizations with weak risk management culture, such as those in developing countries.
(6). Most models only used the knowledge of local experts and simple algorithms that may give inaccurate results of the RMM.
(7). Previous models did not highlight the maturity of risk management for construction companies after the crisis, like COVID-19.
As a consequence of the above, the aim of this research is developing a novel model that overcomes the shortcomings of current ones by using new hybrid techniques and a distinct validation strategy based on global and local experience and real-world application to evaluate RMM of construction organizations in the developing countries.
This article has the following organization: A literature review is explained in section 2. The methodology of the research is explained in section 3. Section 4 discusses the field work. This section explains the components and techniques used in proposed model. Section 5 outlines the face validity with expert panels to confirm proposed model. Section 6 represents the results of executing the model through a real-world case study, and in section 7, the conclusions are given.
In several practical situations, crisp data cannot be utilized for modelling. In different circumstances, human decisions and judgments are often subjective, unclear, and ambiguous and thus cannot be quantified with precise values [22]. Zadeh [23] invented the theory of fuzzy set, which could be utilised to address the vagueness of human judgements and cognitions. Using partial set membership functions instead of crisp ones offers mathematical advantages for addressing ambiguities associated with human reasoning. Although there is a long history of fuzzy set theory in various fields, its use in construction management is relatively recent compared to other engineering fields [24]. The construction industry has unique features and a lack of historical data in specific areas; therefore, this technique is considered a robust modelling approach and well-suited for the construction industry [25, 26]. Many risk assessment techniques are used, such as FAHP, Bayesian network, and Grey System theory.
FAHP is typically utilized in multi-attribute analyses and structured hierarchical judgment cases and is superior to AHP in producing importance weight vectors for decision-making. [27]. FAHP is an enhanced approach based on conventional AHP that employs fuzzy values to evaluate uncertainties in converting the preferences of humans into a scoring approach while evaluating various selection criteria [28].
Fuzzy Synthetic Evaluation technique (FSE) is essential for assessing risks in ambiguous environments. The FSE is a subclass of the fuzzy set methods that may cope with ambiguous, opinionated, and imprecise evaluation issues [12]. It aims to offer a synthetic assessment of an item concerning a goal in a fuzzy-decision environment, including several criteria [17]. The benefit of FSE is that the influence of numerous related components may be assessed thoroughly based on their weight. It has been extensively used in environmental decision-making and evaluation procedures. The merging of FAHP and FSE is intended to reduce the ambiguity inherent in Likert-type variables and eliminate subjective assessments. However, little research has integrated these techniques [29].
As a consequence, integrating FAHP and FSE is used in this proposed model. In this study, the authors will use the (FAHP) technique (Extent Analysis method, known as Chang approach) to calibrate the weight vector of the attributes and capabilities. These weights will then be used in the equations of the Fuzzy Synthetic Evaluation (FSE) technique, as the (FSE) technique will be used to measure and assess the maturity level for these attributes and capabilities. However, the aggregation of these techniques has not yet been used for the maturity assessment of risk management; hence, this work contributes to the existing literature on forecasting and assessing risk management maturity.
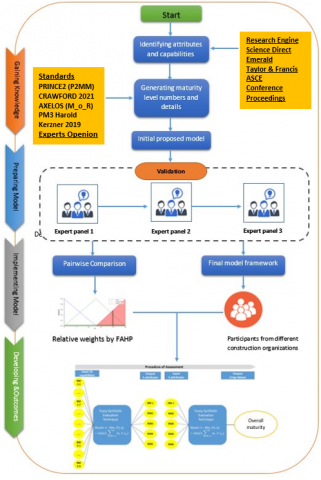
The Construction Organization Risk Management Maturity Model (C.ORM3) conceptual framework is a set of steps to use this strategy implementation framework. This model consists of five stages:
(1). Stage one: In this stage, excessive systematic literature reviews to extract a set of possible attributes, capabilities, and maturity levels. The output of this stage is initial form of the survey.
(2). Stage two: Validating and confirming the outputs of the stage one through expert interviewes with 3 experts’ panels. The output of this stage is final form of model’s survey.
(3). Stage three: Calibrating the weight vector of attributes and capabilities of the proposed model by adopting pairwise comparisons collected from second panel of experts. FAHP technique will be utilized for calculating weights.
(4). Stage four: Applying the final form of survey in a real case study and calculate the level of RMM in construction organizations by integrating weights vector from FAHP with fuzzy synthetic evaluation technique (FSE).
(5). Stage five: Design a template for the proposed model.
Figure 1 below illustrates the conceptual framework of C.ORM3.
Figure 1. Conceptual framework of C.ORM3
The expert interview is a very successful method for acquiring data from participants, essential for understanding or investigating complex phenomena or situations. A successful interview is an art form of exploring the beliefs and perspectives of the participants and their topic expertise [30]. During preparing this framework, the authors will rely on three panels of experts. Those experts consisted of academics and specialists in the construction industry. Details of the experts are in Appendix A.
4.1 Attributes and capabilities
The attributes and capabilities constitute the model's core. They will determine the model's meaning and function [21]. Excessive systematic literature reviews of 22 models dealing with the RMM were undertaken to derive capabilities. These capabilities are the issues and concerns being questioned. First, the authors identified 24 capabilities and categorized them under five attributes. Table 2 describes the attributes and capabilities and their references.
Table 2. The attributes and capabilities of C.ORM3 and their references
|
Attributes |
Capabilities |
References |
|
RM1 Risk management culture & knowledge |
Attitude about RM |
[12, 15-21, 31, 32] |
|
Risk management policy |
[8, 10, 13, 15, 18, 32, 33] |
|
|
RM communication |
[9, 10, 12, 15-17, 19, 21, 31, 33-35 |
|
|
Commitment of senior management |
[9, 10, 12, 13, 15, 16, 19-21, 32-35] |
|
|
Responsibility and authority |
[9, 10, 15, 17, 20, 21, 31, 33] |
|
|
RM objectives |
[12, 15, 19, 20] |
|
|
RM2 Risk management processes |
Capability of plan RM |
[10, 13, 15, 18, 19, 21, 36-39] |
|
Capability of identifying risks |
[9-12, 15-21, 33, 36-39] |
|
|
Capability of risk analysis |
[9-12, 15-21, 33, 34, 36-39] |
|
|
Capability of risk response |
[9-12, 15-21, 33, 36-39] |
|
|
Monitoring and controlling risks |
[9-12, 15, 16, 18-21, 33, 36-39] |
|
|
RM3 Risk management resources |
Allocating the budget for RM |
[9-11, 13, 15-19, 21, 33, 35] |
|
Dedicated team for RM |
[9, 10, 12, 15, 16, 19, 33] |
|
|
Training |
[10, 15, 16, 18-20, 33, 34] |
|
|
Allocating time of RM |
[8, 13, 35] |
|
|
RM4 Risk management practice |
RM formalization |
[9, 10, 12, 16, 19-21, 33, 35] |
|
Key stakeholders |
[13, 15, 33, 35] |
|
|
RM documentation |
[10, 14, 15, 16, 18, 19, 35] |
|
|
RM scope |
[16, 18, 21, 33] |
|
|
Integrated RM with PM tasks |
[10, 15, 16, 19, 21, 31-34] |
|
|
RM5 continuous Improvement |
Change management |
[21, 33] |
|
Research in developing RM |
[33] |
|
|
Reviewing performance |
[10, 13, 15, 17, 20, 21, 31, 33] |
|
|
Risk audit |
[9, 12, 13, 21, 33] |
4.2 Proposed C.ORM3 levels
The authors believe that maturity levels are the most crucial aspect of the model, which demands precision and abundant information. Most prior models provide just a basic description of the maturity levels and lack detailed explanations of each risk management criterion in the models.
The number of maturity model levels ranged from four to six in the twenty-two risk maturity models used across several industries that were analyzed [40]. It has been argued that having six maturity levels provides too much granularity, making it difficult to describe the difference between one level and another. Similarly, it is difficult for users of the model to determine what level of maturity they have attained for a specific capability. On the other hand, using just four levels in the maturity model makes it impossible for organizations and projects to express suitable phases of incremental development and restricts the model's ability to evaluate an organization without risk management experience, as in many construction organizations in developing countries. Therefore, selecting five levels allows for a more precise distinction of the organization’s maturity [21, 32]. In contrast, some research asserts that choosing five maturity levels may lead participants to select the "middle level" [9]. The authors of current study believe that selecting ''middle level'' is because earlier models lack a description of the levels, where they are restricted to single expressions such as "not applied," "high application," and "naive," etc., or others offer just a basic explanation of the level without delving into detailed descriptions relevant to each capability of the model. Thus, the participant may be left in a state of uncertainty about ''which is the suitable level for each criterion?'' and ultimately choose the middle level.
The authors had long discussions about maturity levels and scale points based on the above. It was decided that the proposed model would have five levels so that all construction organizations in both developing and advanced countries could use it. These levels are: (level 1: Immature); (level 2: Ad-hoc); (level 3: Standard); (level 4: Managed), (level 5: Optimized). Detailed descriptions of all levels in each question (capability) would be needed to ensure the right level was chosen and stop people from picking the "middle-level" option. After a two-month search, no standard, guideline, or model covered all the studied attributes and capabilities to provide these descriptions. Consequently, the authors integrated four significant modern standards and guidelines to elicit the required statements. Adjustments were made to formulating these statements to make it easier for participants. The modern standards and guidelines are:
(1). "PRINCE 2 Maturity model (P2MM)" standard, version 2.1 from Axelos. Based on PRINCE 2 publication [41]. This standard model consists of five levels and discusses many areas of project management, like risk management, financial management, stakeholder management, etc., published in 2010.
(2). "Managing of Risk (M_o_R)": It is a guide that aims to develop a framework that helps organizations manage risks with high efficiency. This guide describes a maturity model (in Appendix D) consisting of five maturity levels, released in 2010 from AXELOS [42].
(3). "Project Management Maturity Model (PM3)" by Crawford 4th edition which reflects the logic of the PMBOK 6 standard [43]. This guide consists of five levels and measure the maturity of knowledge area in PMBOK 6.
(4). "Using the Project Management Maturity Model: Strategic Planning for Project Management" by Harold Kerzner 3rd edition [5]. It is a book prepared by one of the greatest management experts, ''Harold Kerzner''. The designed model consists of five levels to evaluate all organizations of all sizes.
4.3 Fuzzy Analytic Hierarchy Process (FAHP)
Fuzzy AHP is the most widely utilized multi-attribute decision_making methods under fuzzy conditions. The AHP tool, developed in the 1970s by Saaty, is an effective method for making decisions when there are several criteria to choose from. It was not possible to fully capture human thinking using the conventional AHP. Therefore, the authors used the FAHP to obtain accurate results. In this study, Chang's fuzzy AHP approach calculates the weights of the attributes and capabilities. The following actions comprise the fuzzy AHP [44]:
Table 3. Linguistic expressions for pairwise comparison [45]
|
Linguistic expression |
Equivalent fuzzy number |
Triangular fuzzy numbers |
The reciprocal scale of fuzzy |
|
Importance is equally |
1 |
(1, 1, 1) |
(1, 1, 1) |
|
Importance range from equal to Moderate |
2 |
(1, 2, 3) |
(1/3, 1 /2, 1) |
|
Moderate |
3 |
(2, 3, 4) |
(1/4, 1 /3, 1 /2) |
|
Moderately to strongly important |
4 |
(3, 4, 5) |
(1/5, 1 /4, 1 /3) |
|
Strong importance |
5 |
(4, 5, 6) |
(1/6, 1 /5, 1 /4) |
|
Strongly to very strongly importance |
6 |
(5, 6, 7) |
(1/7, 1 /6, 1 /5) |
|
Very strongly important |
7 |
(6, 7, 8) |
(1/8, 1 /7, 1 /6) |
|
Very strongly to extremely_important |
8 |
(7, 8, 9) |
(1/9, 1/8, 1/7) |
|
Extreme important |
9 |
(8, 9, 9) |
(1/9, 1/9, 1/8) |
$\begin{gathered}A=(a, b, c) ; K=1,2,3, \ldots , k \\a_{i j}=\left(\prod_{i=1}^n a_{i j_k}\right)^{1 / n}\end{gathered}$ (1)
where, A: triangular fuzzy number; K: number of experts; aij: relative importance.
Let $M_{g_i}^1, M_{g_i}^2, M_{g_i}^3, \ldots \ldots, M_{g_i}^m$ where m is the values of extent analysis, i= 1,2,3,…..,n, while $M_{g_i}^j$ is the (TFN), j= 1,2,3,….m. So, in the Eq. (2), the fuzzy synthetic extent magnitude with regard to ''i th'' object can illustrated:
$S_i=\sum_{j=1}^m M_{g_i}^j \otimes\left[\sum_{i=1}^n \sum_{j=1}^m M_{g_i}^j\right]^{-1}$; (2)
To determine the magnitude of ($\sum_{j=1}^m M_{g_i}^j$), a fuzzy addition operation is utilized of (m) extent analysis values:
$\sum_{j=1}^m M_{g_i}^j=\left(\sum_{j=1}^m l_j, \sum_{j=1}^m m_j, \sum_{j=1}^m u_j\right)$; (3)
$\sum_{i=1}^n \sum_{j=1}^m M_{g i}^j=\left(\sum_{i=1}^n l_i, \sum_{i=1}^n m_i, \sum_{i=1}^n u_i\right)$, (4)
Then, determine the reverse of the vector (4) as explained in the Eq. (5):
$\left[\sum_{i=1}^n \sum_{j=1}^m M_{g_i}^j\right]^{-1}=\left(\frac{1}{\sum_{j=1}^m u_j}, \frac{1}{\sum_{j=1}^m m_j}, \frac{1}{\sum_{j=1}^m l_j}\right) ;$ (5)
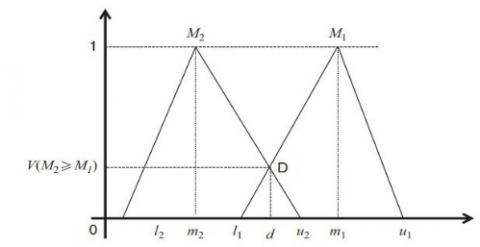
I. After calculating Si, the degree of possibility for a two fuzzy numbers {M2=(l2, m2, u2)≥M1=(l1, m1, u1)} will be computed as follows Eq. (6) below:
$\begin{gathered}V\left(M_2 \geq M_1\right)=h g t\left(M_1 \cap M_2\right)=\lambda_{M_2}(d)= \left\{\begin{array}{lc}1 & \text { if } m_2 \geq m_1 \\ 0 & \text { if } l_1 \geq u_2 ;\\ \frac{\left(l_1-u_2\right)}{\left(m_2-u_2\right)- \left(m_1-l_1\right)} o . w\end{array}\right.\end{gathered}$ (6)
(d) represents the highest point’s ordinate of interaction between $\left(\mu_{M_1}\right) \&\left(\mu_{M_2}\right)$. Figure 2 explained that:
Figure 2. Illustrate highest point between M1 & M2 [44]
The possibility degree that a convex-fuzzy number is greater than k convex-fuzzy numbers can be explained as follows:
$\begin{gathered}M_i(i=1,2,3, \ldots \ldots \ldots \ldots, k) \\ V\left(M \geq M_1, M_2, M_3, \ldots, M_K\right)=V\left[\left(M \geq M_1\right) \text { and } \times\right. \left.\left(M \geq M_2\right) \ldots \ldots \&\left(M \geq M_k\right)\right] \\ \min V\left(M \geq M_K\right)\end{gathered}$ (7)
The weight vector will be computed by Eq. (9) based on the assumption of Eq. (8) as follows:
$d^{\prime}\left(A_i\right)=\min \left\{V\left(S_i \geq S_k\right)\right\}$, (8)
where, k= 1,2,3,…..,n; but k≠i.
$W^{\prime}\left\{d^{\prime}\left(A_1\right), d^{\prime}\left(A_2\right), \ldots \ldots \ldots, d^{\prime}\left(A_n\right)\right\}^T$; (9)
where, Ai(i=1,2,3,……,n.).
Final step represents calculating normalized weight vector:
$W=\left\{d\left(A_1\right), \ldots, d\left(A_3\right), \ldots \ldots, d\left(A_n\right)\right\}^T$ (10)
W: represent Crisp magnitude of parameters.
4.4 Fuzzy Synthetic Evaluation Technique (FSE)
The authors will use this technique to assess the level of RMM possessed by construction organizations. This technique consists of three elements [46, 47]:
$\begin{gathered}(M F)= \frac{X 1}{\text { Immature }}, \frac{X 2}{A d-h o c}, \frac{X 3}{\text { Standard }}, \frac{X 4}{\text { Managed }}, \frac{X 5}{\text { Optimized }}\end{gathered}$ (11)
where, MF denotes the membership function, and X represents the percentage of total respondents who chose a specific risk management maturity level.
Model $3 M(\bullet, \oplus), b j=\min \left(1, \sum_{i=1}^m\left(w_i \times r_{i j}\right)\right)$; (12)
where, bj: member function of attributes or overall maturity level.; $\oplus$ represent the summation of weights and MF; Wi: is relative weight of capabilities & attributes i=(1, 2,..,m); M: number of capabilities or attributes.
Finally, after obtaining the membership function of all attributes as well as overall maturity level, finding de-fuzzification of TMF to compute a crisp number according to Eq. (13):
$C=\sum_{i=1}^n\left(W_i \times R_k\right) \times L ;$ (13)
where, C: crisp number of attributes or overall maturity level.; Rk: degree of TMF of capabilities or attributes; L: linguistic variable (1=immature; 2=ad-hoc; 3=standard; 4=managed; 5=optimized).
After gathering the proposed model's components, the authors produced the model's preliminary form. As outlined in the following section, substantial attempts were made to validate the number of maturity levels and detailed descriptions of the proposed model through expert interviews with three panels of global and local experts:
6.1 Development relative weights of attributes and capabilities
By using Eqns. (1-10) in the following manner, the authors will utilize a numerical example to demonstrate how to apply the FAHP technique to the four capabilities that make up ''RM Resources'':
By collecting each column of above vectors, the result is (12.976, 17.978, 24.086). The reverse of calculated vector is (0.04151794, 0.055624042, 0.077062884). Now:
$S_i$ for $R M_{3.1}$ = (0.1725, 0.3666, 0.6872);
$S_i$ for $R M_{3.2}$ = (0.0893, 0.145063, 0.29789);
$S_i$ for $R M_{3.3}$ = (0.13839, 0.23537, 0.40867);
$S_i$ for $R M_{3.4}$ = (0.1386, 0.25298, 0.46238).
Table 4. Final comparison of RM resources from experts’ opinions
|
|
RM3.1 |
RM3.2 |
RM3.3 |
RM3.4 |
||||||||
|
RM3.1 |
1 |
1 |
1 |
1.155 |
2.176 |
3.185 |
1 |
2 |
3 |
1 |
1.414 |
1.732 |
|
RM3.2 |
0.3139 |
0.4595 |
0.865 |
1 |
1 |
1 |
0.503 |
0.648 |
1 |
0.333 |
0.5 |
1 |
|
RM3.3 |
0.3333 |
0.5 |
1 |
1 |
1.542 |
1.987 |
1 |
1 |
1 |
1 |
1.189 |
1.316 |
|
RM3.4 |
0.5773 |
0.7071 |
1 |
1 |
2 |
3 |
0.759 |
0.841 |
1 |
1 |
1 |
1 |
$V\left(S_{R M_{3.1}} \geq S_{R M_{3.2}}\right)$ =1; $V\left(S_{R M_{3.1}} \geq S_{R M_{3.3}}\right)$ =1;
$V\left(S_{R M_{3.1}} \geq S_{R M_{3.4}}\right)$ =1; $V\left(S_{R M_{3.2}} \geq S_{R M_{3.1}}\right)$ =0.3614;
$V\left(S_{R M_{3.2}} \geq S_{R M_{3.3}}\right)$ =0.638; $V\left(S_{R M_{3.2}} \geq S_{R M_{3.4}}\right)$ =0.596;
$V\left(S_{R M_{3.3}} \geq S_{R M_{3.1}}\right)$ =0.643; $V\left(S_{R M_{3.3}} \geq S_{R M_{3.2}}\right)$ =1;
$V\left(S_{R M_{3.3}} \geq S_{R M_{3.4}}\right)$ = 0.938; $V\left(S_{R M_{3.4}} \geq S_{R M_{3.1}}\right)$ =0.7184;
$V\left(S_{R M_{3.4}} \geq S_{R M_{3.2}}\right)$ =1; $V\left(S_{R M_{3.4}} \geq S_{R M_{3.3}}\right)$ =1
$\begin{aligned} & W_{R M_{3.1}}=\left(\frac{1}{1+0.3614+0.643+0.7184}\right)=0.367 ; \\ & W_{R M_{3.2}}=\left(\frac{0.3614}{1+0.3614+0.643+0.7184}\right)=0.133 ; \\ & W_{R M_{3.3}}=\left(\frac{0.643}{1+0.3614+0.643+0.7184}\right)=0.236 ; \\ & W_{R M_{3.4}}=\left(\frac{0.7184}{1+0.3614+0.643+0.7184}\right)=0.264\end{aligned}$
The same procedure will be used to calculate weights for all attributes and capabilities of the model, as explained in Table 5.
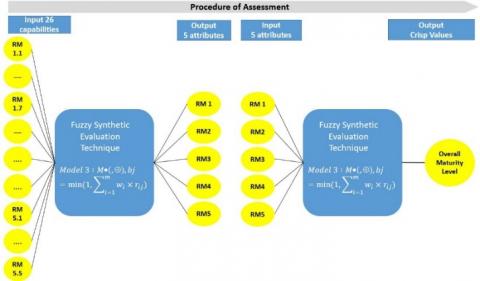
6.2 Implementing model
In this section, the model will be applied with the participation of a group of engineers working in various public and private organizations to confirm the model's validity, and to stand on the level of maturity of Iraqi construction organizations in risk management. Figure 3 in (Appendix C) demonstrates model implementation.
6.2.1 Data collection and statistical analysis
$N_S^{\prime}=\frac{p \times q}{(v)^2}$ ; (14)
where, $N_s^{\prime}$ : sample size of an unlimited population; P: estimated percentage of the target population q: 1-p; ν: acceptable standard of error for the sample population. p & q are set to 0.5 to achieve the ultimate sample size. The standard percent of the error is specified as 5 percent to get a confidence level at 95%. Considering the above conditions, the minimum sample size necessary is=100. According to the Cochran formula:
$N_s=\frac{t^2 \times s^2}{e^2}$; (15)
where, Ns: required sample size; t: the value of confidence level; s: standard deviation; e2: margin of error. For continuous data, the acceptable error is 3% [51]. In the proposed model, a five-point scale is adopted; thus, the value of (e) is calculated by multiplying the acceptable error by the points of the scale (0.03x5=0.15). The estimation of standard deviation (s) is calculated by dividing the 5-point scale by the six standard deviations (3 on each side of the mean) that capture nearly all (roughly 98%) of the scale's available values. Therefore, the (s) will be (5/6). At a confidence level of 95%, the value of (t) is 1.96. So, the sample size is ≅119. From the above two equations, the sample size’s minimum value will equal 119. Interviews are used to disseminate the questionnaire. A (169) respondents from publics and private organizations took part.
6.2.2 Generating Membership Functions (M.F) for the model
A total of 26 capabilities have been identified for evaluating the RMM level of construction organizations. By assessing organizations, the M.F. will be generated. It should be noticed that there are three levels of M.F. as follows:
$R M_{1.1}=\frac{0.39}{\text { Immature }}+\frac{0.45}{\text { Ad-hoc }}+\frac{0.16}{\text { Standard }}+\frac{0.00}{\text { Managed }}+\frac{0.00}{\text { Optimized }}$
It can be written as (0.39,0.45,0.16,0.00,0.00). Likewise, the M.F. of other capabilities can be generated in the same manner. Table 5 illustrate the MF of all capabilities.
After that, the M.F. of the five attributes will be calculated by Eq. (12). For instance, take ‘RM resources’, which has (Allocating budget for RM; Dedicated team for RM; Training; Allocating time of RM), the membership function of this attribute determined as follows:
$\begin{array}{rlll}{\left[\begin{array}{lllllll}0.367 & 0.133 & 0.236 & 0.264\end{array}\right]} & \left[\begin{array}{lllll}0.39 & 0.45 & 0.16 & 0 & 0 \\ 0.36 & 0.64 & 0 & 0 & 0 \\ 0.43 & 0.53 & 0.04 & 0 & 0 \\ 0.69 & 0.31 & 0 & 0 & 0\end{array}\right]\end{array}$ =(0.47, 0.46, 0.07, 0, 0)
Likewise, the M.F. of other attributes can be generated similarly. Table 5 illustrates the MF of all attributes.
$\left[\begin{array}{lllll}0.257 & 0.229 & 0.244 & 0.14 & 0.13\end{array}\right]\left[\begin{array}{cclll}0.515 & 0.375 & 0.111 & 0 & 0 \\ 0.671 & 0.31 & 0.019 & 0 & 0 \\ 0.475 & 0.457 & 0.068 & 0 & 0 \\ 0.541 & 0.391 & 0.053 & 0.015 & 0 \\ 0.557 & 0.371 & 0.0719 & 0 & 0\end{array}\right]$ = (0.55,0.382,0.066,0.002,0)
Table 5 illustrates the M.F. of the overall maturity level of the Iraqi construction industry:
6.2.3 De-fuzzification of the membership functions of model
The de-fuzzification procedure is necessary in order to discover crisp values (maturity levels) for components in accordance with the Eq. (13). For instance, the crisp value of ‘Attitude about RM’ (RM1.1) is:
$C=\sum_{i=1}^n\left(W_i \times R_k\right) \times L$ = (0.352*1+0.616*2+0.03*3+0*4+0*5)=1.67
Likewise, the crisp value of all capabilities, attributes and overall maturity level can be calculated similarly. Table 5 illustrates the crisp numbers of all.
The results showed that the overall RMM of the Iraqi construction sector is (1.52), falls between immature and ad-hoc levels, which explains the construction industry's risk management weakness These results fully demonstrate the model's validity since the results are consistent with previous studies [55, 56] confirming the weak application of RM in the Iraqi construction sector. Thus, strict laws from the relevant authorities are needed to compel organizations to develop integrated and proactive strategies and frameworks for implementing risk management. This model can be the first and most important step to implementing these strategies because any organization needs to identify its strengths and weaknesses and then strengthen the areas where they are weakest. In addition, this model can be used as a tool by contracting agencies in evaluating organizations before the project's assignment.
Table 5. Maturity levels of capabilities, attributes and overall maturity level
|
No. |
Attributes & capabilities (A&C) |
Wi FAHP |
M.F. of capabilities & attributes |
M.F. of OML |
Crisp values A&C |
Crisp value of OML |
|
RM1 |
RM culture & knowledge |
0.257 |
(0.515,0.375,0.1108,0,0) |
(0.55, 0.382, 0.0662, 0.002, 0) |
1.596 |
1.52 |
|
RM1.1 |
Attitude about RM |
0.177 |
(0.352, 0.616, 0.03, 0 ,0) |
1.67 |
||
|
RM1.2 |
Risk management policy |
0.178 |
(0.522, 0.34, 0.14 ,0, 0) |
1.616 |
||
|
RM1.3 |
RM communication |
0.113 |
(0.597, 0.333, 0.07, 0, 0) |
1.47 |
||
|
RM1.4 |
Commitment of senior management |
0.187 |
(0.434, 0.497, 0.07, 0, 0) |
1.635 |
||
|
RM1.5 |
Responsibility and authority |
0.104 |
(0.478, 0.314, 0.21, 0, 0) |
1.73 |
||
|
RM1.6 |
RM objectives |
0.154 |
(0.547, 0.233, 0.22, 0, 0) |
1.67 |
||
|
RM1.7 |
RM culture after crisis |
0.087 |
(0.881, 0.069, 0.05, 0, 0) |
1.17 |
||
|
RM 2 |
RM Processes |
0.229 |
(0.671, 0.31, 0.019, 0 0) |
1.348 |
||
|
RM2.1 |
Capability of plan RM |
0.258 |
(0.761, 0.189, 0.05, 0, 0) |
1.29 |
||
|
RM2.2 |
Capability of identifying risks |
0.253 |
(0.686, 0.314, 0, 0, 0) |
1.314 |
||
|
RM2.3 |
Capability of risk analysis |
0.19 |
(0.667, 0.302, 0.03, 0, 0) |
1.365 |
||
|
RM2.4 |
Capability of risk response |
0.206 |
(0.572, 0.428, 0,0,0) |
1.428 |
||
|
RM2.5 |
Monitoring and controlling risks |
0.093 |
(0.61, 0.39, 0, 0, 0) |
1.39 |
||
|
RM 3 |
RM resources |
0.244 |
(0.475, 0.457, 0.0681,0, 0) |
1.593 |
||
|
RM3.1 |
Allocating the budget for RM |
0.367 |
(0.396, 0.447, 0.16, 0, 0) |
1.76 |
||
|
RM3.2 |
Dedicated team for RM |
0.133 |
(0.358, 0.642, 0, 0, 0) |
1.64 |
||
|
RM3.3 |
Training |
0.236 |
(0.428, 0.528, 0.04, 0, 0) |
1.616 |
||
|
RM3.4 |
Allocating time of RM |
0.264 |
(0.686, 0.314, 0, 0, 0) |
1.314 |
||
|
RM 4 |
RM practices |
0.14 |
(0.541,0.391, 0.053, 0.015, 0) |
1.54 |
||
|
RM4.1 |
RM formalization |
0.155 |
(0.509, 0.491, 0, 0, 0) |
1.49 |
||
|
RM4.2 |
Key stakeholders |
0.232 |
(0.572, 0.365, 0.06, 0, 0) |
1.49 |
||
|
RM4.3 |
RM documentation |
0.24 |
(0.478, 0.447, 0.08, 0, 0) |
1.597 |
||
|
RM4.4 |
RM scope |
0.103 |
(0.597, 0.403, 0, 0, 0) |
1.403 |
||
|
RM4.5 |
Integrated RM with PM tasks |
0.27 |
(0.566, 0.302, 0.08, 0.057, 0) |
1.623 |
||
|
RM 5 |
Continuous improvement |
0.13 |
(0.557, 0.371, 0.072, 0, 0) |
1.515 |
||
|
RM5.1 |
Change management |
0.29 |
(0.358, 0.497, 0.14, 0, 0) |
1.786 |
||
|
RM5.2 |
Automation in RM |
0.258 |
(0.723, 0.277, 0, 0, 0) |
1.27 |
||
|
RM5.3 |
Research in developing RM |
0.226 |
(0.541, 0.352, 0.11, 0,0) |
1.56 |
||
|
RM5.4 |
Reviewing performance |
0.115 |
(0.472, 0.478, 0.05, 0, 0) |
1.58 |
||
|
RM5.5 |
Risk audit |
0.111 |
(0.811, 0.189, 0, 0, 0) |
1.2 |
Risk management is one area of knowledge that is poorly applied, especially in developing countries. Great efforts are required to address this weakness and design modern strategies to develop this area. Based on a thorough review and in-depth investigations of previous research and practice in risk management maturity around the world, the authors developed a Construction Organization Risk Management Maturity Model (C.ORM3) suited for construction organizations in developing countries that can help better understand the current state of their RM practice. This study has contributed to addressing most of the shortcomings of previous models. A five stages are adopted to build methodology of this study. This model contains five attributes with 26 capabilities extracted through a systematic literature reviews of 22 articles and experts’ opinions. Furthermore, four standards and guidelines are analyzed to elicit different maturity levels for the model. These criteria will be evaluated against five levels: 1-immature, 2-ad-hoc, 3- standard, 4-managed, and 5-optimized. A new strategy for model validation was implemented based on three groups of international and domestic experts and a real-world model's implementation. To reduce the ambiguity that may accompany some of the respondents' choices when judging maturity levels, the authors apply high-precision algorithms represented by FAHP and Fuzzy Synthetic Evaluation techniques. The aggregation of these techniques has not yet been used for the RMM. The practicality of the model is validated by Iraqi construction organizations. The results showed that the overall RMM level of the Iraqi construction sector is 1.52, between the immature and ad-hoc levels. A digital version of the model has been created to enable its use by construction organizations. This work adds to the body of knowledge about risk management by providing a novel fuzzy assessment model for RM maturity for construction organizations.
There were certain limitations to this study, which should be highlighted. The outcome solely pertains to the RM in the construction sector. Therefore, the authors recommend that future studies apply a similar approach to designing maturity models for other industries. In addition, the model implemented just in Iraqi construction organizations.
The electronic model (C.ORM3) are given in Supplementary Information.
|
RM |
Risk management |
|
RMMM |
Risk management maturity model |
|
FAHP |
Fuzzy analytical hierarchy process |
|
FSE |
Fuzzy synthetic evaluation |
|
C.ORM3 |
Construction organization risk management maturity model |
|
M.F. |
Membership function |
|
C.R. |
consistency ratio |
|
TFN |
triangular fuzzy number |
|
TMF |
Trapezoidal membership function |
|
Greek symbols |
|
|
ν |
acceptable standard of error for the sample population |
|
s |
standard deviation |
|
Subscripts |
|
|
aij |
Relative importance |
|
Si |
Fuzzy synthetic extent |
|
W |
Crisp magnitude of parameters |
|
$\oplus$ |
the summation of weights and MF |
|
C |
crisp number of attributes or overall maturity level |
|
Rk |
degree of TMF of capabilities or attributes |
|
$N_s^{\prime}$
|
sample size of an unlimited population |
|
P |
estimated percentage of the target population |
|
Ns |
required sample size |
|
t |
the value of confidence level |
|
e2 |
margin of error |
Appendix A
Table A1. Illustrate experts’ panels
|
Experts |
No. |
Expertise & field of activity |
Work experience (years) |
Education |
Country |
|
First panel of experts |
|||||
|
E |
1 |
Senior Manager Program Management; Specialist in OPM & maturity models |
More than 21 |
B.Sc. |
USA |
|
E |
1 |
Chief Specialist projects and program management/ EPMO; PMI-RMP |
More than 30 |
Ph.D. |
Egypt |
|
E |
1 |
Head of Department; Prof. in project management |
More than 21 |
Ph.D. |
Egypt |
|
E |
1 |
Prof. in construction management |
More than 21 |
Ph.D. |
Iraq |
|
E |
1 |
Specialist in risk and safety management |
More than 10 |
Ph.D. |
Iraq |
|
E |
1 |
Specialist. in construction management |
More than 20 |
Ph.D. |
Iraq |
|
Second panel of experts |
|||||
|
E |
2 |
Specialists in construction projects in Public & Private sector |
More than 25 |
Ph.D. |
Iraq |
|
E |
8 |
Specialists in construction projects |
More than 12 |
M.Sc. |
Iraq |
|
E |
1 |
Specialists in mechanical engineering |
26 |
M.Sc. |
Iraq |
|
E |
12 |
Specialists in construction projects |
More than 10 |
B.Sc. |
Iraq |
|
E |
1 |
Specialists in construction projects |
24 |
Higher Diploma |
Iraq |
|
Third panel of experts |
|||||
|
E |
1 |
Statistician |
More than 15 |
Ph.D. |
Iraq |
|
E |
1 |
Statistician |
More than 10 |
M.Sc. |
Iraq |
Appendix B
Table B1. The survey of construction organisation risk management maturity model
|
Details of Construction Organization Risk Management Maturity Model |
|
|
RM Culture & Knowledge |
|
|
Attitude toward RM |
What is the organization’s attitude (maturity level) about risk management (RM) in construction projects? |
|
|
|
RM Policy |
Does the organization have a risk management policy that explains how and why RM will be implemented in its projects? |
|
|
|
RM Communication |
Does the organization have an internal and external risk communication plan for its projects? |
|
1. Immature [Undefined risk communication plan] 2. Ad-hoc [Risk communication plan is limited, and focuses on websites or email only for large projects] 3. Standard [Centrally controlled and structured risk communication plan for most projects.] 4. Managed [Strong risk communication plan that integrated with the organization’s communication plan] 5. Optimized [Continuous development of the risk communication plan to be more optimal and beneficial to the organization] |
|
|
Commitment of senior management |
Does senior management support risk management practices in projects? |
|
|
|
Responsibility and authority |
Does the organization define the roles and responsibilities among individuals to manage the risks of its projects? |
|
|
|
RM Objectives |
What are the objectives that the organization is trying to obtain from risk management in its projects? |
|
|
|
RM Culture after crisis |
To what extent is the organization taking corrective actions to manage risk in its projects after crises such as the COVID-19 pandemic? |
|
|
|
RM PROCESSES |
|
|
Capability of plan RM |
What is the maturity level of the organization to prepare a risk management plan for its projects? |
|
|
|
Capability of identify risk |
Has the organization adopted tools and techniques (like a checklist, root cause analysis, brainstorming or any other tools) and applied a risk register in identifying risk? |
|
|
|
Capability of risk analysis |
Is the organization adopting guided practices (PMBOK 6th, Prince2) for qualitative and quantitative analysis for assessing the impact of project risks? |
|
|
|
Capability of risk response |
Does the organization implement mitigation strategies or adopt contingency plans to respond to risks? |
|
|
|
Monitoring and controlling risk |
Does the organization have standard methods and procedures for monitoring and controlling risks during the implementation of projects? |
|
|
|
RM RESOURCES |
|
|
Allocating budget of RM |
Does the organization allocate a contingency budget to manage project risks? |
|
|
|
Dedicated team for RM |
Does the organization prepare a dedicated risk management team for its projects? |
|
|
|
Training |
Has the organization provided risk management training for personal development? |
|
|
|
Allocating time of RM |
Does the organization allocate contingency time to manage risk while scheduling a project? |
|
|
|
RM Practice |
|
|
RM formalization |
What level of maturity do the organization’s risk management practices have? |
|
|
|
Key stakeholders |
How would you describe the involvement of key stakeholders in managing project risks? |
|
|
|
RM documentation |
Does the organization have a documentation system for the risks encountered during the implementation of the project? |
|
|
|
RM scope |
What is the scope of RM practice in the organization? |
|
|
|
Integrated RM with PM tasks |
To what extent is risk management integrated with other project management tasks? |
|
|
|
Continuous Improvement |
|
|
Change management |
What is the organization’s maturity level in adopting change management? |
|
|
|
Automation in RM |
Does the organization have risk management automation tools and technologies to manage risk programmatically? |
|
|
|
Research in developing RM |
Does the organization support scientific research in developing risk management practices in its projects? |
|
|
|
Reviewing performance |
Does the organization conduct performance reviews for its projects? |
|
|
|
Risk audit |
Does the organization audit how well RM processes, people involved and planned and carried out risk responses work? |
|
|
Appendix C
Figure 3. Process of implementing model
[1] PMI. (2013). A Guide to the Project Management Body of Knowledge (PMBOK Guide). 5th edition. Newtown Square, PA: Project Management Institute.
[2] Okudan, O., Budayan, C., Dikmen, I. (2021) A knowledge-based risk management tool for construction projects using case-based reasoning. Expert Systems with Applications, 173: 1-18. http://dx.doi.org/10.1016/j.eswa.2021.114776
[3] De Souza Scotelano, L., da Conceição, R.D.P., da Costa Leonídio, U., de Jesus, C.S. (2017). Project management maturity model: The case in an automotive industry in Brazil. Brazilian Journal of Operations & Production Management, 14(4): 500-507. http://dx.doi.org/10.14488/BJOPM.2017.v14.n4.a6
[4] Pearson, C.M., Misra, S.K., Clair, J.A., Mitroff, I.I. (1997). Managing the unthinkable. Organizational Dynamics, 26(2): 51-64 https://doi.org/10.1016/S0090-2616(97)90005-X
[5] Kerzner, H. (2019). Using the project management maturity model: Strategic planning for project management. John Wiley & Sons. New York. http://dx.doi.org/10.1002/9781119559078
[6] Yeo, K.T., Ren, Y. (2009). Risk management capability maturity model for complex product systems (CoPS) projects. Systems Engineering, 12(4): 275-294. http://dx.doi.org/10.1002/sys.20123
[7] Karunarathne, B.V.G., Kim, B.S. (2021). Risk management application-level analysis in south Korea construction companies using a generic risk maturity model. KSCE Journal of Civil Engineering, 25: 3235-3244. http://dx.doi.org/10.1007/s12205-021-2277-x
[8] Hillson, D.A. (1997). Towards a risk maturity model. The International Journal of project & Business Risk Management, 1(1): 35-45.
[9] Zou, P., Chen, Y., Chan, T.Y. (2010). Understanding and improving your risk management capability: Assessment model for construction organizations. Journal of Construction Engineering and Management, 136(8): 854-863. https://doi.org/10.1061/(ASCE)CO.1943-7862.0000175
[10] Zhao, X., Hwang, B.G., Low, S.P. (2013). Developing fuzzy enterprise risk management maturity model for construction firms. Journal of Construction Engineering and Management, 139(9): 1179-1189. http://dx.doi.org/10.1061/(ASCE)CO.1943-7862.0000712
[11] Bhosale, A.S., Ravi, K., Patil, S.B. (2017). A conceptual model of risk management maturity of road construction project. International Journal of Research and Scientific Innovation, 4: 38-43.
[12] Abdulrahman, R.S., Ibrahim, A.D., Chindo, P.G. (2019). Assessment of risk management maturity of construction organisations in joint venture projects. Journal of Engineering, Project, and Production Management, 9(1): 20-28. https://doi.org/10.2478/jeppm-2019-0004
[13] Hoseini, E., Hertogh, M., Bosch-Rekveldt, M. (2019). Developing a generic risk maturity model (GRMM) for evaluating risk management in construction projects. Journal of Risk Research, 24(7): 889-908. http://dx.doi.org/10.1080/13669877.2019.1646309
[14] Tarhan, A., Turetken, O., Reijers, H.A. (2016). Business process maturity models: A systematic literature review. Information and Software Technology, 75: 122-134. http://dx.doi.org/10.1016/j.infsof.2016.01.010
[15] Ren, Y.T., Yeo, K.T. (2004). Risk management capability maturity model for complex product systems (CoPS) projects. IEEE International Engineering Management Conference (IEEE Cat. No. 04CH37574), Singapore, pp. 807-811. http://dx.doi.org/10.1109/IEMC.2004.1407492
[16] Öngel, B. (2009). Assessing risk management maturity: A framework for the construction companies. Master's thesis, Middle East Technical University. http://etd.lib.metu.edu.tr/upload/12611457/index.pdf.
[17] Mu, S., Cheng, H., Chohr, M., Peng, W. (2013) Assessing risk management capability of contractors in subway projects in mainland China. International Journal of Project Management, 32(3): 452-460. https://doi.org/10.1016/j.ijproman.2013.08.007
[18] Salawu, R.A., Abdullah, F. (2015). Assessing risk management maturity of construction organisations on infrastructural project delivery in Nigeria. Procedia-Social and Behavioral Sciences, 172: 643-650. http://dx.doi.org/10.1016/j.sbspro.2015.01.414
[19] Jumali, S., Nasir, S.R.M., Yasin, A.M., Nawi, N.M. (2018). Assessing risk management maturity for construction projects in Jabatan Kerja Raya. In: Yacob, N., Mohd Noor, N., Mohd Yunus, N., Lob Yussof, R., Zakaria, S. (eds) Regional Conference on Science, Technology and Social Sciences (RCSTSS 2016). Springer, Singapore. https://doi.org/10.1007/978-981-13-0074-5_53
[20] Perrenoud, A., Short, E., Cowan, D. (2021). Development and validation of elements for the construction risk maturity assessment (CRMA). International Journal of Construction Education and Research, 19(1): 42-60. https://doi.org/10.1080/15578771.2021.1958959
[21] Čech, M., Januška, M. (2020). Evaluation of risk management maturity in the Czech automotive industry: Model and methodology. Amphitheater Economic, 22: 824-845. https://doi.org/10.24818/EA/2020/55/824
[22] Mehrjerdi, Y.Z. (2012) Developing fuzzy TOPSIS method based on interval valued fuzzy sets. International Journal of Computer Applications, 42: 7-18.
[23] Zadeh, L.A. (1965). Fuzzy sets. Information and Control, 8(3): 338-353. https://doi.org/10.1016/S0019-9958(65)90241-X
[24] Fayek, A.R. (2020) Fuzzy logic and fuzzy hybrid techniques for construction engineering and management. Journal of Construction Engineering and Management, 146(7): 1-12. https://doi.org/10.1061/(ASCE)CO.1943-7862.0001854
[25] Chan, A.P., Chan, D.W., Yeung, J.F. (2009) Overview of the application of “fuzzy techniques” in construction management research. Journal of Construction Engineering and Management, 135(11): 1241-1252. https://doi.org/10.1061/(ASCE)CO.1943-7862.0000099
[26] Seresht, N.G., Fayek, A.R. (2015) Application of fuzzy logic integrated with system dynamics in construction modeling. International Construction Specialty Conference of the Canadian Society for Civil Engineering (ICSC) (5th: 2015). http://dx.doi.org/10.14288/1.0076326
[27] Lee, S. (2015). Determination of priority weights under multiattribute decision-making situations: AHP versus fuzzy AHP. Journal of Construction Engineering and Management, 141(2): 05014015. https://doi.org/10.1061/(ASCE)CO.1943-7862.0000897
[28] Khademi Hamidi, J., Shahriar, K., Rezai, B., Rostami, J., Bejari, H. (2010). Risk assessment based selection of rock TBM for adverse geological conditions using Fuzzy-AHP. Bulletin of Engineering Geology and the Environment, 69: 523-532. https://doi.org/10.1007/s10064-009-0260-8
[29] Peng, G., Han, L., Liu, Z., Guo, Y., Yan, J., Jia, X. (2021). An application of fuzzy analytic hierarchy process in risk evaluation model. Frontiers in Psychology, 12: 715003. https://doi.org/10.3389/fpsyg.2021.715003
[30] Al Mhdawi, M.K. (2020) Proposed risk management decision support methodology for oil and gas construction projects. In: Panuwatwanich, K., Ko, CH. (eds) The 10th International Conference on Engineering, Project, and Production Management. Lecture Notes in Mechanical Engineering. Springer, Singapore. https://doi.org/10.1007/978-981-15-1910-9_34
[31] Serpell, A., Ferrada, X., Rubio, L., Arauzo, S. (2015) Evaluating risk management practices in construction organizations. Procedia-Social and Behavioral Sciences, 194: 201-210. https://doi.org/10.1016/j.sbspro.2015.06.135
[32] Chapman, R.J. (2019) Exploring the value of risk management for projects: Improving capability through the deployment of a maturity model. IEEE Engineering Management Review, 47(1): 126-143. https://doi.org/10.1109/EMR.2019.2891494
[33] Wibowo, A., Taufik, J. (2017) Developing a self-assessment model of risk management maturity for client organizations of public construction projects: Indonesian context. Procedia Engineering, 171: 274-281. https://doi.org/10.1016/j.proeng.2017.01.335
[34] Hartono, B., Wijaya, D.F., Arini, H.M. (2014) An empirically verified project risk maturity model: Evidence from Indonesian construction industry. International Journal of Managing Projects in Business, 7(2): 263-284 http://dx.doi.org/10.1108/IJMPB-03-2013-0015
[35] Caiado, R.G.G., Lima, G.B.A., Nascimento, D.L.D.M., Vieira Neto, J., Oliveira, R.A.M.D. (2016) Guidelines to risk management maturity in construction projects. Brazilian Journal of Operations & Production Management, 13(3): 372-385. https://doi.org/10.14488/BJOPM.2016.v13.n3.a14
[36] Jia, G., Ni, X., Chen, Z., Hong, B., Chen, Y., Yang, F., Lin, C. (2013) Measuring the maturity of risk management in large-scale construction projects. Automation in Construction, 34: 56-66. http://dx.doi.org/10.1016/j.autcon.2012.10.015
[37] Kaassis, B., Badri, A. (2018) Development of a preliminary model for evaluating occupational health and safety risk management maturity in small and medium-sized enterprises. Safety, 4(1): 5. https://doi.org/10.3390/safety4010005
[38] Wijaksono, F.A., Pratami, D., Bay, A.F. (2020) Measurement of risk project maturity using organizational project management maturity model (Opm3): Study case of construction project in Bandung. In IOP Conference Series: Materials Science and Engineering, 852: 012098. https://doi.org/10.1088/1757-899X/852/1/012098
[39] Roghabadi, M.A., Moselhi, O. (2020). A fuzzy-based decision support model for risk maturity evaluation of construction organizations. Algorithms, 13(5): 1-18. https://doi.org/10.3390/a13050115
[40] Proença, D., Borbinha, J. (2016). Maturity models for information systems-a state of the art. Procedia Computer Science, 100: 1042-1049. https://doi.org/10.1016/j.procs.2016.09.279
[41] Axelos. (2010). PRINCE 2 Management Maturity Model (P2MM). Second edition. Office of Government Commerce. Axelos. http://www.uml.org.cn/xmgl/2011331_pdf.pdf.
[42] Murray-Webster, R. (2010). Management of Risk: Guidance for Practitioners. The Stationery Office, UK.
[43] Crawford, J.K. (2021) Project Management Maturity Model. Auerbach Publications. New York https://doi.org/10.1201/9781003129523
[44] Heidari, S.S., Khanbabaei, M., Sabzehparvar, M. (2018). A model for supply chain risk management in the automotive industry using fuzzy analytic hierarchy process and fuzzy TOPSIS. Benchmarking: An International Journal, 25(9): 3831-3857. https://doi.org/10.1108/BIJ-11-2016-0167
[45] Zhu, K.J., Jing, Y., Chang, D.Y. (1999). A discussion on extent analysis method and applications of fuzzy AHP. European Journal of Operational Research, 116(2): 450-456. https://doi.org/10.1016/S0377-2217(98)00331-2
[46] Xu, Y., Yeung, J.F., Chan, A.P., Chan, D.W., Wang, S.Q., Ke, Y. (2010). Developing a risk assessment model for PPP projects in China—A fuzzy synthetic evaluation approach. Automation in Construction, 19(7): 929-943. https://doi.org/10.1016/j.autcon.2010.06.006
[47] Nguyen, H.D., Macchion, L. (2022). A comprehensive risk assessment model based on a fuzzy synthetic evaluation approach for green building projects: The case of Vietnam. Engineering, Construction and Architectural Management. https://doi.org/10.1108/ECAM-09-2021-0824
[48] Hany Abd Elshakour, M.A., Al-Sulaihi, I.A., Al-Gahtani, K.S. (2013). Indicators for measuring performance of building construction companies in Kingdom of Saudi Arabia. Journal of King Saud University-Engineering Sciences, 25(2): 125-134. https://doi.org/10.1016/j.jksues.2012.03.002
[49] Kotrlik, J.W.K.J.W., Higgins, C.C.H.C.C. (2001). Organizational research: Determining appropriate sample size in survey research. Information technology, learning, and performance journal, 19(1): 43-50.
[50] Gunduz, M., Elsherbeny, H.A. (2021). Critical assessment of contract administration using multidimensional fuzzy logic approach. Journal of Construction Engineering and Management, 147(2): 04020162. https://doi.org/10.1061/(ASCE)CO.1943-7862.0001975
[51] Krejcie, R.V., Morgan, D.W. (1970). Determining sample size for research activities. Educational and Psychological Measurement, 30(3): 607-610. http://dx.doi.org/10.1177/001316447003000308
[52] Majewska, J. (2015). Identification of multivariate outliers–problems and challenges of visualization methods. Studia Ekonomiczne, (247): 69-83.
[53] Hair Jr, J.F., Black, W.C., Babin, B.J., Anderson, R.E. (2014). Multivariate Data Analysis (Seventh). Kirby Street.
[54] Pamulu, M.S. (2010). Strategic management practices in the construction industry: A study of Indonesian enterprises. Doctoral dissertation, Queensland University of Technology. https://eprints.qut.edu.au/41570/.
[55] Abdulrahman, M. (2019). Risk analysis and control in construction industry (residential complexes in Iraq). International Journal of Civil Engineering and Technology, 10: 153-161.
[56] Al Mhdawi, M.K., Motawa, I., Rasheed, H.A. (2020) Assessment of risk management practices in construction industry. In: Panuwatwanich, K., Ko, CH. (eds) The 10th International Conference on Engineering, Project, and Production Management. Lecture Notes in Mechanical Engineering. Springer, Singapore. https://doi.org/10.1007/978-981-15-1910-9_35