Hayder Jawad Kadhim![]() | Abdalrazzaq K. Abbas
| Abdalrazzaq K. Abbas![]() | Thualfaqir J. Kadhim
| Thualfaqir J. Kadhim![]() | Farhan Lafta Rashid*
| Farhan Lafta Rashid*![]()
© 2023 IIETA. This article is published by IIETA and is licensed under the CC BY 4.0 license (http://creativecommons.org/licenses/by/4.0/).
OPEN ACCESS
Gas turbine power output is hypersensitive by environmental conditions, mainly in arid and hot climates. This research focuses on using a fogging air intake cooling system to improve the performance of the gas turbine in the weather conditions of Karbala city. The Aspen HYSYS software was used to simulate real data collected from the Karbala power plant (gas turbine). The simulation results were found for a gas turbine power plant with and without using the unit of air cooling. The results show there was a drop in inlet air temperature in the case of existence the cooling system when the ambient temperature in the range of (25 to 60)℃. The utilizing of air cooling technique with the gas turbine causes a gain in net power and thermal efficiency and reduction in the consumption of fuel. In addition, the heat rate reduces by 7% compared to not adding the system. However, the gas turbine plant shows better performance by employing the fogging system in the selected power plant when relative humidity below 40% and temperature exceed 30℃ during the summer months.
gas turbine, efficiency, fogging system, ambient temperature, simulation
Gas turbines are one of the essential solutions used in electric power generation, especially during peak hours, this is because of its advantages include the quick startup, unlike the steam turbine, which requires initial arrangements and preparation before operation [1, 2]. The affecting weaknesses of gas turbine works in hot regions are that performance drops quickly when the ambient air temperature increases. This occurs as a result of an increase in the specific volume of drawn air which leads to an increase in the power required to the compressor. On several large-scale gas turbines, power output decreasing of nearly 20% can be noticed when ambient condition reach (35℃), synchronized with an increase in heat rate around 5% [3].
One of the best techniques to enhance the gas turbine performance is to cool the air entering the compressor, especially in hot areas [4, 5]. Therefore, many researchers have dealt with this topic. Researchers [6, 7] have compared different ways to raise the efficiency of the gas turbine and they concluded that the best method is to cool the inlet air at the entrance of the compressor. The researchers [8] indicated that included a wetted substance evaporative cooler to the plant can enhance its performance. If the ambient temperature rises to 50°C, this causes a drop in thermal efficiency and net power output by approximately 3% and 10%, respectively [9, 10]. Alhazmy et al. [11] examined the effect of temperature and the amount of moisture in the region of study on the performance of the gas turbine and showed that direct mechanical cooling increased the daily capacity of the gas turbine by 6.77%. Sanjay and Mohapatra [12] noticed that the efficiency and power of gas turbine increase by 4.88% and 14.77%, respectively when the vapor-compression chiller is inserted into a combined cycle. Orhorhoro et al. [13] summed up the average increase in station capacity is 3.631 MW with a noticeable increase in efficiency from 33.279% to 36.855% when the cold air is drawn into the compressor entrance. The researchers also indicated that the method of cooling the incoming air into the gas turbine is the cheapest way to improve its performance [14]. The possibility of erosion and corrosion when water is sprayed with air in the inlet of the gas turbine is a limiting factor, even if it is very small [15]. Since the compressor is an essential component of the gas turbine, it directly affects the production of the plant, therefore the technology of cooling air entering the compressor can be used [16-23]. Barakat et al. [24] they tested a hybrid cooling system that included an underground heat exchanger. Their results indicated that this system reduces the water consumed for gas turbine cooling. Barakat et al. [25] studied the effect of overspray to cool the air entering the micro gas turbine. The results showed that NO concentration fell while CO concentration increased due to input fogging and overspray.
In this work, the gas turbine performance coupled with the fogging cooling was evaluated from June to December period to reach operation conditions of the International Standardization Organization or (ISO). The study is performed using Aspen- Hysys software, collected data for Karbala power plant, and the monthly weather data for Local weather conditions. This study offers some important insights which can help to provide an accurate simulation of the gas turbine and its equipment so that a comparison between "with" and "without" a cooling unit is presented to evaluate the effect of changing the variables at the compressor entrance such as inlet air temperature on the thermal efficiency, output power, heat rate, and consumption of fuel. Schematic diagrams, figures, and tables show the effect of the cooling unit on the power are used in the article with their descriptions and symbols. Relative humidity values from the reality of working conditions have been adopted to consider practical design conditions. Another benefit of this study is to conduct an analysis that is considered economical to evaluate the adoption of the proposed system and its application in a combined cycle power plant. Such a system is able to achieve an acceptable decrease in the temperature of the incoming air and as a result, the study proved the need of the power plant for such a system to increase energy production of such operational conditions.
2.1 Description of the power plant
Karbala power plant was used in this research work. The power plant is a 2× (125MW) frame 9001EA gas turbine with 250MW capacity, connected to the Iraqi National Grid. It is owned by the Iraqi Ministry of Electricity and supplied by the General Electric Company. The station started commercial operation in October 2012. Karbala power Station is location by coordinates of lat.32.435899˚N and long.44.126398˚E.
2.2 Data collections
The working data of Karbala Power Plant were collected from the daily operation reports. These collected data for the cold months and hot months were studied. Summary of an operating parameter of a unit 1GT (Frame 9001EA) gas turbine used for this study at an ambient temperature of 25℃ shows in Table 1. The thermodynamic analysis was done for all gas turbine components. Where the energy conservation and mass conservation laws were applied as governing equations of each component and the performance of the plant was evaluated having a fogging cooling system.
2.3 Thermodynamic analysis and simulation of the gas turbine
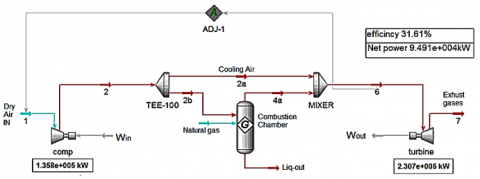
The Model (Frame 9001EA) gas turbine is a simple–cycle power package. In this model, the expansion and compression occur continuously while combustion and exhaust occur with constant pressure to make the power of the gas turbine always available. This is unlike the reciprocating engines that give power during the expansion stroke only. The flow chart diagram of the main parts of the simple gas turbine unit is shown in Figure 1. The air enters the compressor at point 1. While point 2 represents the compressed air supplied to the burner where the fuel is injected, then the products of this combustion enter the turbine at point 6, where it is expanded to atmospheric pressure again at point 7. The turbine provides the necessary force to rotate the compressor and some other components.
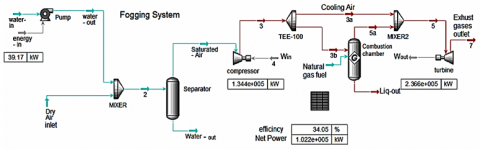
Fogging system technology basis on creates very fine droplets of water through the inlet of the compressor as shown in Figure 2. The gas turbine performance is evaluated using the Aspen HYSY V10. The cooling process takes place when demineralized water is converted to fog using special nozzles operating at (100–200) bar. Temperatures reduction at the entrance of the gas turbine takes place when the fog turns into vapor due to absorbing heat from drawn air. At the compressor inlet, the dry air becomes saturated such that the temperature of the dry bulb of inlet air reaches the initial wet-bulb temperature. It is supposed that the relative humidity of outlet air from the cooler will not go above 60% despite the inlet air condition.
Figure 1. Flow chart of simulated simple cycle gas turbine
Figure 2. Flow chart for a gas turbine with a fogging unit
2.4 The procedure of simulation
The gas turbine with the fogging system is modeled using the following assumptions:
Table 1. Operating data of Karbala gas turbine power plant
|
Operating parameters |
Value |
Unit |
Operating parameters |
Value |
Unit |
|
Net power output |
95 |
MW |
Pressure of inlet fuel |
30 |
bar |
|
Inlet air relative humidity |
20 |
% |
Lower heating value |
48439 |
kJ/kg |
|
Ambient temperature |
25 |
℃ |
Compressor isentropic efficiency |
87 |
% |
|
Ambient pressure |
1.013 |
bar |
Turbine isentropic efficiency |
88 |
% |
|
Compressor outlet temperature |
365 |
℃ |
Combustion efficiency |
99 |
% |
|
Air flow rate |
395 |
kg/s |
Air specific heat capacity |
1.005 |
kJ/kg.K |
|
Compressor outlet pressure |
10 |
bar |
Gas specific heat capacity |
1.15 |
kJ/kg.K |
|
Turbine inlet temperature |
970 |
℃ |
Pressure ratio |
10 |
|
|
Natural gas flow rate |
6 |
Kg/s |
|
|
|
|
Temperature of inlet fuel |
25 |
℃ |
|
|
|
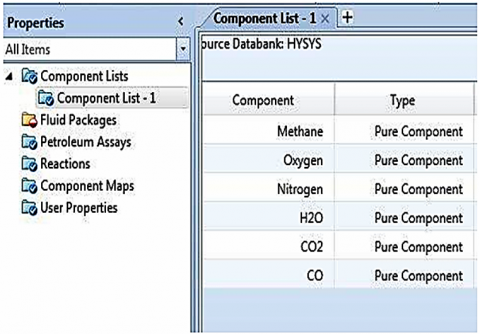
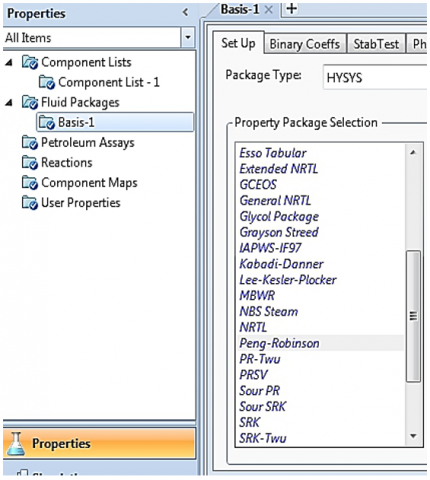
The selection of the main components was the first step in creating the model, and choice of the thermodynamic basis appropriate for these components where the program will create a list named (Component List-1). The second step was choosing the thermodynamic system linked with a list of components called a (Fluid Package). After that, the simulation environment was entered and this was the third step to build the model. Fourthly, all the necessary parts to build the model have been clicked from the model list to appear in the flow sheet as in Figure 3.
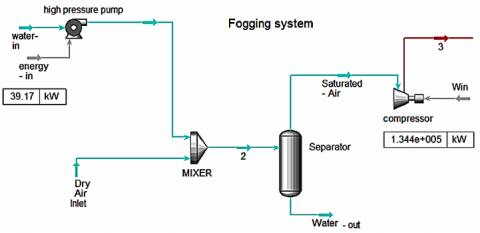
The fogging unit was simulated using combined units of separator and mixer as in Figure 4. The work of the fogging unit is summarized as converting demineralized water into the fog by compressing it using a high-pressure pump to special nozzles where it is sprayed to be mixed with hot air. However, the fog mixes with hot air to achieve the best possible saturation which obtained before leaving the mixer, while if there is some non-evaporated water it leaves from the bottom of the fogging unit separator.
Figure 3. Selection of components list and fluid package
Figure 4. Fogging system
2.5 Mass and energy models
In this part, all of the system components are theoretically investigated by solving equations balances for a single shaft gas turbine that is simulated with and without a fogging system using ASPEN HYSYS software. By adopting the previous assumptions; the main energy equations which were used to obtain the results data are presented in Table 2.
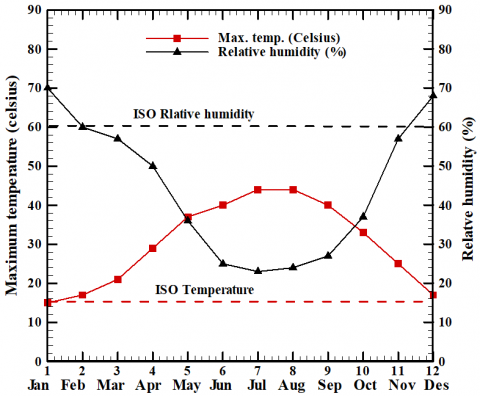
The weather online website [26] provides the weather data including the maximum temperature, relative humidity. In this study, the weather daily data of Karbala for the year (from 1/1/2019 to 31/12/2019) are employed and changed to average monthly data by taking the average of each week is represented by one year (12 months) as shown in Figure 5. The max. temperature is greater than the design temperature of the gas turbine during all months of the summer season (season of peak load) according to the International Standards Organization (ISO) [27], which has set special conditions for the gas turbine inputs as flowing: Air 15℃, absolute pressure 101.325 kPa and relative humidity 60%. The average maximum temperatures are between 30 and 50℃ in June, July, August, and September which is higher than 15℃. The relative humidity is below the record levels throughout the year except in December, January, and February.
Figure 5. Average monthly ambient conditions in Karbala [26]
Table 2. Summary of the energy balance equations
|
Components |
Equations |
|
|
Gas Turbine |
|
|
|
Isentropic compressor power (kW) |
$P_{\mathrm{ic}}=\dot{m}_{\mathrm{air}} C p_{\mathrm{air}}\left(T_2-T_1\right)$ |
(1) |
|
Mechanical compressor power (kW) |
$P_{\mathrm{mc}}=P_{\mathrm{ice}} / \eta_{\mathrm{mc}}$ |
(2) |
|
Isentropic turbine power (kW) |
$P_{\mathrm{iT}}=\dot{m}_{\text {gas }} C p_{\text {gas }}\left(T_3-T_4\right)$ |
(3) |
|
Mechanical turbine power (kW) |
$P_{\mathrm{mT}}=P_{\mathrm{iT}} \eta_{\mathrm{mT}}$ |
(4) |
|
Mechanical net power (KW) |
$P_{\mathrm{m}}=P_{\mathrm{mT}}-P_{\mathrm{mc}}$ |
(5) |
|
Mechanical net power (Maximum) (KW) |
$P_{\mathrm{m}}=\dot{m} C p\left[\left(T_{\max } \eta_{\mathrm{iT}} \eta_{\mathrm{mT}}\right)\left(1-\frac{1}{\tau}\right)-\left(\frac{T_{\min }}{\eta_{\mathrm{ic}} \eta_{\mathrm{mc}}}\right)(\tau-1)\right]$ |
(6) |
|
By simplifying |
$\dot{m}_{\text {air }} \approx \dot{m}_{\text {exh.gases }} ; C p_{\text {air }} \approx C p_{\text {exh.gases }} ; K_{\text {air }} \approx K_{\text {exh.gases }}$ |
|
|
And: $\frac{p_2}{p_1}=\frac{p_3}{p_4}=\pi ;$ Noting: $\left(\frac{p_2}{p_1}\right)^{\frac{k-1}{k}}=\frac{T_2}{T_1}=\tau$ |
|
|
|
Combustion chamber |
|
|
|
Mass balance (Kg/s) |
$\dot{m}_{\mathrm{air}}+\dot{m}_{\mathrm{fuel}}=\dot{m}_{\text {exh.gases }}$ |
(7) |
|
Energy balance (kW) |
$\dot{m}_{\text {air }} C p_{\text {air }} T_2+\mathrm{HCV} \dot{m}_{\text {fuel }} \eta_{\text {cc }}=\dot{m}_{\text {exh.gases }} C p_{\text {exh.gases }} T_3$ |
(8) |
|
Overall efficiency (%) |
$\eta_o=\frac{P_{\mathrm{m}}}{\dot{m}_{\text {fuel }} L H V}$ |
(9) |
|
Specific fuel consumption (Kg/KWh) |
$S F C=\frac{\dot{m}_{\text {fuel }}}{P_{\mathrm{m}}} 3600$ |
(10) |
|
Heat rate (kJ/kWh) |
$H R=\frac{\dot{m}_{\text {fuel }} \mathrm{LHV}}{P_{\mathrm{m}}}$ |
(11) |
|
Cooling system |
|
|
|
Effectiveness of evaporative cooler |
$\epsilon=\frac{T_{\mathrm{DB} 1}-T_{\mathrm{DB} 2}}{T_{\mathrm{DB} 1}-T_{\mathrm{WB} 1}}$ |
(12) |
|
Fogging cooling load (KW) |
$Q_{\mathrm{CL}}=\dot{m}_{\mathrm{air}} C p_{\mathrm{air}}\left(T_{\mathrm{DB} 1}-T_{\mathrm{DB} 2}\right)$ |
(13) |
The simulation was employed to study the impact of a change in the temperature of inlet air, cooling water pressure, and water flow rate on the power output, thermal efficiency, heat rate, cooling load and consumption of fuel. The results were adopted to evaluate the enhancement in the plant performance when it is coupled with high pressure fogging unit. Table 3 displays the results achieved by simulating power plants without and with a fogging system with relative humidity 20%, temperature of 30℃, and atmospheric pressure 101.3 KPa in the region for the study that has weather conditions of high temperature during summer days that causes a reduction in the capacity of the unit of a simple cycle. The performance evaluation in case of adding a fogging unit and compared with that of a simple power plant.
Summary of the working parameters of the fogging unit used is presented in Table 4. The basic elements used to drive the cooling unit are the water treatment, water tank, high-pressure pump, and series of fogging nozzles to cool air before the compressor entrance. The table results show a significant improvement in net-power, heat rate, consumption of fuel, and thermal efficiency.
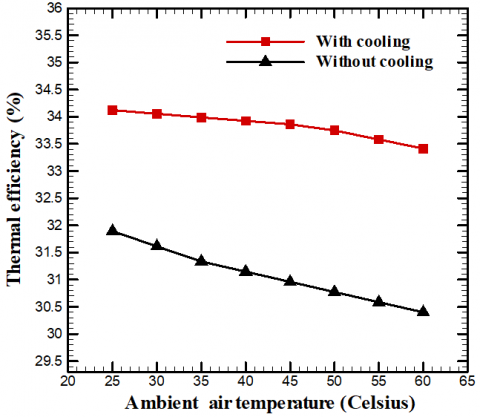
Figure 6 shows the effect of the ambient temperature of air without and with the cooling system on the gas turbine efficiency. According to the figure, there is a decrease in efficiency as the compressor inlet temperature increases in both cases. For instance, the efficiency at a temperature of 30℃ in cases of without and with the cooling unit is 31.6% and 34%, respectively. The employing of cooling equipment (fogging system) leads in overall to lower the inlet air temperature and enhance efficiency. Thus, the output power will increase because of the decrease in compressor power.
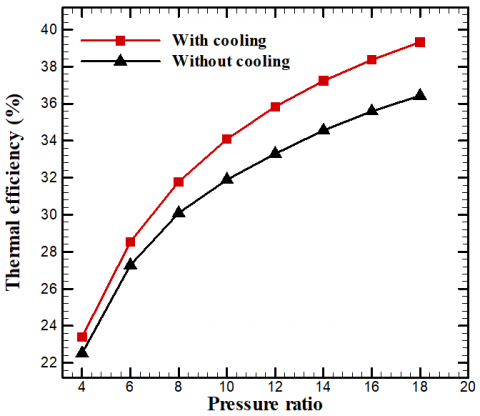
Another merit comparative factor is the air pressure ratio which departure the compressor toward the inside of the combustion chamber has a noticed influence on the gas turbine efficiency. The thermal efficiency function to pressure ratio is depicted in Figure 7.
Table 3. Simulated results obtained with &without a high-pressure fogging system at 30℃ air intake temperature
|
Items |
Without fogging |
With fogging |
Unit |
|
Compressor exit temperature |
348 |
341 |
℃ |
|
Turbine temperature |
970 |
944.7 |
℃ |
|
Exhaust temperature |
481.9 |
463.6 |
℃ |
|
Compressor power |
136.1 |
134.4 |
MW |
|
Turbine power |
231.01 |
236.6 |
MW |
|
Net power |
94.91 |
102.2 |
MW |
|
Thermal efficiency |
31.61 |
34.05 |
% |
|
Specific fuel consumption |
0.2275 |
0.2111 |
kg/Kwh |
|
Heat rate |
11024.4 |
10230.15 |
KJ/Kwh |
|
Total mass flow rate |
400.9 |
400 |
Kg/s |
Table 4. Operating parameters of the fogging system
|
Operating parameters |
Value |
Unit |
|
Pump energy |
39.17 |
Kw |
|
Water in temperature |
20 |
℃ |
|
Fogging pressure |
100 |
bar |
|
Water mass flow rate |
5 |
Kg/s |
The air temperature leaving the compressor toward the combustion chamber depends on the compressor pressure ratio. With increasing compression, the outlet air from the compressor becomes hotter, therefore the ratio of fuel-air needed is lower. The power output and thermal efficiency are growth with increasing the pressure ratio with limits. Because high pressure ratios lead to a higher temperature and should not exceed the temperature that turbine blades can withstand (about 1500 K in practice).
Figure 6. Thermal efficiency function of ambient air temperatures
Figure 7. Effect of pressure ratio on thermal efficiency
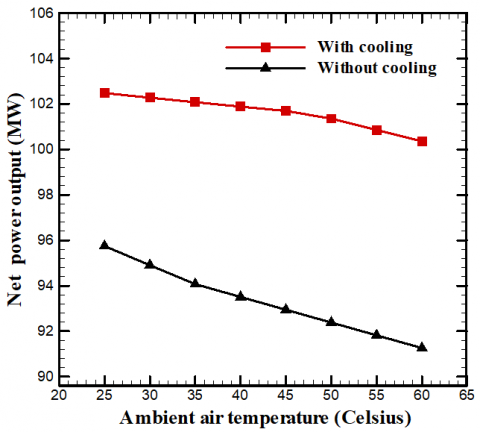
The varying ambient temperature causes a change in the net power output of the gas turbine as in Figure 8. This figure shows the variance of the output power with the incoming air temperature for with and without the cooling unit. In case of without cooling A 5℃ (25 to 30℃) increasing in the ambient temperature results in a decrease of about 842 KW power output. These losses can be reduced by employing the air intake cooling system to enhance the net power output. As observed by comparing the results in this figure, at the same inlet temperature of 40℃ the net output increases from 93.5 (without cooling) to 101.8 MW via utilizing the cooling system. This is because the turbine output power depends mainly on the inlet air temperature. As the temperature of ambient air becomes lower, the air mass flow rate increases which lower the compressor power consumption since a lower ambient temperature increasing air density, and reduces compressor power that led to higher net output power.
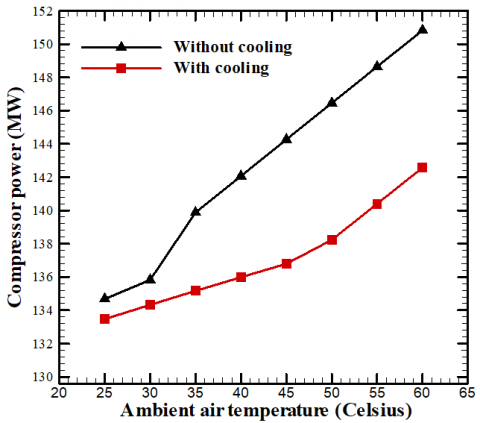
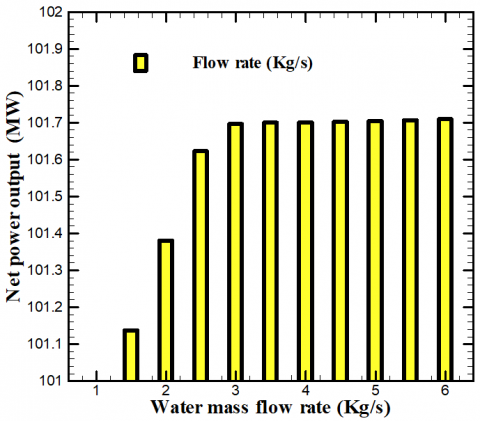
From Figure 9, it is clear that the temperature of ambient air dominated the compressor power due to the change in air density. This figure illustrates that lower temperature results in a higher density of air and less power of the compressor which in turn provides a greater output power of the gas turbine. The decrease in temperature leads to an increase in air density and thus reduces the power utilized by the compressor, which increases the net power produced. However, the benefit of the cooling system is reflected in the value of the net power produced during hot weather. Figure 10 provides an idea about the effect of the water flow rate through the cooling unit on the net output power. According to the figure, the net output power rises sharply with increasing the water flow rate then remains sensible steady after 3 Kg/s.
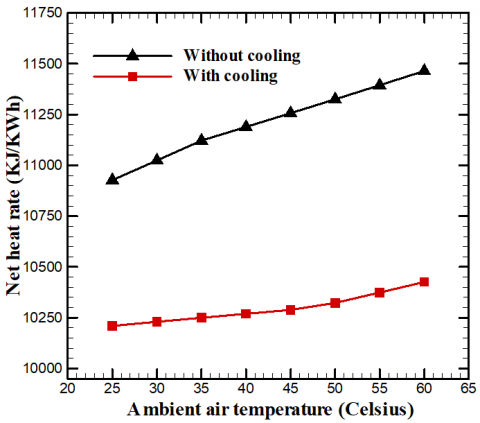
Also, the with and without cooling net heat rate per kilowatt-hour against air temperature of the cooling system is in agreement with the previous results as displayed in Figure 11. The results data obtained display that the increment between the without and with cooling approximately 0.79 KJ/KWh when the temperature of ambient air is 30℃ resulting in a decline in fuel efficiency, this is due to the low temperature of the incoming air, compressor power decreases with a decrease in specific fuel consumption. In the same way, there is an increase in heat rate when the open cycle plant without a cooling unit, due to the increased intake air in the compressor as the energy required for the compressor is raised.
Figure 8. Effect of ambient temperature on overall power output
Figure 9. Compressor work function to ambient temperature
Figure 10. Net total power function to water mass flow rate
Figure 11. Heat rate against the ambient temperature of the intake air
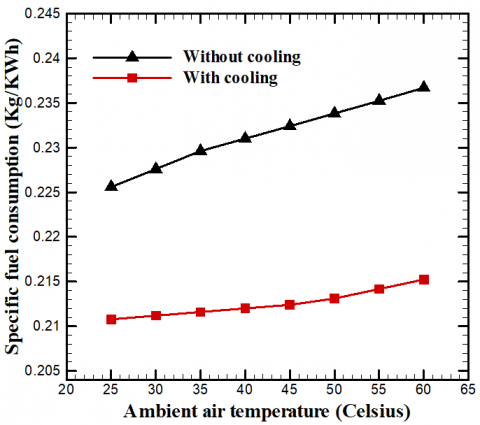
Figure 12. Fuel consumption rate against the ambient temperature of the air
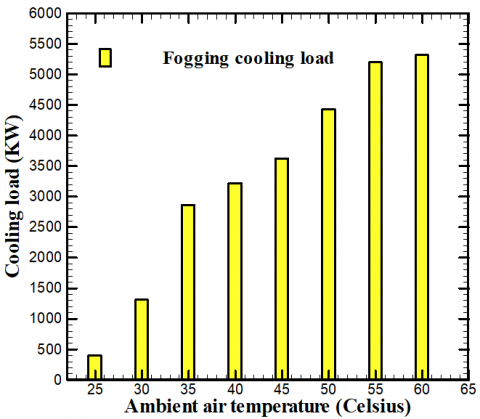
To verify the results in Figure 6, specific fuel consumption versus ambient temperature of the simple power plant and coupled plant with a fogging system is plotted in Figure 12. The results attained show that temperatures of ambient air have an important effect on the consumption of specific fuel and gas turbine operation. The rate of fuel consumption is increasing with the rise in temperature resulting in an increase in compressor power due to increase air temperature drawn into the entrance of the compressor. The rise in air temperature causes an increase in the power required to rotate the compressor, which leads to an increase in the rate of fuel consumption. Likewise, the consumption of fuel becomes lower when the cooling unit of intake air is using due to decrease temperature of the intake air. Figure 13 shows the relation between cooling load and dry ambient temperatures.
As the inlet air temperature drops the cooling load decreases and the maximum cooling load happens during the hot days (hot months) which have practically more than the upper cooling load during the cold days (cold months). These results give an idea about the trend of the cooling load behavior as it is a function of the weather data especially inlet air temperature.
Figure 13. Cooling load function of ambient air temperature
A simulation study using Aspen HYSYS software that involves thermal results with collected data for Karbala Power Plant of gas turbine combined to the fogging cooling unit was developing. The variation of dry ambient temperature is considered as the main factor affecting the output performance of such a power plant. The drop in the dry air temperature increases the mass flow and density of the air, which makes the compressor consume less work, therefore the net power and efficiency are enhanced while the specific fuel consumption and heat rate are reduced. Results achieved when employing gas turbine integrated with cooling unit displayed an increase in net power from 94.9 to 102.2 MW, thermal efficiency 31.6% to 34% while the reduction in consumption of fuel from 0.227kg/KWh to 0.211 kg/KWh and heat rate from 11024.4 kg/KWh to 10230.15 kg/KWh at a dry ambient air temperature of 30℃. The attained results indicate that the intake air cooling technology system is a suitable tool for improving the net power of gas turbine plants, in particular for weather such as in Karbala, Iraq.
|
ƞmc |
Mechanical efficiency of compressor, % |
|
ƞic |
Isentropic efficiency of compressor, % |
|
ƞmT |
Mechanical efficiency of turbine, % |
|
ƞiT |
Turbine isentropic efficiency, % |
|
ƞcc |
Combustion chamber efficiency, % |
|
p1 |
Ambient pressure, bar |
|
p2 |
Compressor outlet pressure, bar |
|
π |
Pressure ratio |
|
TDB1 |
Dry bulb temperature at entrance of cooling system, ℃ |
|
TDB2 |
Dry bulb outlet cooling system temperature, ℃ |
|
T1 |
Ambient temperature, ℃ |
|
T2 |
Compressor outlet temperature, ℃ |
|
T3 |
Turbine inlet temperature, ℃ |
|
T4 |
Exhaust gas temperature, ℃ |
|
HCV |
Higher heating value, kJ.kg-1 |
|
LHV |
Lower heating value, kJ.kg-1 |
|
$\dot{m}$ |
Flow rate, Kg.s-1 |
|
k |
Specific heat ratio |
|
Tmax |
Maximum firing temperature, ℃ |
|
TWB1 |
Wet-bulb temperature at inlet of cooling system, ℃ |
[1] Hada, S., Tsukagoshi, K., Masada, J., Ito, E. (2012). Test results of the world’s first 1,600 C J-series gas turbine. Mitsubishi Heavy Industries Technical Review, 49(1): 18-23.
[2] Dick, E. (2015). Thrust Gas Turbines. InFundamentals of Turbomachines, 109: 419-457.
[3] Chaker, M., Meher-Homji, C.B. (2002). Inlet fogging of gas turbine engines: Climatic analysis of gas turbine evaporative cooling potential of international locations. Turbo Expo: Power for Land, Sea, and Air, 36096: 371-386. https://doi.org/10.1115/GT2002-30559
[4] Al-Ibrahim, A.M., Varnham, A. (2010). A review of inlet air-cooling technologies for enhancing the performance of combustion turbines in Saudi Arabia. Applied Thermal Engineering, 30(14-15): 1879-1888. https://doi.org/10.1016/j.applthermaleng.2010.04.025
[5] Baakeem, S.S., Orfi, J., Al-Ansary, H. (2018). Performance improvement of gas turbine power plants by utilizing turbine inlet air-cooling (TIAC) technologies in Riyadh, Saudi Arabia. Applied Thermal Engineering, 138: 417-432. https://doi.org/10.1016/j.applthermaleng.2018.04.018
[6] Omidvar, B. (2001). Gas turbine inlet air cooling system. The 3rd Annual Australian Gas Turbine Conference, Melbourne, Australia 2001 Dec.
[7] Espanani, R., Ebrahimi, S.H., Ziaeimoghadam, H.R. (2013). Efficiency improvement methods of gas turbine. Energy and environmental Engineering, 1(2): 36-54.
[8] Ukwuaba, S.I., Agberegha, O.L., Mohammed, B.A. (2020). Analysis and performance evaluation of gas turbine by incorporating a wetted evaporative media cooler. International Journal of Engineering and Advanced Technology (IJEAT), 8(2): 226-232.
[9] Kadhim, H.J., Kadhim, T.J., Alhwayzee, M.H. (2020). A comparative study of performance of Al-Khairat gas turbine power plant for different types of fuel. In IOP Conference Series: Materials Science and Engineering, 671(1): 012015. https://doi.org/10.1088/1757-899X/671/1/012015
[10] Alhwayzee, M., Kadhim, H.J., Rashid, F.L. (2021). Aspen plus simulation for performance improving of Al-Khayrat power plant using heat recovery steam generation (HRSG) system. Journal of Mechanical Engineering Research and Developments, 44(4): 400-411.
[11] Alhazmy, M.M., Jassim, R.K., Zaki, G.M. (2006). Performance enhancement of gas turbines by inlet air-cooling in hot and humid climates. International Journal of Energy Research, 30(10): 777-797. https://doi.org/10.1002/er.1184
[12] Sanjay, Mohapatra, A.K. (2014). Thermodynamic assessment of impact of inlet air cooling techniques on gas turbine and combined cycle performance. Energy, 68: 191-203. https://doi.org/10.1016/j.energy.2014.02.066
[13] Orhorhoro, E.K., Orhorhoro, O.W. (2016). Simulation of air inlet cooling system of a gas turbine power plant. ELK Asia Pacific Journal of Applied Thermal Engineering, 1(2).
[14] Kim, K.H., Ko, H.J., Kim, K., Perez-Blanco, H. (2012). Analysis of water droplet evaporation in a gas turbine inlet fogging process. Applied Thermal Engineering, 33-34: 62-69. https://doi.org/10.1016/j.applthermaleng.2011.09.012
[15] Sanaye, S., Tahani, M. (2010). Analysis of gas turbine operating parameters with inlet fogging and wet compression processes. Applied Thermal Engineering, 30(2-3): 234-244. https://doi.org/10.1016/j.applthermaleng.2009.08.011
[16] Shukla, A.K., Sharma, A., Sharma, M., Mishra, S. (2018). Performance improvement of simple gas turbine cycle with vapor compression inlet air cooling. Materials Today: Proceedings, 5(9): 19172-19180. https://doi.org/10.1016/j.matpr.2018.06.272
[17] Ibrahim, T.K., Basrawi, F., Awad, O.I., Abdullah, A.N., Najafi, G., Mamat, R., Hagos, F.Y. (2017). Thermal performance of gas turbine power plant based on exergy analysis. Applied Thermal Engineering, 115: 977-985. https://doi.org/10.1016/j.applthermaleng.2017.01.032
[18] Rashid, F.L., Al-Jibory, M.W., Hussein, H.Q. (2017). Cooling enhancement in gas turbine blade using coated circular ribs with a new nanocomposite material. Patent (5092).
[19] Al-Jibory, M.W., Rashid, F.L., Hussein, H.Q. (2018). Heat transfer augmentation in gas turbine blade rectangular passages using circular ribs with fins. Journal of University of Babylon for Engineering Sciences, 26(1): 247-258.
[20] Rashid, F.L., Azziz, H.N., Hussein, E.Q. (2018). Heat transfer enhancement in air cooled gas turbine blade using. Journal of Petroleum Research and Studies, 8(3): 52-69.
[21] Al-Jibory, M.W., Rashid, F.L., Talib, S.M. (2020). Review on cooling enhancement of different shape gas turbine ribbed blade with thermal barrier coating. International Journal of Scientific Research and Engineering Development, 3(1): 313-329.
[22] Al-Jibory, M.W., Rashid, F.L., Hussein, H.Q. (2020). Review of heat transfer enhancement in air-cooled turbine blades. International Journal of Scientific & Technology Research, 9(4): 3123-3130.
[23] Hussein, H.Q., Al-Jibory, M.W., Rashid, F.L. (2020). Heat transfer enhancement of gas turbine blades using coated ribs with nanocomposite materials. Journal of Mechanical Engineering Research and Developments, 43(6): 9-22.
[24] Barakat, S., Ramzy, A., Hamed, A.M., El-Emam, S.H. (2019). Augmentation of gas turbine performance using integrated EAHE and Fogging Inlet Air Cooling System. Energy, 189: 116133. https://doi.org/10.1016/j.energy.2019.116133
[25] Barakat, E., Jin, T., Tong, X., Ma, C., Wang, G. (2023). Experimental investigation of saturated fogging and overspray influence on part-load micro gas turbine performance. Applied Thermal Engineering, 219: 119505. https://doi.org/10.1016/j.applthermaleng.2022.119505
[26] Weather Data. https://weather-and-climate.com/average-monthly-Rainfall-Temperature-Sunshine, karbala, Iraq.
[27] Brooks, F.J. (2000). GE Gas Turbine Performance Characteristics. GE Power Systems, Schenectady, NY.