Savitha M. M.* | Prabhugoud I. Basarkod
© 2022 IIETA. This article is published by IIETA and is licensed under the CC BY 4.0 license (http://creativecommons.org/licenses/by/4.0/).
OPEN ACCESS
Advanced Metering Infrastructure (AMI) is the prime smart grid application that connects smart meters and electric power stations. Routing Protocol for Low-Power and Lossy Networks (RPL) is the most familiar lightweight routing protocol for AMI networks. The reliability of RPL routing is a potential problem for the efficient deployment of AMI networks. This paper ensures attack and network reliability for AMI-RPL and proposes Hybrid Deep Learning based Intrusion Detection System (HDL-IDS) for attack reliability and a Multi-Objective Function-based Reliable RPL (MOR-RPL) for network reliability. The HDL-IDS assures AMI-RPL reliability against attacks by analyzing and eliminating the attack traffic successfully. The MOR-RPL method improves the RPL construction reliability by procuring the multi-objective function-based reliability metrics in the DODAG building. The simulation results show that the attack and network reliability are significantly enhanced with balanced energy consumption.
AMI, ARR, HDL-IDS, MOR-RPL, multi-objective function, multi of based reliable rank estimation, machine learning and Cooja based traffic analysis, reliability
The AMI is the splendiferous smart grid application that ameliorates the electrical system by enabling bi-directional communication among smart meters and power stations [1]. Thus, the AMI-IoT necessitates a reliable bi-directional routing protocol. The RPL is the simplest and lightweight IoT routing protocol widely employed in smart IoT-based applications. Albeit, the reliability RPL routing protocol is diminished due to insecure routing path and low-reliability link selection. The reliable RPL design is a censoriously challenging issue owing to the malicious activities and limited resources of tiny smart meters [2]. Additionally, the AMI is a large-scale network and incorporated numerous different smart meters in recent days. Thus, it drastically increases the packet sending frequency among the smart meters and servers. The large-scale AMI with novel services creates several issues in providing reliable communication among the AMI devices. For instance, an intelligent attacker can launch numerous attacks like rank, hello flood, Denial of Service (DoS), and version by compromising the smart devices of AMI. Hence, assuring security and reliability in AMI-RPL communication in a large-scale resource-limited IoT environment is a tremendously challenging issue [3, 4].
The Objective Function (OF) and the OF metrics are the most significant features of RPL. The OF plays a vital role in the DODAG construction, and it creates a strong influence on the AMI routing reliability. Thus, it takes into account diverse kinds of node features and link cost metrics. However, the design of RPL lacks the incorporation of security-related metrics in DODAG construction, resulting in different types of attacks happen and the communication reliability in minimized. Minimum Rank with Hysteresis Objective Function (MRHOF) and Objective Function zero (OF0) are the two main OF available in RPL, whereas they do not include security metrics against attacks. Since the RPL reliability is suffered by these attacks and it is crucial to eliminate such attacks from RPL DODOAG construction. The deep learning IDS models are suitable solutions to maximize the accuracy of reliable DODAG construction against attacks. The deep learning IDS analyzes the data produced by smart meters extensively and categorizing the data into normal and malicious based on the learning information [5]. Thus, the deep learning IDS is appropriate to provide strong RPL reliability against attacks. Nonetheless, taking into account a single security metric in routing reliability improvement is not an admirable solution. Therefore, the proposed ARR protocol exploits anomaly-based IDS with a hybrid deep learning model to categorize the RPL nodes [6] and includes diverse metrics such as BI, ETX, DI, EBF, NQSI, and TI to enhance the network reliability of RPL routing.
1.1 Contributions
The main contributions of the ARR are as follows.
The AMI applications necessitate suitable routing methods to assure high reliability in a resource-limited IoT environment. An improved RPL routing protocol (IRPL) has been designed [7]. Such work incorporates multiple metrics to select better DODAG paths from a source and destination, resulting in high RPL performance. Nevertheless, the routing attacks diminish the performance of smart meters. Only a few works attempt to design RPL security mechanisms to satisfy the AMI-IoT requirements [8, 9]. The work [8] evaluates the AMI network performance in the presence of blackhole attackers. For securing the AMI communication against blackhole attackers, such work develops a cuckoo filter-based RPL. Nonetheless, it fails to work well in multiple attack scenarios of AMI. Hence, it is crucial to analyze the AMI efficiency in the presence of multiple attacks to introduce appropriate security solutions for maximizing the security and reliability of routing [9]. For a comprehensive review, the conventional works are categorized under three types that are IDS based methods, machine and deep learning-based methods, and reliable RPL methods.
2.1 IDS based solutions
The centralized IDS [10] permits the attackers to show their activities and determines such attacks by employing the IDS system. The centralized IDS model is most compatible with the AMI-IoT environment due to the resource-limited nature of smart devices. The self-organizing map-based IDS [11] detects the RPL assisted sensor network routing attacks by employing a neural network-based clustering model. An anomaly-based IDS [12] employs threshold values to deal with the RPL neighbor and DIS attacks efficiently. In such a lightweight anomaly IDS model, the stand-alone system architecture is employed, and the fully distributed IDS placement methods are utilized. The threshold detection method of the anomaly IDS method also detects similar attacks. Thus, the lightweight anomaly-based IDS strategy is adaptable for different RPL based IoT applications. A hybrid IDS model [13] is based on centralized and distributed IDSs in which the Anomaly Agent-based IDS (AA-IDS) and Specification Agent-based IDSs (SA-IDSs) are utilized in a combined manner. The hybrid model instructs the router nodes to monitor the data traffic and determines the potential attackers by employing the SA-IDS independently. It also uses the AA-IDS to project with some clustering methods for anomaly detection. Finally, the hybrid model considers both the local detection results of SA-IDS and the global detection results of AA-IDS to make the final attack detection decision.
2.2 Machine and deep learning-based solutions
In recent years, several IoT applications have utilized machine learning methods. The work [14] determines multiple RPL attacks based on the machine learning method. It provides an analysis of two familiar OFs of RPL with machine learning strategies in the presence of combined attacks under diverse network scenarios. From the analysis, the results show that the machine learning models attain accurate results against combined attacks. Nevertheless, AMI reliability is suffered by various factors, and a single security model lacks to assure reliable IoT communication. Instead of utilizing a single model, the ensemble attack detection model [15] integrates multiple machine learning techniques such as Boosted Trees, Bagged Trees, Subspace Discriminant and RUS Boosted Trees to enhance the accuracy level of attack detection strategy. Further, it takes the attack decision based on the result generated by ensemble learning. The ensemble model provides security against diverse attacks such as Sinkhole, Blackhole, Sybil, and Clone ID. However, the ensemble learning model decreases the lifetime of smart meters owing to high resource dissipation. A Machine Learning-based secure RPL routing (MLRP) [16] employs a Cooja simulator to produce a complex RPL dataset with normal and malicious data. Further, it uses the SVM machine learning algorithm to detect the attackers effectively. The MLRP employs Principal Component Analysis (PCA) for feature dimensionality reduction and maximizes the learning accuracy of SVM.
The work [17] integrates a radial basis function-based neural network RBFNN to measure the energy consumption over home smart metering applications. Further, deep learning models are used to identify the RPL attacks. The work [18] develops a highly scalable, deep-learning-based attack security strategy against multiple routing attacks such as decreased rank, hello-flood, and version number modification. The work [19] designs a deep learning-based gated recurrent unit network model to provide security against hello flooding attacks in an IoT environment. A deep learning IDS model [20] includes a multi-layer perceptron to detect the RPL rank attacks. The work [21] designs a deep learning-based intelligent intrusion detection system to detect IoT attacks with high accuracy. The utilization of the attack landscape model with deep learning effectively handles the dynamism of the IoT network. The intelligent deep learning strategy does not require pre-built traffic data, suspicious activities, and network payload affairs. Further, various attacks such as wormhole, sinkhole, blackhole, DDoS, and opportunistic services scenarios are used to analyze the effectiveness of the intelligent model. The work [22] proposes a new deep learning-based intrusion detection system (DL-IDS) to offer security against four various IoT attacks. The DL-IDS utilizes a spider monkey optimization algorithm to select an optimal feature set and employs a stacked deep polynomial network to classify the attacks under the categories like DoS, probe, user-to-root, and remote-to-local. Moreover, the spider monkey optimization algorithm efficiently manages the vast IoT data and also increases the attack detection performance. The work [23] proposes a deep learning-based intrusion detection scheme to detect and categorize the attacks like DoS, distributed DoS, data theft, and surveillance. For effective classification, the deep learning model develops a novel IoT dataset and uses a feed-forward neural classifier. Despite the deep learning model maximizes attack classification accuracy, it increases the error rate in large-scale IoT environments and is also not effective against combined attack scenarios.
2.3 Reliable RPL methods
A reliable and delay-aware RPL routing protocol has been proposed [24]. To create reliable and delay-aware RPL, such work introduces a novel metric, ETXDHC that is estimated based on the ETX, average delay, and hop count. By integrating multiple metrics in DODAG construction, the ETXDHC maximizes the RPL reliable performance. The work [25] proposes a reliable and energy-efficient RPL routing protocol, REFER, for mobile IoT applications. It exploits a novel neighbor replacement method with multiple link quality metrics and boosts reliable RPL performance. The neighbor replacement method uses the parent least time values to replace the neighboring nodes. Thus, the REFER maximizes the RPL reliability over mobile IoT scenarios. A downward traffic retransmission mechanism [26] enhances the RPL reliability in mobility supporting IoT application environments. A link reliable and trust aware RPL routing protocol [27] ensures trust among the IoT entities and offers reliability during RPL network construction. Such protocol assures the quality of service to the RPL against multiple attacks and considers variable link characteristics for secure and reliable RPL path construction. However, most of the existing reliable RPL models lack to consider both attacks and network vulnerability impacts on reliable DODAG path selection, resulting in reduced network performance.
The IoT empowers novel services and offers business opportunities day by day even the number of smart devices is ultimately escalated. The RPL is the most suitable fundamental routing protocol that offers flexible communication among smart devices. However, the RPL protocol is vulnerable to several attacks, and its reliable performance depends on the objective functions. Some of the conventional works taking into account the objective function for AMI reliability improvement. However, they lack study on RPL reliability issues through vulnerability analysis of objective functions in RPL, especially with multiple intrusions against RPL in AMI. Also, they lack to cover all objective metrics in reliability performance improvement. The conventional solutions consider both reliability and security-related metrics in RPL performance improvement. A little investigation has been done on machine or deep learning-based IDS, but not for the multiple intrusions on AMI networks. However, a secure, energy-efficient, delay-aware, and reliable RPL routing is not implemented for AMI using the same existing security mechanism. It is also possible to use deep learning approaches for generating security measures and integrating it along with other reliability metrics, such as delay and ETX. However, the existing works lack in integrating multiple metrics for attack detection. Also, the Cooja based network traffic analysis is ineffective in a resource-limited IoT environment, whereas the machine learning traffic analysis model lacks multiple routing reliability metrics. To solve the issues associated with conventional solutions, the proposed ARR takes advantage of both HDL-IDS and MOR-RPL traffic analysis model with multiple objective function metrics to enhance the AMI routing reliability.
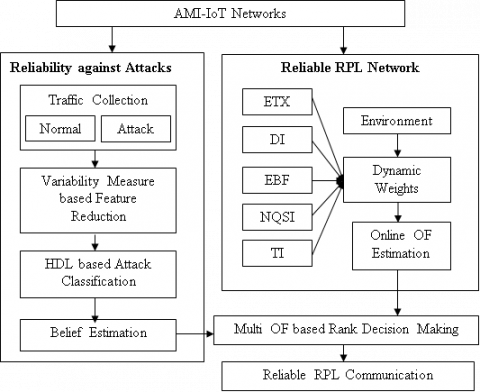
RPL routing attack is a serious threat against the AMI smart meters, and it shrinks the communication reliability of AMI-IoT. To enhance the AMI-RPL reliability, the proposed work ARR employs multi OFs and decides the AMI routing decisions based on multi OF based rank value. For effective resource handling and to improve the lifetime of AMI devices, the ARR includes two RPL reliability improving methods referred to as HDL-IDS and MOR-RPL against RPL routing attacks. Figure 1 sketches the reliability against attacks of HDL-IDS and reliable RPL network construction of MOR-RPL process of ARR with its steps.
Figure 1. Design overview of ARR
Firstly, the reliability against attacks using HDL-IDS of ARR estimates a security metric belief generated by the hybrid deep learning model. For attack classification, the HDL-IDS uses two types of deep learning algorithms, Auto Encoder (AE) and Gated Recurrent Unit (GRU), that categorize the data traffic and nodes into normal and malicious. The unsupervised AE effectively represents the features through labeling and it classifies the data traffic under normal and malicious. Further, the malicious traffic is classified under five categories that are hello flood, DoS, version, rank, and unknown. Consequently, the HDL-IDS only provides the normal data packets as input for measuring the OF, resulting in attack ignorance. Thus, the HDL-IDS accomplishes reliability of RPL against attacks. Secondly, the MOR-RPL orders the trusted parent nodes based on the reliable rank value during the DODAG building. The MOR-RPL exploits the reliability metrics such as belief, ETX, DI, EBF, NQSI, and TI with Belief to maximize the efficiency of reliable communication. The consideration of EBF attains a better tradeoff between energy consumption and reliability. However, most nodes may attain the same rank value in RPL DODAG, and an equality confusion state occurs. Hence, it is crucial to consider equality confusion state during attack classification for reliability enhancement. The equality confusion state includes multiple candidate parents with similar reliable rank values and diverse children number values. The ARR effectively handles the equality confusion state and takes reliable routing decisions by considering the number of children with their behavior.
4.1 Network and attack model
In ARR, the AMI network is modeled as a communication graph G=(N, E), where N refers to the AMI smart meters, and E represents the straight communication link between any two smart meters. The smart meters, N, are tiny devices that are constrained with energy and processing power. The network G is installed a power grid, δ, located in the AMI network corner. The RPL structure is constructed in G, and the RPL based AMI communication is susceptible to multiple routing attacks. For instance:
To diminish the effects of such attacks, the proposed ARR integrates the HL-IDS and MOR-RPL-based secure DODAG construction model. Initially, the HDL-IDS generates a dataset DS with normal and malicious behavior. The DS incorporates numerous relevant and irrelevant features, \mathrm{DS} \in \mathrm{K}, where K is the total number of features. Among them, only K’ numbers of relevant features are adequate to identify the RPL attacks, whereas the irrelevant features may increase the error rate and attack detection accuracy of IDS. To minimize the effect of irrelevant features in IDS performance, the HDL-IDS considers two various variability measures to retrieve K’ features from total K features. Consequently, the HDL-IDS splits the DS into training DSTr and testing DSTe to train and test the data using HDL. Finally, the summation of DSTr and DSTe, $\mathrm{D} \mathrm{S}_{\mathrm{Tr}} \cup \mathrm{D}\mathrm{S}_{\mathrm{Te}}=\mathrm{DS}$. The HDL categorizes the data in DSTe into normal and malicious based on the DSTr. Furthermore, the HDL-IDS sends the number of normal packets to the smart meter for belief measurement. Generally, the rank value indicates the distance between the RPL nodes and gateway. In most RPL routing, the communication reliability of gateway is measured based on hop count, HC. Nonetheless, many factors are interrelated with the improvement of communication reliability. To account for such factors and improve reliable RPL routing, the proposed ARR includes various reliability metrics that are Belief, ETX, DI, EBF, NQSI, and TI in a combined manner.
4.2 Hybrid Deep Learning based Intrusion Detection System (HDL-IDS)
The attack classification of HDL-IDS includes the four steps such as data traffic collection, feature reduction using variability measurement, AE-GRU-based attack detection, and belief estimation for attack classification.
4.2.1 Data traffic collection
The primary step of HDL-IDS is to obtain the AMI-RPL dataset based on the AMI nodes and data transmissions. During initialization, the HDL-IDS collects the data samples from AMI-RPL using the Cooja simulator and executes the attack classification process by using the collected samples. The collected samples include both attack and benign data. For including the attack data into the data samples, the HDL-IDS changes a set of parameters in the RPL core. The collected sample is in raw packet capture (PCAP) file format, and they are transmuted into Comma Separated Values (CSV) for pre-processing. The attack classification of the HDL model necessitates a set of features for training. The RPL routing layer attacks are highly correlated with the AMI network traffic. Hence, it is crucial to gather samples for a long duration to accurately distinguishing the malicious nodes from normal ones. The HDL-IDS collects the number of data samples from entire nodes at the sink for a long period, and it is adequate to the data samples gathered from a similar network for a short time. It ensures that the data collection has sufficient samples from multiple RPL attackers and helps to distinguish the attackers precisely from the legitimate ones. Thus, the HDL-IDS instructs all nodes in AMI to gather the most relevant features and their corresponding values from the data traffic in CSV files and periodically send the collected data back to the sink for attack classification. The raw dataset consists of both relevant and irrelevant features, as shown in Table 1. Incorporating irrelevant and redundant features for attack classification does not contribute to maximizing the HDL accuracy. Thus, the HDL-IDS explores diverse variability measures to choose the relevant and important features.
4.2.2 Feature reduction using variability measurement and labeling
Feature reduction is the process of selecting the most relevant features by reducing the negative impacts of marginal values. Each packet has a set of features or variables associated with a label. By incorporating the irrelevant features in the classification minimizes the HDL-IDS performance. The HDL-IDS enables the sink node to collect the data samples from all nodes and to ignore the irrelevant features from the samples for accurate attack detection. The feature selection or irrelevant feature eradication not only enhances the HDL-IDS accuracy but also diminishes the computational time and complexity level. Moreover, the feature set reduction aids in sorting out the characteristics in network traffic and differentiates the normal node behavior from attacking ones. Instead of examining the whole packet information, an analysis of the header variables of the network layer packets of AMI assists in saving computational resources. Consider that the data points of the variables are referred to as $X=\left(x_1, x_2, \ldots, x_j\right)$.The HDL-IDS model integrates two statistical data variability measures, including the coefficient of variation and rate of change, to drop the irrelevant and redundant features in X for the class (C) that is 'attacker' (C1) and 'normal' (C2) nodes.
Coefficient of Variation (CoV): In the proposed HDL-IDS methodology, the coefficient of variation measure computes the score for each feature (xi) regarding the class 'C' using Eq. (1). It is the ratio between Standard Deviation (SD) and the Mean (M) of the feature values within a particular class. In Eq. (1), 'xi' denotes ith packet in the xth feature and 'NC' refers to the 'N' number of total packets in the Cth class. The proposed HDL-IDS approach computes the coefficient of variation for both the 'attack' and 'normal' classes.
$\operatorname{CoV}\left(\mathrm{x}_{\mathrm{i}}\right)_{\mathrm{C}}=\sum_{\mathrm{i}=1}^{\mathrm{N}_{\mathrm{C}}}\left(\frac{\mathrm{SD}\left(\mathrm{x}_{\mathrm{i}}\right)_{\mathrm{C}}}{\mathrm{M}\left(\mathrm{x}_{\mathrm{i}}\right)_{\mathrm{C}}}\right), \quad \forall \mathrm{C}_1, \mathrm{C}_2$ (1)
Rate of Change (RoC): By applying Eq. (2), the HDL-IDS approach computes the rate of change for each feature with respect to the packets that belong to a particular class.
$\operatorname{RoC}\left(\mathrm{x}_{\mathrm{i}}\right)_{\mathrm{C}}=\sum_{\mathrm{i}=1}^{\mathrm{N}_{\mathrm{C}}}\left(\frac{\mathrm{U}_{\mathrm{x}_{\mathrm{i}}}^{\mathrm{C}}}{\mathrm{S}_{\mathrm{x}_{\mathrm{i}}}^{\mathrm{C}}}\right), \quad \forall \mathrm{C}_1, \mathrm{C}_2$ (2)
In Eq. (2), the terms UxiCand SxiC represents the unique values in a feature ‘xi’ and the total number of values in ‘X’, respectively.
$\mathrm{K}\left(\mathrm{x}_{\mathrm{i}}\right)=\left\{\begin{array}{c}1, \ \mathrm{if} \left(\left[\bigcup_{\mathrm{C} \in \mathrm{C}_1, \mathrm{C}_2} \max _{\mathrm{x}_{\mathrm{i}} \in \mathrm{X}}\left(\operatorname{CoV}\left(\mathrm{x}_{\mathrm{i}}\right)_{\mathrm{C}}\right)\right] \& \&\left[\bigcup_{\mathrm{C}=\mathrm{C}_1, \mathrm{C}_2} \max _{\mathrm{x}_{\mathrm{i}} \in \mathrm{X}}\left(\operatorname{RoC}\left(\mathrm{x}_{\mathrm{i}}\right)_{\mathrm{C}}\right)\right]\right) \\ 0, \quad\quad\quad\quad\quad\quad\quad\quad\quad\quad\quad\quad\quad\quad\quad\quad\quad\quad\quad\quad\quad\quad\quad\quad\quad\quad \text { otherwise } \end{array}\right.$ (3)
The HDL-IDS approach selects a subset of features based on the variability measurement score from Eqns. (1) and (2). By applying Eq. (3), it reduces the number of features with the high variance score based on the weighted parameter for two different variability measurements. The HDL-IDS model selects and retains the 'K' number of features based on the accumulated value of all static reliability measures. It selects the feature with a high variance score on both the coefficient of variation and rate of change measurements on both the classes. Thus, the high variability features in 'K' are selected as the final feature set 'K'. Further, it labels the features. Moreover, Table 2 list outs the variability measurements based on selected features with labeling.
Table 1. Features in collected data set
|
Sl. No |
K Feature set |
Description |
|
1 |
S |
Source node |
|
2 |
D |
Destination Node (Smart meter or sink) |
|
3 |
SAddr |
Address of source node |
|
4 |
DAddr |
Address of destination node |
|
5 |
N |
Number of nodes in AMI |
|
6 |
S_ID |
Sink identity |
|
7 |
N_ID |
Node identity |
|
8 |
NR |
Root node of DODAG |
|
9 |
NP |
Parent node of DODAH |
|
10 |
Nc |
Child node of DODAG |
|
11 |
V |
Version number (Similar to all nodes in a DODAG) |
|
12 |
VMax |
Maximum value of version number |
|
13 |
VMin |
Minimum value of version number |
|
14 |
VD(DODAG1,DODAG 2) |
Version number value difference of DODAG 1 and 2 |
|
15 |
R |
Rank Value |
|
16 |
RMax |
Maximum rank value |
|
17 |
RMin |
Minimum rank value |
|
18 |
RD |
Rank value difference |
|
19 |
PType |
Packet Type (DIO, DAO, DIS, ACK, and data) |
|
20 |
PLength |
Packet length |
|
21 |
PMaxlength |
Maximum length of a packet |
|
22 |
PMinlength |
Minimum length of a packet |
|
23 |
Srate |
It is the packet sending count of S |
|
24 |
T |
Packet sending time |
|
25 |
TMax |
Maximum packet sending time |
|
26 |
TMin |
Minimum packet sending time |
|
27 |
IDN |
Number of intermediate devices |
|
28 |
EC |
Energy consumption level of nodes |
|
29 |
PForward |
Number of forwarding packets |
|
30 |
PReceived |
Number of received packets |
|
31 |
PDropped |
Number of dropped packets |
|
32 |
PSuccess |
Number of successfully delivered packets |
|
33 |
H |
Number of hops |
|
34 |
ETX |
Expected transmission count |
|
35 |
L |
Label-normal and attack |
|
36 |
Ta |
Type of attack |
Table 2. Selected K' feature set and labeling
|
Sl. No |
K’ Feature Set |
Hello Flood |
DoS |
Rank |
Version |
Labeling |
|
1 |
S |
√ |
√ |
|
|
|
|
2 |
D |
√ |
√ |
|
|
|
|
3 |
PType |
√ |
√ |
|
|
|
|
4 |
Srate |
√ |
|
|
|
|
|
5 |
EC |
|
√ |
|
|
|
|
6 |
T |
|
√ |
|
|
|
|
7 |
PForward |
|
√ |
|
|
|
|
8 |
PReceived |
|
√ |
|
|
|
|
9 |
ETX |
√ |
|
|
|
|
|
10 |
R |
|
|
√ |
|
|
|
11 |
RMax |
|
|
√ |
|
|
|
12 |
RMin |
|
|
√ |
|
|
|
13 |
RD |
|
|
√ |
|
|
|
14 |
V |
|
|
|
√ |
|
|
15 |
VMax |
|
|
|
√ |
|
|
16 |
VMin |
|
|
|
√ |
|
|
17 |
VD(DODAG1,DODAG 2) |
|
|
|
√ |
|
|
18 |
L |
|
|
|
|
√ |
|
19 |
Ta |
|
|
|
|
√ |
4.2.3 HDL attack classification
The proposed HDL-IDS approach provides the raw input dataset for the AE model to generate the representation for the feature-values of both the attacker and non-attacker nodes. The HDL-IDS straightly inputs the feature set to AE for unsupervised representation and takes the labeled ‘K’ as an input feature set to the GRU for supervised categorization. The deep learning algorithms can retrieve the additional features themselves based on the prime features provided by the algorithm. Thus, it improves the DL learning process as more accurate. Also, the advent of the graphics processing unit in DL minimizes the learning duration of DL considerably. The deep learning models include multiple consecutive layers in which the output of the previous layer is taken as input by the current layer. The HDL-IDS model incorporates an AE-GRU deep learning model that considers the advantages of unsupervised AE and supervised GRU. Thus, the AE and GRU are the unsupervised and supervised deep learning models that effectively classify unknown and multiple RPL attacks.
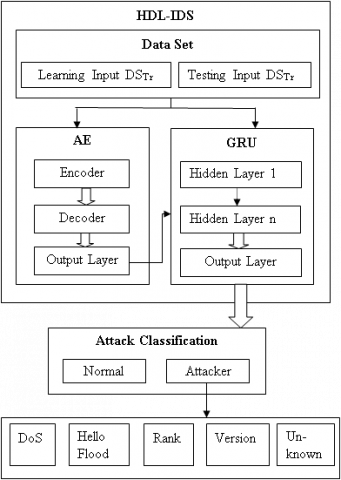
The HDL-IDS trains the AE by taking the entire features (M) as the inputs for the deep representation of K ⊆ M. The HDL architecture with AE and GRU is sketched in Figure 2. The HDL-IDS divides the data traffic into $\mathrm{DS}_{\mathrm{Tr}}=\left\{\mathrm{x}_1, \mathrm{x}_2, \ldots . \mathrm{x}_{\mathrm{n}-1}\right\}$ and $\mathrm{DS}_{\mathrm{Ts}}=\left\{\mathrm{x}_{\mathrm{n}}, \mathrm{x}_2, \ldots . \mathrm{x}_{\mathrm{T}}\right\}$ for training and testing the attack classification.
Figure 2. HDL architecture
Feature Representation Using AE. The AE is an unsupervised deep learning classification algorithm that learns the normal behavior of the nodes during the training process. The AE is the type of artificial neural network that includes two parts that are encoder and decoder. The encoder maps the input into the code, and the decoder is utilized to map the code to the input reconstruction. The main advantage of the AE is to facilitate the learning model to recognize the unknown attacks in dynamic network scenarios through the latent representation of the input data. In the subsequence of variability measurement-based feature reduction, the proposed HDL-IDS approach employs the AE model to generate the high-level abstraction of the input data. The AE takes the ‘M’ features with data traffic as input and inherently analyzes the relations among the feature-values for resulting in the latent representation of the input feature-values. By validating the reconstructed input with the original input features, the AE model results in a final representation for the feature values in an unsupervised manner. With the target of enhancing the intrusion detection performance in the GRU, the proposed HDL-IDS approach utilizes the latent representation along with the reduced relevant feature set for training the GRU model. The learned representations from the AE greatly assist the feature extraction without discrepancies or complex noise in the data, which also facilitates the detection of intrusions. In essence, the HDL-IDS approach generates the latent representation for the packet behavioral patterns in the class-specific packets to avoid the wide coverage in the feature representation and potentially influence the significance of the feature values in a particular class. The proposed work retains the AE representation output for the reduced number of features alone with the knowledge extracted from the entire features. Moreover, the feature reduction in the HDL-IDS heavily relies on both the variability measurement and the deep AE model. Instead of mitigating the features using either the AE alone or the variability measurement, the proposed approach removes the irrelevant features from the input feature set through the knowledge of variance score and the deep representation for enriching the intrusion detection in the GRU model.
Attack Detection Using GRU Classifier. The architecture of GRU includes a reset and update gate with multiple hidden layers. The main intention of the reset gate is to combine the new entries with the previous one effectively. The update gates provide the information about the previous entries, which are stored in GRU memory. Further, it uses such data to take the attack detection output decision. In HDL-IDS, the GRU takes the DSTr with labeled attack features as input for the learning process. Further, it exploits the learned input to classify the attacks of DSTs. Finally, the HDL-IDS classifies the data traffic in DSTs into normal and attack based on the output results generated by the GRU model. Thus, the HDL-IDS approach detects intrusions from the training knowledge using the following equation.
$\mathrm{S}_{\mathrm{n}}=\left\{\begin{array}{l}\mathrm{S}<0.5 ; \text { Normal } \\ \mathrm{S} \geq 0.5 ; \text { Attacker }\end{array}\right.$ (4)
To classify the data traffic into the attack and normal, the HDL-IDS fixes a score value ‘S’ that lies between 0 and 1. In Eq. (4), the term Sn is the score value of node ‘n’. In HDL-IDS, the nodes that have an ‘S’ value equal to or less than 0.5 are classified as normal ones. Otherwise, they are classified as attackers. Further, the attack traffic is classified under the four categories such as DoS, hello flood, rank, and version by using algorithm 1. In Eq. (4), the term $\left(T_a\right)_n$ is the type of attack that occurred at node n. Moreover, the normal traffic results are used for measuring the belief security metric.
Belief Estimation. The HDL-IDS reduces the features with high variability as a prominent feature set. Exploiting such features, the HDL-IDS trains the HDL and classifies the collected packet samples into normal and malicious. Further, it forwards the number of normal packets values to the sink to decide the belief value of data forwarding. The HDL-IDS computes the belief of a node as follows.
$\mathrm{B}_{\mathrm{I}}=$ Normal_Sent $_{\mathrm{i}} /$ Total$_{-}$Sent $_{\mathrm{i}}$ (5)
where, the term Normal_Senti refers the number of packets sent by a node as well as categorized under the normal and the term Total_Senti refers to the total number of packets sent by node i to the gateway. Algorithm 1 explains the belief measurement of HDL-IDS. The belief of normal nodes in HDL-IDS is equal to one, as they transmit all the packets successfully to the sink without any packet loss. Therefore, the HDL-IDS decides that the nodes have a belief value equal to one according to Eq. (5) as trusted nodes and takes the trusted nodes as input for the attack classification process.
Algorithm 1. Belief measurement using HDL-IDS classification
|
Belief Measurement For every packet i in a sample, do { HDL obtains the values of features; Classifies the packet under normal (No) or malicious (Ma) category} For No category do { Group the packets with the same node identity; Count packets with each node identity; Execute the belief measurement using the Eq. (5)} |
In AMI-RPL, the incorporation of novel AMI smart meters into the network has great importance in enhancing the efficiency of ARR owing to inherent dynamic network characteristics. Therefore, the ARR includes periodic execution of HDL-IDS based attack classification and accurately categorizes the data traffic as normal and malicious. Nevertheless, the node classification should have to be performed to construct the reliable DODAG effectively. Therefore, it considers the multiple reliability metrics and selects reliable parents using the MOR-RPL mechanism. The MOR-RPL of ARR includes two sections that are OF estimation and multi OF based rank decision making.
5.1 OF estimation
The prime intention of MOR-RPL is to maximize the communication reliability and balance the workload and lifetime differences of all smart meters. Therefore, the MOR-RPL considers multiple reliability metrics in reliable DODAG construction. The reliability metrics are ETX, DI, EBF, NQSI, and TI. To guarantee communication reliability, the MOR-RPL employs ETX that represents the number of data transmissions by a meter to deliver a packet to the gateway successfully. The MOR-RPL expresses the ETX as follows.
$\mathrm{ETX}=1 /\left(\mathrm{D}_{\mathrm{f}} * \mathrm{D}_{\mathrm{r}}\right)$ (6)
In Eq. (6), Df and Dr refer to the measured probability of packet delivery to the neighbor and measured probability that the acknowledgment packet is successfully received. The high-quality paths of DODAG have a low value of ETX. Instead of employing a single metric in the parent selection process, the proposed MOR-RPL incorporates multiple metrics and successfully meets the AMI reliability requirements. Also, it prolongs the lifetime of smart meters without compromising transmission reliability. Along with the ETX measurement, the delay, battery depletion at nodes, node queue status, and throughput metrics are significant factors in AMI reliability and lifetime performance improvement. The MOR-RPL measures the delay index DI at a node n as follows.
$\mathrm{DI}_{\mathrm{n}}=\mathrm{Pf}_{\mathrm{d}}+\mathrm{Q}_{\mathrm{d}}+\mathrm{L}_{\mathrm{d}}$ (7)
The terms Pfd, Qd,and Ppd refer to the packet forwarding delay, queue delay, and link delay at node n, respectively. Further, the EBF is measured as follows:
$\mathrm{BF}_{\mathrm{i}}=\left(\text { Lifetime }_{\max }-\text { Lifetime }_{\min }\right)_{\text {for rank } \mathrm{k}}$ (8)
$\mathrm{EBF}_{\mathrm{i}}=$ Energy $_{\mathrm{i}}-\mathrm{BF}_{\mathrm{i}} /$ Energy $_{\mathrm{i}}$ (9)
where, the terms BFi, Lifetime_max, and Lifetime_minrepresent a node balancing factor, maximum lifetime of a node in a particular rank value, and the minimum lifetime of a node in a particular rank value, respectively. If the energy difference of the nodes is high in a specified rank value, the value of BFi is also high. It enforces the MOR-RPL to choose a node with Lifetime_maxor nodes closer toLifetime_max. To satisfy such requirements, the MOR-RPL computes the EBF value for each neighbor to choose the parent and builds a prolonged DODAG structure of AMI. Consequently, the node value mainly depends on the queue status of the corresponding node, which directly reflects the traffic load of the RPL network. The NQSI is computed using the following equation.
$\mathrm{NQSI}_{\mathrm{n}}=\frac{\sum_{\mathrm{i}=1}^{10} \mathrm{qp}(\mathrm{i})+\sum_{\mathrm{i}=11}^{\max \mathrm{qs}} \quad 2 * \mathrm{qp}(\mathrm{i})}{\operatorname{Max} \mathrm{qs}}$ (10)
In the above Eq. (10), the term I is varied from 1 to maximum queue limit (Max qs) of the node n. The metric NQSIn is estimated periodically for every second in MOR-RPL. Thus, it effectively reduces the impact of high network traffic on routing reliability and enhances the AMI-RPL performance. Finally, the MOR-RPL measures the TI using the following Eq. (11).
$\mathrm{TI}_{\mathrm{p}}=\frac{\mathrm{D}_{\text {Size }} * \mathrm{~T}_{\mathrm{DT}}}{\mathrm{T}_{\mathrm{R}}}$ (11)
where, the term TI_p is the throughput index of a packet p. The terms DSize, TDT,and TR represent the data packet size, time taken to transmission, and response time, respectively. Moreover, the MOR-RPL assigns dynamic weights to the abovementioned five metrics and evaluates the OF using the following equation.
$\mathrm{OF}=(\mathrm{W} 1 * \mathrm{ETX})$
$+\left(\frac{1}{\mathrm{~W} 2} * \mathrm{DI}_{\mathrm{n}}\right)+\left(\frac{1}{\mathrm{~W} 3} * \mathrm{EBF}_{\mathrm{i}}\right)$
$+\left(\mathrm{W} 4 * \mathrm{NQSI}_{\mathrm{n}}\right)+\left(\mathrm{W} 5 * \mathrm{TI}_{\mathrm{p}}\right)$ (12)
In Eq. (12), the ETX, NQSI, and TI are positive indicators of reliability improvement. Therefore, they get high-weight values. The DI and EBF are negative indicators of reliability enhancement, and they get minimum weight values. Moreover, the MOR-RPL provides the OF as input to a multi OF-based rank decision-making model.
5.2 Multi OF based rank decision making
Using the Belief above and OF measures, the proposed ARR calculates the reliable rank value of node i by exploiting the following Eq. (13).
Reliable $\operatorname{Rank}_{\mathrm{i}}=\alpha * \mathrm{OF} / \beta * \mathrm{~B}_{\mathrm{I}}$ (13)
Each node selects the path upward in its DODAG with the minimum value of reliable rank. The lowest value of reliable rank defines the best security, quality, and long-life links. Furthermore, varying α and β assists the ARR to differentiate the importance between metrics. Finally, the control parameter values should satisfy the condition of α + β = 1. For furnishing equitable importance to both communication reliability against attacks and RPL network, the ARR assigns both values as 0.5. The smart meters with similar reliable rank value creates confusion in the decision making. In such a case, the proposed work chooses the parent node with a minimum number of children as the final one for reliable data transmission. Moreover, the traffic analysis of MOR-RPL enhances the reliability against attacks by considering the belief measure and assures the reliability against network vulnerabilities by incorporating the OF measure.
The ARR categorizes the performance evolution into two parts such as python based HL-IDS and Cooja based MOR-RPL.
6.1 Performance results of python based HL-IDS
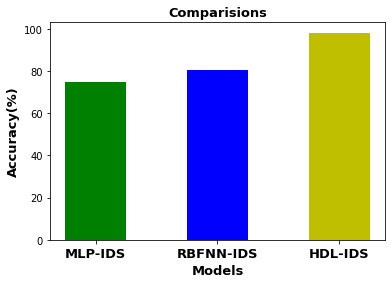
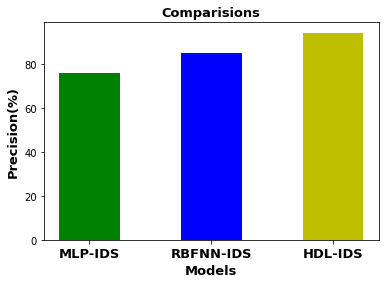
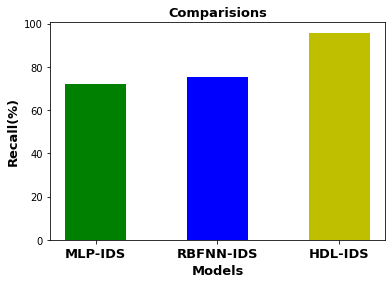
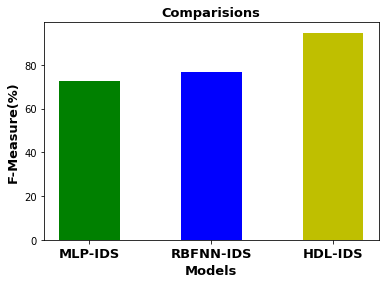
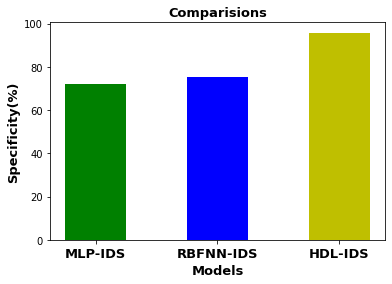
The HDL-IDS efficiency analysis is performed using python libraries. To show the performance of the hybrid deep learning model, the HDL-IDS is compared with the existing two deep learning algorithms that are MLP-IDS [20] and RBFNN-IDS [17]. The HDL-IDS efficiency is analysed for the following metrics.
Figure 3 depicts the performance results of HDL-IDS by comparing it with MLP-IDS and RBFNN-IDS. From the results of figure 3, the deep learning model is highly suitable for solving attack classification problems due to the multi-layer structure. The deep learning algorithms can retrieve the additional features based on the key features furnished by the algorithm, resulting in more accuracy. Also, the advent of the graphics processing unit in deep learning significantly shrinks the learning duration. The architecture of multiple consecutive layers in deep learning assists in enhancing the classifier performance. For example, in Figure 3 (a), the MLP-IDS, RBFNN-IDS, and HLD-IDS accomplish 75.6%, 84.9%, and 94.1% accuracy, respectively. However, the accuracy of HDL is high than the other two models. For instance, the HDL-IDS increases the accuracy value by 23.3% and 17.6% than MLP-IDS and RBFNN-IDS, respectively, as shown in Figure 3(a). It is caused due to the consolidation results of two deep learning models in HDL-IDS. The single learning models learn inaccurate data due to noise in many situations, and the hybrid model rectifies such issues. Thus, the hybrid model attains superior performance than single deep learning models. For example, Figures 3(b) and 3(c) show that the HDL-IDS attains the precision and recall values of 94.1% and 95.8%, respectively. Thus, the precision of HDL-IDS is high in the range of 18.5% and 9.2%, and the recall is increased by 23.9% and 20.5%, respectively, than the MLP-IDS and RBFNN-IDS. Albeit the MLP-IDS and RBFNN uses multiple layers for classification, they necessitate accurate learning data without noise. The HDL-IDS solves the issues of single learning models by integrating multiple deep learning algorithms. From Figures 3(d) and 3(e), the F-measure and specificity values of HDL-IDS are obtained by 94.7% and 95.8%, respectively. Moreover, considering two variability measurements for feature selection and auto encoder-based latent feature representation maximizes the GRU classification accuracy of the HDL-IDS model. The F-measure values of HDL-IDS are increased by 22.2% and 17.8%, and the specificity values of HDL-IDS are varied in the range of 23.9 and 20.5 compared with DT-IDS RF-IDS demonstrated in Figure 3(d) and 3(e).
(a)
(b)
(c)
(d)
(e)
Figure 3. Classification performance results of HDL-IDS
6.2 Performance results of Cooja based MOR-RPL
The efficiency of the proposed MOR-RPL performance is evaluated using Contiki/Cooja Simulator. The performance of RPL reliability performances against attacks and network failure is measured in terms of the following performance metrics.
6.2.1 RPL reliability performance results against attacks
In this section, the RPL reliability performance is evaluated without HDL-IDS and with HDL-IDS to depict the reliability improvement against attacks. The simulation parameters are described in Table 3.
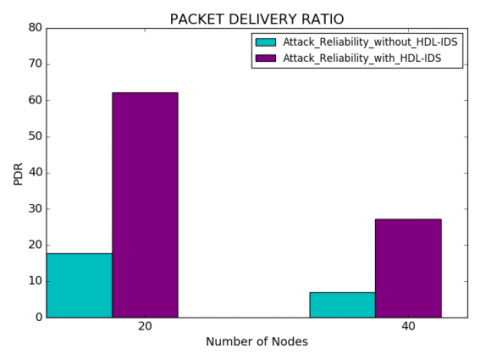
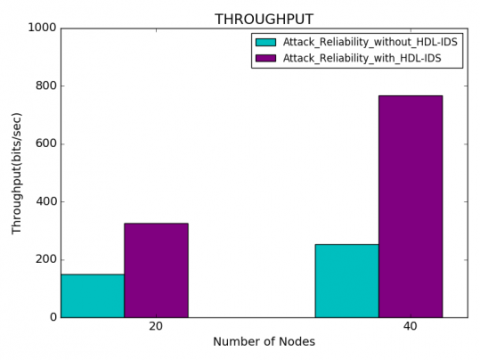
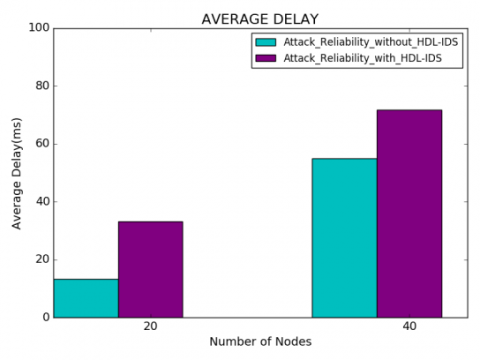
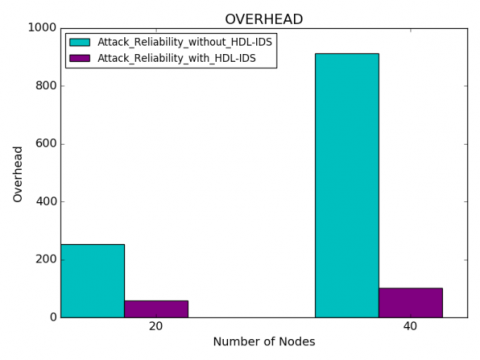
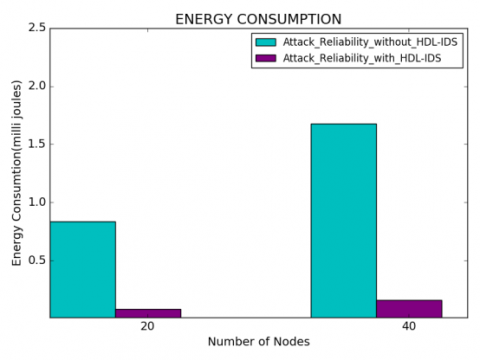
To show the superior performance of the HDL-IDS traffic analysis model, the results are obtained in two ways that are the attack reliability without HDL-IDS and the attack reliability with HDL-IDS with diverse node density scenarios. Figure 4 depicts the reliability performance results of HDL-IDS obtained in terms of PDR, throughput, average ETX, average delay, overhead, and energy consumption under 20 and 40 node density scenarios. To show the superiority of HDL-IDS, it is compared with the attack reliability results without the HDL-IDS model. From the results of figure 4, the deep learning model is highly suitable for solving attack classification problems due to the multi-layer structure. The deep learning algorithms can retrieve the additional features based on the key features furnished by the algorithm, resulting in more accuracy. Also, the advent of the graphics processing unit in deep learning significantly shrinks the learning duration. The architecture of multiple consecutive layers in deep learning enhances the attack elimination performance and belief estimation accuracy level.
For instance, in Figure 4 (a), the PDR of attack reliability without HDL-IDS and with HDL-IDS are 6.9 and 27.2 under 40 nodes scenario. The PDR of attack reliability with HDL-IDS is increased by 74.6% than the attack reliability without HDL-IDS. The main reason is that the HDL-IDS only takes the normal packets in belief estimation and eliminates the attack packets completely from DODAG construction. Thus, it improves the PDR and throughput of attack reliability with HDL-IDS than attack reliability without HDL-IDS under all scenarios. For example, the attack reliability with HDL-IDS accomplishes throughput of 325.3 and 768 for 20 and 40 node density scenarios, as shown in Figure 4 (b). The attack reliability with HDL-IDS improves the throughput by 67% than without HDL-IDS when 40 nodes are present in the network.
Similarly, Figure 4 (c) shows that the attack reliability with HDL-IDS attains average ETX 179.4 and 215.2 for 20 and 40 node density scenarios, respectively. The reason is that the nodes may cause failure due to high energy depletion or the nodes are busy with many links due to node competition for link access under high-density scenarios. Thus, it maximizes the average ETX under a high-density scenario than the low-density scenario. However, the attack reliability with HDL-IDS improves the average ETX performance by 18.3% than attack reliability without HDL-IDS under a high node density scenario. Figure 4 (d) shows that the attack reliability with HDL-IDS accomplishes 33.13 ms and 71.75 ms of average delay results for 20 and 40 node densities, as eliminating attack packets using HDL-IDS needs some time to execute the deep learning algorithm at sinks. Thus, it increases the delay of attack reliability with HDL-IDS by 23.5% than attack reliability without HDL-IDS for 40 node density scenarios. Further, the energy consumption and overhead results of attack reliability with HDL-IDS are superior under 20 and 40 node density scenarios. For example, the overhead and energy consumption of attack reliability with HDL-IDS are reduced by 88.9% and 90% than without HDL-IDS under 40 node density scenarios, as shown in Figures 4 (e) and (f). The execution of the HDL algorithm at sinks considerably minimizes the energy consumption at network nodes.
Table 3. Simulation parameters of reliability measure against attacks
|
Parameters |
Values |
|
Routing Protocol |
RPL |
|
Total Number of Nodes |
20, 40 |
|
Number of Attacker Nodes |
20 topology -> 4 40 topology -> 8 |
|
Number of Attacker Nodes |
20% of the total density |
|
Simulation Area |
200m x 200m |
|
Transmission Range |
50 m |
|
Simulation Time |
1 Minute |
|
Physical Layer |
IEEE 802.15.4 |
|
Radio Medium |
UDGM |
(a)
(b)
(c)
(d)
(e)
(f)
Figure 4. RPL reliability performance results against attacks
6.2.2 MOR-RPL network reliability performance
In this section, the MOR-RPL is compared with the existing IRPL [7] to analyze its reliability efficacy against network vulnerabilities. The simulation parameters are described in Table 4.
Table 4. Simulation parameters of network reliability measure
|
Parameters |
Values |
|
Routing Protocol |
RPL |
|
Total Number of Nodes |
30,60 |
|
Number of Death Nodes |
10% of the total density |
|
Number of Death Nodes due to Energy Depletion |
30 topology -> 3 60 topology -> 6 |
|
Simulation Area |
200mx200m |
|
Transmission Range |
50m |
|
Simulation Time |
1 minute |
|
Physical Layer |
IEEE 802.15.4 |
|
Radio Medium |
UDGM |
(a)
(b)
(c)
(d)
(e)
(f)
Figure 5. Network reliability performance results
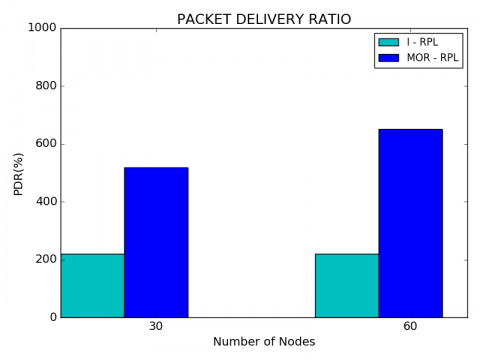
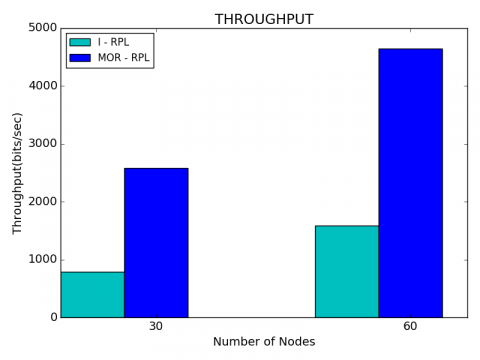
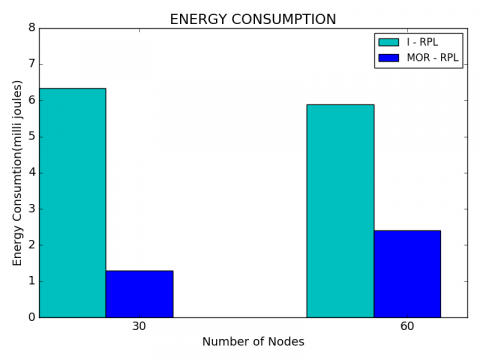
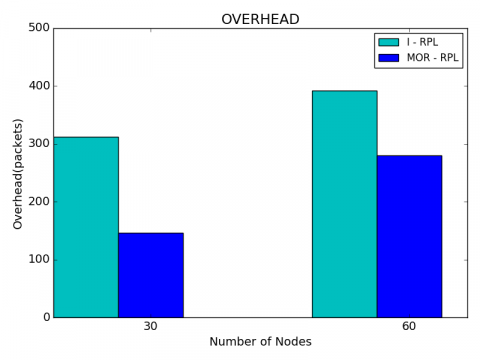
Figure 5 illustrates the reliability performance comparative results of MOR-RPL and IRPL in terms of PDR, throughput, average ETX, average delay, energy consumption, and overhead under 30 and 60 node density scenarios. Figures 5 (a) and 5 (b) illustrate that both methods escalate the PDR and throughput by adjusting the node density from low to high. The reason is that the network connectivity is better when a large number of nodes are present in the network. For instance, the MOR-RPL attains 518.1 and 651.7 PDR for 30 and 60 node densities, respectively. The results of Figures 5 (a) and 5 (b) show that the PDR and throughput of MOR-RPL are improved compared with the existing IRPL. Albeit both models incorporate multiple metrics in DODAG construction, the incorporation of reliability metrics with security metrics assists the MOR-RPL to maximize the PDR and throughput values than the existing IRPL. The multi OF reliable rank-based parent selection in MOR-RPL also boosts the PDR and throughput of MOR-RPL. For example, the PDR results of MOR-RPL and IRPL are 651.7 and 220.5, respectively, for 60 nodes scenario, since the PDR of MOR-RPL is escalated by 66.2% more than that of IRPL. Also, the consideration of ETX and NQSI in MOR-RPL accomplishes a better tradeoff between hop count and congestion under dense network scenarios. Thus, it assists the MOR-RPL in enhancing the data delivery speed. For instance, the throughput of MOR-RPL is 2580 bits/second and 4644.7 bits/second under low and high node densities, respectively, whereas it is high in the range of 69.3% and 65.8% compared with the existing IRPL when 30 and 60 nodes present in the network.
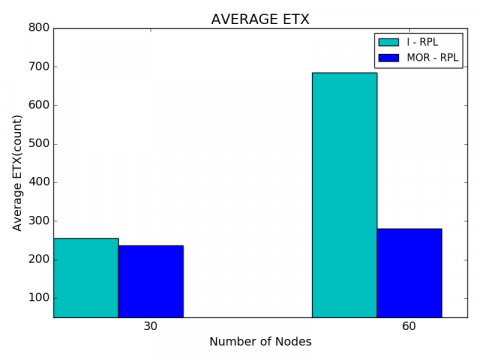
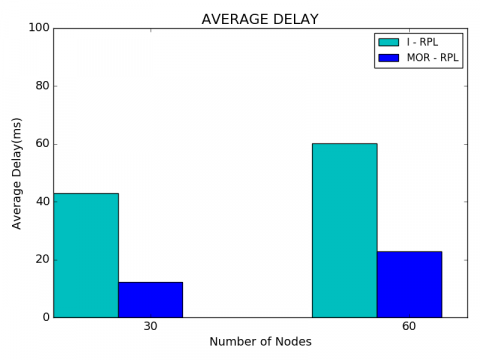
Figures 5 (c) portrays the comparative results of average ETX of MOR-RPL and IRPL obtained for 30 and 60 node density scenarios. Both protocols increase the ETX by varying the number of nodes from low to high. For example, the MOR-RPL accomplishes 237 and 279.8 ETX values for 30 and 60 number of nodes scenarios, respectively. However, the results of Figure 5 (c) show that the average ETX results of the proposed MOR-RPL are reduced compared with the existing IRPL. For example, Figure 5(c) shows that the average ETX of MOR-RPL and IRPL are 279.8 and 684.3 when 60 nodes are present in the network. Figure 5(d) demonstrates that the average delay results of MOR-RPL and IRPL protocols. Both models escalate the delay with increasing the number of nodes, as the nodes compete to access the same channel under a high-density scenario, resulting in high delay. For instance, the MOR-RPL accomplishes 12.2 ms and 22.7 ms for 30 and 60 node density scenarios, respectively, as shown in Figure 5 (d). However, eliminating attackers and secure DODAG construction with multiple metrics in MOR-RPL enables the shortest and secure path to packet delivery. Thus, it minimizes the delay of MOR-RPL when compared to IRPL. For instance, the MOR-RPL minimizes the delay by 71.6% than IRPL, when 30 nodes are presented in the network.
Figures 5 (e) and (f) plot the energy consumption and overhead of MOR-RPL and IRPL models by adjusting the number of nodes from 30 to 60. The MOR-RPL increases the overhead and energy consumption by increasing the number of nodes from low to high. For example, the MOR-RPL accomplishes 1.3 joules and 2.4 joules energy consumption for 30 and 60 nodes, respectively, in Figure 5 (e). The results of Figures 5 (e) and 5 (f) demonstrate that the energy consumption and overhead of MOR-RPL are reduced compared with the existing IRPL. The reason is that the MOR-RPL takes the most important reliability metrics like Belief, ETX, DI, EBF, NQSI, and TI in DODAG construction. Thus, the consideration of EBF effectively balances the energy consumption among the smart meters and improves the energy consumption performance of MOR-RPL. For example, the energy consumption of MOR-RPL and IRPL is 2.4 joules and 5.9 joules for 60 nodes scenario, respectively. The energy consumption of MOR-RPL is reduced by 59.3% than the existing IRPL under a high node density scenario of 60. Further, Figure 5 (f) shows that the MOR-RPL attains 146 and 280.3 packets of overhead for 30 and 60 nodes, respectively. However, the overhead of MOR-RPL is diminished by 53.3% and 28.4% than the existing IRPL under 30 and 60 number of nodes scenarios.
This paper proposed AMI-RPL reliability improvement methods such as HDL-IDS and MOR-RPL to solve the attack reliability and network issues in the DODAG construction of AMI-RPL routing. Firstly, the HDL-IDS based attack classification obtains a belief metric by using the normal packet classification results of the hybrid classifier, resulting in multiple attack elimination. The consideration of two different variability measurements in feature reduction significantly diminishes the learning time and improves the accuracy level of the classifier. Secondly, the MOR-RPL considers various network reliability metrics such as ETX, DI, EBF, NQSI, and TI with a belief in OF estimation. Finally, the reliable path is constructed by employing the multi OF-based reliable rank value. The HDL-IDS and MOR-RPL based data traffic classification with multiple metrics significantly improves the security and reliability performance of AMI-RPL routing. Moreover, the performance evaluation with python libraries and Contiki Cooja-based simulation model is employed to validate the effectiveness of the proposed HDL-IDS and MOR-RPL reliability improvement methods. Firstly, the HDL-IDS performance evaluation using python demonstrates that the HDL-IDS maximizes the accuracy value by 23.3% and 17.6% than existing MLP-IDS and RBFNN-IDS. Secondly, the MOR-RPL performance evaluation with Cooja simulation shows that the RPL reliability performance against attacks is maximized by 74.6% with HDL-IDS, and the RPL network reliability performance is improved by 66.2% with optimal resource handling.
[1] Ghasempour, A. (2019). Internet of things in smart grid: Architecture, applications, services, key technologies, and challenges. Inventions, 4(1): 1-12. https://doi.org/10.3390/inventions4010022
[2] Cleveland, F.M. (2008). Cyber security issues for advanced metering infrastructure (AMI). IEEE Power and Energy Society General Meeting-Conversion and Delivery of Electrical Energy in the 21st Century, pp. 1-5. https://doi.org/10.1109/PES.2008.4596535
[3] Huseinović, A., Mrdović, S., Bicakci, K., Uludag, S. (2020). A survey of denial-of-service attacks and solutions in the smart grid. IEEE Access, 8: 177447-177470. https://doi.org/10.1109/ACCESS.2020.3026923
[4] Gunduz, M.Z., Resul, D. (2020). Cyber-security on smart grid: Threats and potential solutions. Computer Networks, 169: 107094. https://doi.org/10.1016/j.comnet.2019.107094
[5] Ancillotti, E., Bruno, R., Conti, M. (2012). RPL routing protocol in advanced metering infrastructures: An analysis of the unreliability problems. IEEE Sustainable Internet and ICT for Sustainability (SustainIT), pp. 1-10.
[6] Thakkar, A., Lohiya, R. (2020). A review on machine learning and deep learning perspectives of IDS for IoT: Recent updates, security issues, and challenges. Archives of Computational Methods in Engineering, 28: 3211-3243. https://doi.org/10.1007/s11831-020-09496-0
[7] Hadaya, N.N., Alabady, S.A. (2021). Improved RPL protocol for low-power and lossy network for IoT environment. SN Computer Science, 2(341): 1-11. https://doi.org/10.1007/s42979-021-00742-1
[8] Zhang, T.C., Zhang, T.M., Ji, X.Y., Xu, W.Y. (2019). Cuckoo-RPL: Cuckoo filter based RPL for defending AMI network from blackhole attacks. In IEEE Chinese Control Conference (CCC), pp. 8920-8925. https://doi.org/10.23919/ChiCC.2019.8866139
[9] Renofio, J.R.R., Pellenz, M.E., Jamhour, E., Santin, A., Penna, M.C., Souza, R.D. (2016). On the dynamics of the RPL protocol in AMI networks under jamming attacks. IEEE International Conference on Communications (ICC), pp. 1-6. https://doi.org/10.1109/ICC.2016.7511150
[10] Aydogan, E, Yilmaz, S., Sen, S., Butun, I., Forsström, S., Gidlund, M. (2019). A central intrusion detection system for RPL-based Industrial Internet of Things. 15th IEEE International Workshop on Factory Communication Systems (WFCS), pp. 1-5. https://doi.org/10.1109/WFCS.2019.8758024
[11] Kfoury, E., Saab, J., Younes, P., Achkar, R (2019). A self organizing map intrusion detection system for RPL protocol attacks. International Journal of Interdisciplinary Telecommunications and Networking, 11(1): 30-43. http://doi.org/10.4018/IJITN.2019010103
[12] Farzaneh, B., Montazeri, M.A., Jamali, S. (2019). An anomaly-based IDS for detecting attacks in RPL-based internet of things. 5th International Conference on Web Research (ICWR), pp. 61-66. https://doi.org/10.1109/ICWR.2019.8765272
[13] Bostani, H., Sheikhan, M. (2017). Hybrid of anomaly-based and specification-based IDS for internet of things using unsupervised OPF based on mapreduce approach. Computer Communications, 98: 52-71. https://doi.org/10.1016/j.comcom.2016.12.001
[14] Foley, J, Moradpoor, N, Ochenyi, H. (2020). Employing a machine learning approach to detect combined internet of things attacks against two objective functions using a novel dataset. Security and Communication Networks, pp. 1-17. https://doi.org/10.1155/2020/2804291
[15] Verma, A., Ranga, V. (2019). ELNIDS: Ensemble learning based network intrusion detection system for RPL based internet of things. IEEE 4th International conference on Internet of Things: Smart Innovation and Usages (IoT-SIU), pp. 1-6. https://doi.org/10.1109/IoT-SIU.2019.8777504
[16] Momand, M.D., Mohsin, M.K., Ihsanulhaq. (2021). Machine learning-based multiple attack detection in RPL over IoT. IEEE International Conference on Computer Communication and Informatics (ICCCI), pp. 1-8. https://doi.org/10.1109/ICCCI50826.2021.9402388
[17] Staiano, A., Inneguale, F. (2017). An RBF neural network-based system for home smart metering. IEEE International Conference on Fuzzy Systems (FUZZ-IEEE), pp. 1-6. https://doi.org/10.1109/FUZZ-IEEE.2017.8015645
[18] Yavuz, F.Y., Ünal, D., Gül, E. (2018). Deep learning for detection of routing attacks in the internet of things. International Journal of Computational Intelligence Systems, 12(1): 39-58. https://dx.doi.org/10.2991/ijcis.2018.25905181
[19] Cakir, S., Toklu, S., Yalcin, N. (2020). RPL attack detection and prevention in the internet of things networks using a GRU based deep learning. IEEE Access, 8: 183678-183689. https://doi.org/10.1109/ACCESS.2020.3029191
[20] Choukri, W., Lamaazi, H., Benamar, N. (2020). RPL rank attack detection using deep learning. In IEEE International Conference on Innovation and Intelligence for Informatics, Computing and Technologies (3ICT), pp. 1-6. https://doi.org/10.1109/3ICT51146.2020.9311983
[21] Thamilarasu, G., Chawla, S. (2019). Towards deep-learning-driven intrusion detection for the internet of things. Sensors, 19(9): 1977. https://doi.org/10.3390/s19091977
[22] Otoum, Y., Liu, D., Nayak, A. (2019). DL-IDS: A deep learning-based intrusion detection framework for securing IoT. Transactions on Emerging Telecommunications Technologies, 33(1): 1-14. https://doi.org/10.1002/ett.3803
[23] Ge, M.M., Fu, X.P., Syed, N., Baig, Z., Teo, G., Robles-Kelly, A. (2019). Deep learning-based intrusion detection for IoT networks. IEEE 24th Pacific Rim International Symposium on Dependable Computing (PRDC), pp. 256-25609. https://doi.org/10.1109/PRDC47002.2019.00056
[24] Nobakht, N., Kashi, S.S., Zokaei, S. (2019). A reliable and delay-aware routing in RPL. 5th Conference on Knowledge Based Engineering and Innovation (KBEI), pp. 102-107. https://doi.org/10.1109/KBEI.2019.8734996
[25] Lalani, S.R., Salehi, A.A.M., Taghizadeh, H., Safaei, B., Monazzah, A.M.H., Ejlali, A. (2020). REFER: A reliable and energy-efficient RPL for mobile IoT applications. CSI/CPSSI International Symposium on Real-Time and Embedded Systems and Technologies (RTEST), pp. 1-8. https://doi.org/10.1109/RTEST49666.2020.9140135
[26] Min, S.W., Chung, S.H., Lee, H.J., Ha, Y.V. (2020). Downward traffic retransmission mechanism for improving reliability in RPL environment supporting mobility. Wireless Smart Sensor Networks, 16(1): 1-19. https://doi.org/10.1177/1550147720903605
[27] Lahbib, A., Toumi, K., Elleuch, S., Laouiti, A., Martin, S. (2017). Link reliable and trust aware RPL routing protocol for internet of things. IEEE 16th International Symposium on Network Computing and Applications (NCA), pp. 1-5. https://doi.org/10.1109/NCA.2017.8171360