Hayder Q. Majeed* | Ali M. Ghazal | Basheer Al-Hadeethi
© 2022 IIETA. This article is published by IIETA and is licensed under the CC BY 4.0 license (http://creativecommons.org/licenses/by/4.0/).
OPEN ACCESS
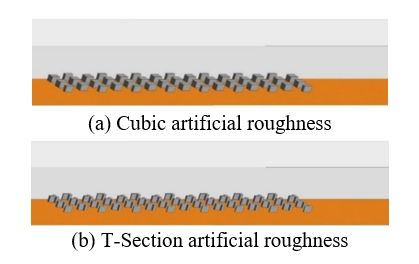
Experimental and numerical studies have been conducted on the effects of bed roughness elements such as cubic and T-section elements that are regularly half-channel arrayed on one side of the river on turbulent flow characteristics and bed erosion downstream of the roughness elements. The experimental study has been done for two types of bed roughness elements (cubic and T-section shape) to study the effect of these elements on the velocity profile downstream the elements with respect to different water flow discharges and water depths. A comparison between the cubic and T-section artificial bed roughness showed that the velocity profile downstream the T-section increased in smooth side from the river and decrease in the rough side from it compared with the case when a cubic artificial bed roughness is used. By comparing the results for the element shapes, it can be notices that the T-section bed roughness element more effective compared to cubic shape for both sides of the channel. The numerical method has been done using Computational Fluid Dynamic (CFD) method. A validation for the CFD model with the experimental study have been carried out for a specific flow discharge and water depth. The results indicated that the velocity distribution profiles downstream the bed roughness elements in both sides shown very good agreement for manning coefficients between the numerical and experimental studies. The range of errors between the experimental and numerical study have been calculated using Root Mean Square Error (RMSE) approach, which is found that the RMSE is approximately equal to 1 in case of cubic bed roughness and the RMSE is about 1.5 in case of T-section bed roughness for both smooth and rough sides. Furthermore, the influence of the velocity profile and the bed erosion downstream of the T-section element under the effect of tides have been investigated using the CFD method, which is commonly happened in Shat al-Arab south of Iraq. The results show that the tide of the flow has a reverse effect on the velocity profiles for both sides. Since the velocity profile downstream of bed roughness region increase in the rough side and decrease in the smooth side compared with the normal flow of the river.
open-channel, artificial bed roughness, CFD, velocity profile, angle of attack
Hydraulic calculations to estimate flow in open channels require an evaluation of the roughness characteristics of the channel. Understanding flow resistance, also known as Manning's roughness coefficient, for various flow conditions aids in the development of improved water management systems [1]. The determination of flow resistance value is related to the solutions to water resources problems such as flood routing, backwater curve computation, channel improvement, marshland flow, and scouring intensity. The roughness coefficient takes into account all of the elements that contribute to energy loss in a stream channel. The channel bed roughness, which is defined by the size, shape, and distribution of the material grains that line the channel's bed and sides, is the most important element (the wetted perimeter). The Manning's roughness coefficient, n, is a factor related to many properties such as the bed material, flow depth, cross-section geometry, etc., it is used to define the flow resistance or roughness of a channel. In this study, the manning coefficient values assumed to be fixed in time because the experimental test done with constant laboratory conditions [2]. Roughness elements are essential parts of natural ecological system for most environmental standpoint. One approach of modifying the flow patterns in a river channel is to introduce artificial roughness into the channel. The artificial roughness to be examined in this study will be of geometric shapes such as cubic and T-sections.
One of the greatest challenges occurred in a river engineering is the change in river topography, due to increase in the erosion of the bed that is close to one side than the other, and hence, changing the river path by time. This problem happens because of variation in the flow velocity in the transvers direction. One of the ways to reduce or eliminate the variation of flow velocity in the transvers direction is by increasing the bed roughness close to one side than the other. This prospective study was designed to investigate the use of artificial bed roughness such as cubic and T-section shapes located in one side above the channel bed in the longitudinal direction to increase the manning coefficient in this region and hence reduce the erosion of the bed [3]. Recently, several studies that investigated an artificial bed roughness have been carried out on increasing the manning coefficient in the open channel flow. Most studies in this field have investigated the effect of these roughs on the whole bed surface such as Noori and Saeed [4], Graf and Blanckaert [5], Hendratta et al. [6], Ibrahim and Noori [7], Pradhan et al. [8], Khoudja and Soudani [9], Yousfi and Aliane [10], and Majeed and Ghazal [3], who conducted a series of CFD simulations with the k- ω SST model were used to calculate Manning's coefficient of artificial geometric roughness element. These elements were placed on the flume's bed and were subjected to various transverse spaces and different angles of attack. Therefore, so that as continues for the previous study, the present investigation aimed to study the effect of roughness located on one side of the channel. There are few studies related with the effect of half bed artificial roughness on the velocity profile in both sides such as Vermaas et al. [11] and Akutina et al. [12] that studied the effect of a lateral artificial cubic bed-roughness variation on the flow over it.
The Computational Fluid Dynamics (CFD) is used to study systems that involve chemical reactions, heat transport, and fluid flow, throughout using a numerical process based on partial differential equations that describe those programs [13]. CFD can gives as mass, flow patterns, velocity, pressure, etc. These parameters help to made better understand of what is occurring on the field [14]. Fluent was used to mathematically simulate and analyze water flow through the open channel. The process to perform an ANSYS CFD analysis contains a pre-processing, solver, and post processing, pre-processing includes the geometry of the fluid domain and mesh formation. The solver involves the definition of material properties, select the flow physics for the model and choose the boundary condition to calculate the flow system's governing equations. The Post-Processing contains the result and its present by contour plots, vector plot, streamlines or data curve etc. ANSYS CFD is used for different fields of incompressible and compressible, turbulent and laminar flows problems, and transient analyses or steady-state.
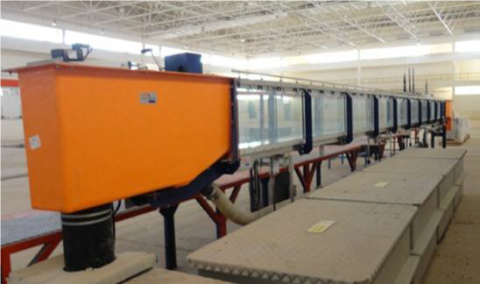
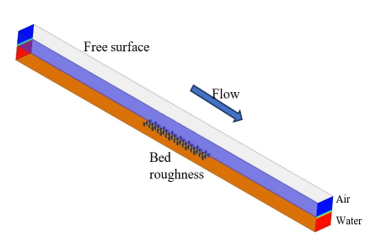
An experimental work was conducted at the Hydraulic Laboratory of the Centre of Engineering Studies and Designs of the Iraqi Ministry of Water Resources. The work was planned and carried out to provide detailed information on depth measurements and velocity distribution on the roughness elements and then calculating the value of coefficient Manning’s for a number of cases of roughness, discharge and depths of flow. The experiments included testing of two geometric roughness models (cubic and T-section). Thus, many variables affect resistance. A series of experiments have been conducted to study the effect of spacing and arrangement of roughness elements on Manning’s. Experiments were carried out in a provided flume of working length of 12.5 m with cross-section 0.3 m wide and 0.45 m deep, see Figure 1. The side walls were of toughened glass walls with stainless steel floor. The bed of the flume was maintained at a horizontal slope during all of the test runs. The flume is completely self-contained and comprises: The glass-sided working section, molded inlet tank, molded discharge tank, a series of interconnected sump tanks, a centrifugal water pump, an electronic flowmeter, a jacking system. A separate freestanding electrical console is supplied that houses the digital flowmeter readout and controls for the water pump and wave maker if this option is fitted.
Figure 1. The flume that was used in the experiments
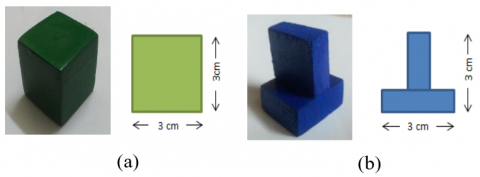
An overshot tilting weir in the discharge tank keeps the water level in the working portion at a safe level. The weir is made up of a paddle with a movable bottom. A winch positioned on top of the downstream end of the flume is used to adjust the height of the weir. Figure 2 shows the artificial roughness different geometric shapes (cubic and T-shape), the height of artificial roughness elements is fixed (3 cm).
Figure 2. The artificial roughness element
Two types of artificial roughness elements were made from wood with different shapes. The first roughness element that was used a cubic shape dimension of (3 x 3 x 3) cm sees Figure 2a and a second element of roughness is T-shape with height 3cm and base 3 cm see Figure 2b. The roughness elements were constructed of wood and were painted with insulating dyes to prevent them from shrinking when wet and to protect them from water damage. The roughness pieces were adhered to the bottom of the channel with a special glue (Silicone pump).
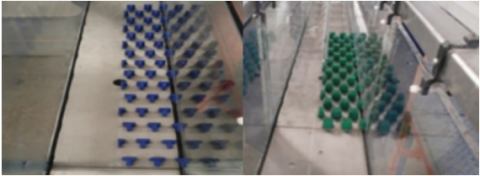
The configuration was designed as shown by Figure 3. In the configuration, the distance between items in the rows was 3 cm. The space between the rows of configuration items is 3.94 cm.
Figure 3. Configuration design of the artificial roughness elements in flume
The numerical modelling in this study is based on the solutions of the Navier-Stokes equations, which are based on the conservation of momentum and mass assumptions inside a fluid. k-ω (SST) turbulent model has been used to simulate the flow over the artificial roughness bed. This turbulent model is considered as a proving version of the k-model in which the k-ε and k-ω models operated automatically through the domain [15, 16].
There are additional transport equations that are solved for a variety of turbulence values. Hirt and Nichols [17] proposed the Volume of Fluid (VOF) technique. Basic boundary conditions in CFD programming originated in aeronautics and mechanical design, but they can be smartly employed to highlight upstream and downstream boundaries in open channels. In any event, CFD programming now includes explicit boundary constraints for open channel situations, allowing the downstream and upstream water elevations to be established. Figure 4 shows a CFD model of the suggested artificial bed roughness for experimental study. The numerical simulation boundary conditions are built up to match the experiment conditions, as shown in Figure 5. The depth of the water flow is also depicted in the diagram. A pressure velocity was considered at the domain's inlet. The free surface height should be determined relative to the datum when showing a free surface in FLUENT. Internal calculations revealed that the static pressure and volume fraction at the inlet are affected by the face's position in comparison to the free surface situation. The flow dynamic pressure had to be taken into account by the energy head as well. At the downstream pressure outlet, only the bottom height level was necessary. The symmetry condition was applied to the boundary above the air phase, resulting in zero shear stress and zero velocity. In such instances, such as open channel boundaries, it is usual practice to apply a symmetry boundary condition. The rest of the borders are viewed as walls, and there is a no-slip rule in place [18].
Figure 4. The geometric design of the artificial roughness elements in CFD model
Figure 5. The boundary conditions of the CFD model
In this work, a hexahedral mesh is used to mesh the geometry, as illustrated in Figure 6. This has been the case since the prism layer's efficient solution in hybrid mesh. In previous studies, the viability of the prism layer yielded a more precise result [18, 19]. After refinement, the total number of elements is around 1M, with a maximum skewness of 0.87, which is less than 1.0. Close to the wall domain, more improvement is being considered. The size of the grid cells adjacent to the walls (y+ value) is important, and the y+ value depends on the modelling technique used. In this study, the k- ω SST model is used to simulate the turbulence condition.
Figure 6. The mesh generation in the CFD model
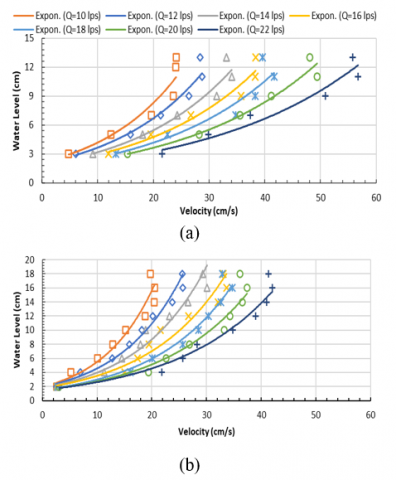
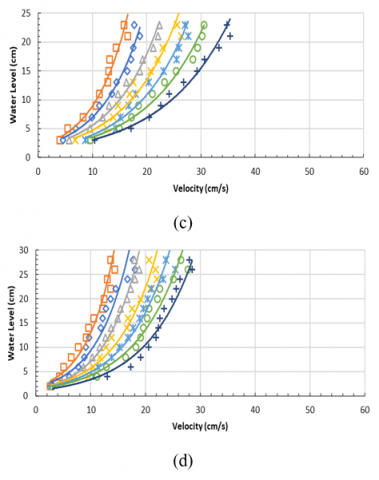
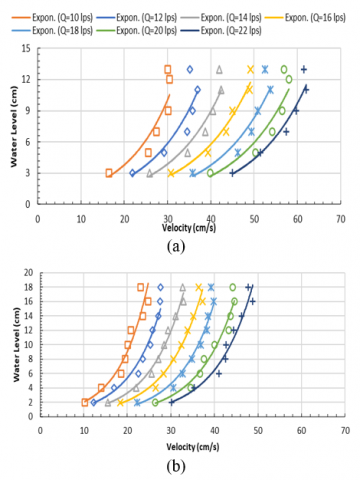
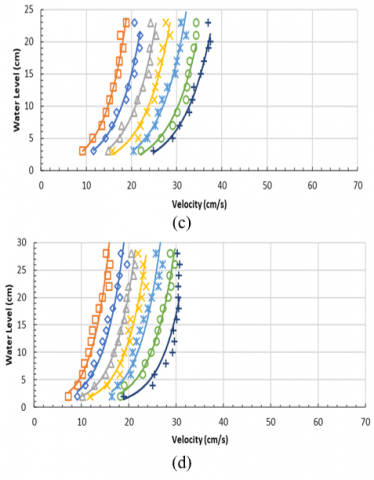
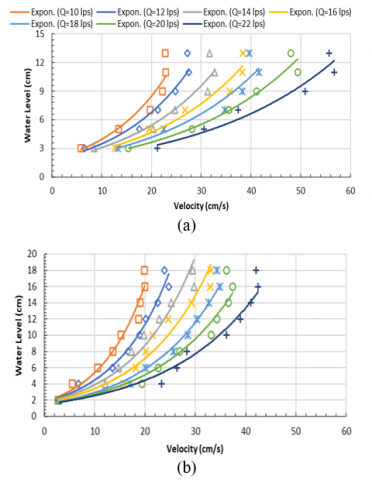
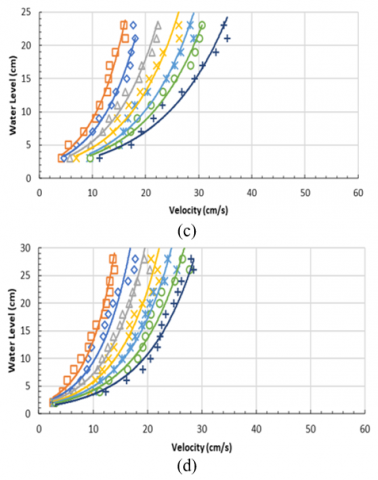
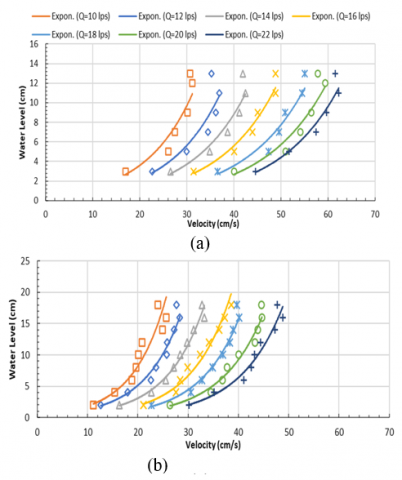
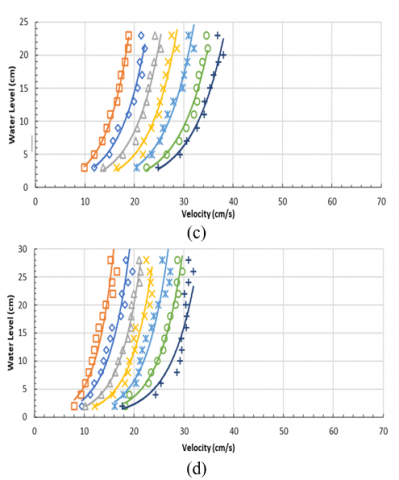
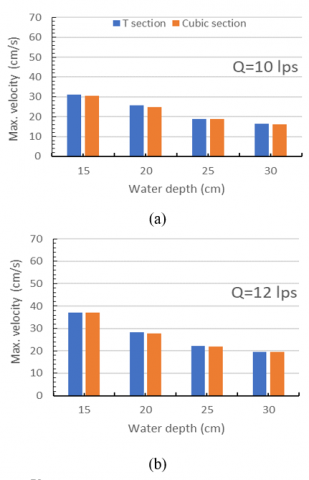
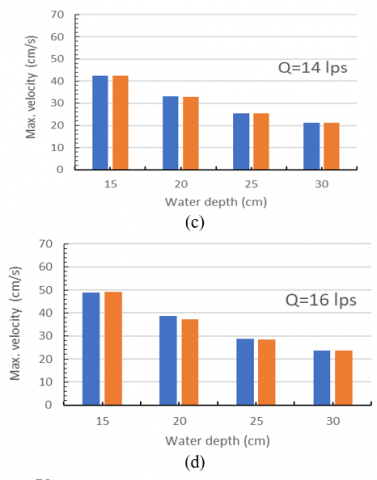
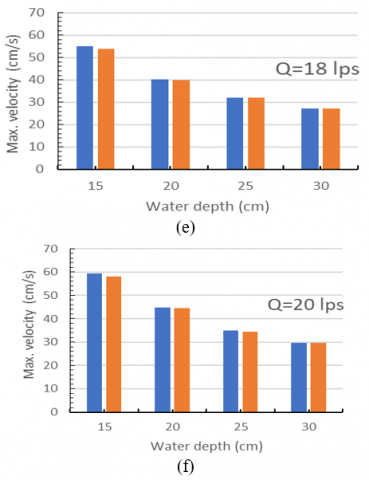
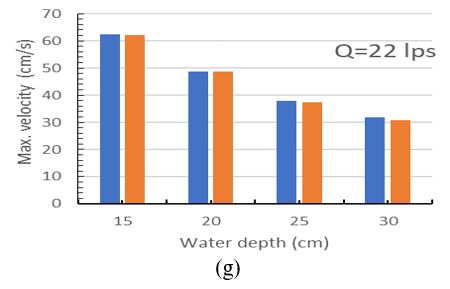
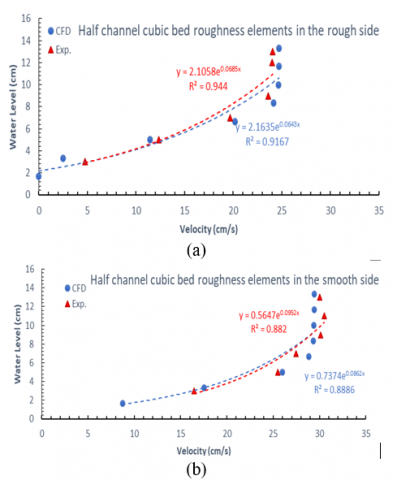
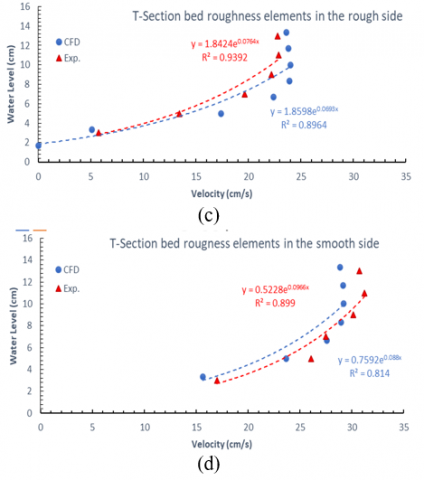
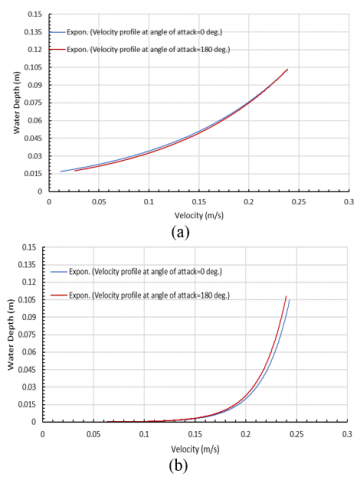
Figures 7-8 show the velocity profiles for the cubic section bed roughness case. The velocity profiles have been located in the rough and smooth side respectively. Depending on flume limitations, these velocity profiles have been calculated for different chosen values of discharge ranged from 10lps to 22lps and also for different heights for water level ranged from 15, 20, 25 and 30 cm. On the other hand, Figures 9-10 present the velocity profiles for the case of T-section for both rough and smooth sides respectively. Same values for discharge and water level height that have been taken in the case of cubic bed roughness were implemented. The results show that the velocity profile for both sides have been increased with increasing the amount of water discharge and decrease with increasing water depth. These results of the experiments in this study work have been agreed well with previous research has been done in same field by Samer [20], beside that, it is clearly shown from the results the effect of rough side from the channel by reducing the velocity profiles passing in this region from the channel. Figures 10 and 11 show a histogram for the maximum values of the velocity for both cases cubic and T-sections and for both sides (rough and smooth) of the river respectively, with respect to varying water depth ranged from 15 to 30 cm. The results show a slight increase in the maximum water velocity value in the roughness side for the case of cubic element compared to that in the T-section elements. Whereas this slight increase had been reversed for the case of T-section, since in case of T-section and for smooth side from the channel it can be clearly seen that there is slight increase in the value of the maximum water velocity for many discharge values. As a results from this conclusion the CFD study have been don for the T-section bed roughness element and subjected to different angles of attack to study the effect of this element on the riverbanks Under the influence of tides. To validate the CFD model in this research, a comparison of Manning’s coefficient between the experimental work and the CFD simulations downstream of the bed roughness elements for all two cases (cubic and T-section) is executed. A flow rate of 0.01 m3/s are given, and water depth is equal to 0.15m are adopted as shown in Figure 12. A good agreement between the numerical simulation and the experimental work with Root Mean Square Error (RMSE) is approximately equal to 1 in case of cubic bed roughness and 1.5 in case of T-section bed roughness for both smooth and rough sides. Figure 13 considering two angles of attack, displays the velocity profiles downstream the bed roughness element (0° and 180°). In this figure the effect of T- section shape that subjected to water flow on the velocity profile with fixed flow discharge and water depth (Q=10lps, h= 0.15m) have been investigated. The results show that the tide of the flow has a reverse effect on the velocity profiles for both sides. Since the velocity profile downstream of bed roughness region increase in the rough side and decrease in the smooth side compared with the normal flow of the river.
Figure 7. Velocity profile in the rough side for different discharges cubic section
Figure 8. Velocity profile in the smooth side for different discharges cubic section
Figure 9. Velocity profile in the rough side for different discharges T-section
Figure 10. Velocity profile in the smooth side for different discharges T-section
Figure 11. Comparison of the maximum value of velocity in the smooth side for different discharges between cubic and T-sections
Figure 12. CFD comparison of the velocity profiles in the rough and smooth side for cubic and T-section bed roughness elements with the experimental results
Figure 13. Velocity profile downstream the T-section in the (a) rough side and (b) smooth side for two angles of attack
In this research the effect of on side artificial bed roughness bed such as Cubic and T-section shapes have been experimentally and numerically investigated. In the first stage the effect of flow discharge and water depth on the velocity profiles downstream of the bed roughness and for both sides (rough and smooth side) have been studied experimentally. It can be concluded that a rise in the velocity profile occurs when the flow discharge is increased while it will decrease when the water depth is increased. In the second stage, a comparison between the cubic and T-section artificial bed roughness showed that the velocity profile downstream the T-section increased in smooth side from the river and decrease in the rough side from it compared with the case when a cubic artificial bed roughness is used. This conclusion led to the use of T-section bed roughness is more applicable compared to cubic bed roughness element to prevent the change in the river topography. Finally, the influence of tides on the velocity profile downstream of bed roughness was quantitatively examined. The findings showed that the tides had an effect on the velocity profile downstream of the bed roughness elements, increasing it on the rough side and decreasing it on the smooth side.
[1] Phillips, J.V., Tadayon, S. (2006). Selection of Manning's roughness coefficient for natural and constructed vegetated and non-vegetated channels, and vegetation maintenance plan guidelines for vegetated channels in central Arizona: US Geological Survey.
[2] Ding, Y., Jia, Y., Wang, S.S. (2004). Identification of Manning's roughness coefficients in shallow water flows. Journal of Hydraulic Engineering, 130(6): 501-510. http://dx.doi.org/10.1061/(ASCE)0733-9429(2004)130:6(501)
[3] Majeed, H.Q., Ghazal, A.M. (2020). CFD simulation of velocity distribution in a river with a bend cross section and a cubic bed roughness shape. Paper presented at the IOP Conference Series: Materials Science and Engineering, 928(2): 022038. http://dx.doi.org/10.1088/1757-899X/928/2/022038
[4] Noori, B., Saeed, M. (1997). Hydraulic resistance of prismatic roughness elements in steep open channels. Al. Rafidain Engineering Journal, 5(1).
[5] Graf, W., Blanckaert, K. (2002). Flow around bends in rivers. Paper presented at the 2th international conference, new trends in water and environmental engineering for safety and life: Eco-compatible solutions for aquatic environments, Capri (Italy).
[6] Hendratta, L., Mangangka, I.R., Supit, C.J., Ohmoto, T. (2014). Effects of regularly square ribs roughness on turbulent flow structure in cases two and threedimensional roughness in an open channel.
[7] Ibrahim, S.S., Noori, B.M. (2016). Stripped bed roughness effect on flow measurement in trapezoidal channels with free overfalls. ZANCO Journal of Pure and Applied Sciences, 28(2).
[8] Pradhan, A., Kumar Khatua, K., Sankalp, S. (2018). Variation of velocity distribution in rough meandering channels. Advances in Civil Engineering, 2018: 1569271. http://dx.doi.org/10.1155/2018/1569271
[9] Khoudja, N.C., Soudani, A. (2019). Numerical study of surface roughness effects on the behavior of fluid flow in micro-channels. Mathematical Modelling of Engineering Problems, 6(2): 285-292. https://doi.org/10.18280/mmep.060217
[10] Yousfi, S.M., Aliane, K. (2021). Turbulent flow around obstacles: Simulation and study with variable roughness. International Journal of Heat and Technology, 39(5): 1659-1666. https://doi.org/10.18280/ijht.390530
[11] Vermaas, D., Uijttewaal, W., Hoitink, A. (2011). Lateral transfer of streamwise momentum caused by a roughness transition across a shallow channel. Water Resources Research, 47(2). http://dx.doi.org/10.1029/2010WR010138
[12] Akutina, Y., Eiff, O., Moulin, F.Y., Rouzes, M. (2019). Lateral bed-roughness variation in shallow open-channel flow with very low submergence. Environmental Fluid Mechanics, 19(5): 1339-1361. http://dx.doi.org/10.1007/s10652-019-09678-w
[13] Malalasekera, W., Versteeg, H. (2007). An introduction to computational fluid dynamics: the finite volume method: Pearson Prentice Hall Upper Saddle River, NJ.
[14] Wanot, J. (1996). Computational fluid dynamics methods in ship design. R&D projects, Germany.
[15] Hellsten, A. (1998). Some improvements in Menter's k-omega SST turbulence model. Paper presented at the 29th aiaa, fluid dynamics conference.
[16] Majeed, H.Q., Abed, B.S., Ibrahim, A.K. (2022). Countermeasure of riverbanks local scour and deposition using different shapes of multiple groynes with different spacing. Mathematical Modelling of Engineering Problems, 9(5): 1277-1281. https://doi.org/10.18280/mmep.090515
[17] Hirt, C.W., Nichols, B.D. (1981). Volume of fluid (VOF) method for the dynamics of free boundaries. Journal of Computational Physics, 39(1): 201-225. http://dx.doi.org/10.1016/0021-9991(81)90145-5
[18] Rodi, W., Ferziger, J., Breuer, M., Pourquie, M. (1997). Status of large eddy simulation: results of a workshop. Transactions-American Society of Mechanical Engineers Journal of Fluids Engineering, 119: 248-262.
[19] Hargreaves, D., Morvan, H., Wright, N. (2007). Validation of the volume of fluid method for free surface calculation: the broad-crested weir. Engineering Applications of Computational Fluid Mechanics, 1(2): 136-146. http://dx.doi.org/10.1080/19942060.2007.11015188
[20] Samer, T.I. (2017). Velocity distribution in a river cross section with variable roughness. M.Sc, University of Baghdad.