Devianti Devianti* | Sufardi Sufardi | Yusmanizar Yusmanizar | Herbert Hasudungan Siahaan | Agustami Sitorus
© 2022 IIETA. This article is published by IIETA and is licensed under the CC BY 4.0 license (http://creativecommons.org/licenses/by/4.0/).
OPEN ACCESS
Determination of the myristicin and alpha-pinene content of nutmeg is still constrained by the extended testing time in the laboratory, which is expensive and is carried out destructively. In addition, non-destructive testing using spectroscopy often faces problems in building models that only rely on algorithms that perform linearly, such as PCR and PLSR. Therefore, the present study studied Vis-NIR (381-1065 nm) as a fast, inexpensive, and non-destructive mechanism to determine the myristicin and alpha-pinene of nutmeg fruits from Aceh, Indonesia. Two algorithms commonly used in spectral data processing, partial least squares regression (PLSR) and machine learning represented by a support vector machine (SVM), were employed and compared to predict myristicin and alpha-pinene in nutmeg fruits. The chemical reference parameters (myristicin and alpha-pinene) were measured using gas chromatography mass spectrometry (GC-MS). Standard normal variate (SNV) and multiplicative scatter correction (MSC) preprocessing were involved as spectra enhancement before the prediction models outcome. The results show that the kernel of the radial basis function (RBF) kernel v-SVM algorithm is better than PLSR for myristicin prediction with gamma ($\gamma$), c, and nu (v) of 0.1, 1.0, and 0.99, respectively. Also, the e-SVM algorithm by RBF kernel is better than PLSR for the prediction of alpha-pinene in nutmeg fruits with gamma ($\gamma$), c, and epsilon ($\mathcal{\varepsilon}$) compositions of 0.01, 10, 0.1, respectively. The coefficient correlation of calibration (rc) and coefficient determination of prediction (Rp2), the root means square error of calibration (RMSEC) and prediction (RMSEP), and the ratio (RPD) for the prediction of myristicin were 0.992, 0.986, 0.941%, 1.325% and 8.348, respectively. The coefficient correlation of calibration (rc) and coefficient determination of prediction (Rp2), the root mean square error of calibration (RMSEC) and prediction (RMSEP), and the ratio of prediction to deviation ratio (RPD) for the prediction of alpha-pinene were 0.976, 0.979, 0.305%, 0.317% and 6.826, respectively. In general, the results satisfactorily indicate that Vis-NIRS, with the appropriate algorithm, has promising results in determining myristicin and alpha-pinene on nutmeg from Aceh, Indonesia, as nondestructive measurement.
agro-product, alpha-pinene, chemometrics, myristicin, nutmeg, Vis-NIR
Nutmeg is the tough kernel of an evergreen tree's seed. Steam distillation of pulverized nutmeg yields an essential oil widely used in the fragrance and medicinal sectors [1-3]. The essential oil is colorless or pale yellow in color, smells and tastes like ground nutmeg. It has several components of interest for the oleochemical industry and is utilized as a natural food flavoring in baked goods, syrups, drinks, and sweets, among other products. Approximately 10,000 tons are manufactured annually and are used mainly in the US, Europe, Japan, and India. Nutmeg essential oil is well known for its biological properties. In ancient medicine, nutmeg and nutmeg oil were prescribed for the nervous system and stomach disorders. Myristicin and alpha-pinene are the chemical components responsible for the slight hallucinogenic qualities of nutmeg oil, and are used throughout the weaning process for drug users [4].
Due to the expansive nature of the primary nutmeg producing regions in Indonesia, soil and industrial processes can impart varying olfactory qualities to nutmeg essential oils. These variations are the result of the chemical makeup. In addition, the maturation of nuts causes variations in quality [5]. Unripe nutmegs are distinguished from ripe nutmegs by their lack of husk and mace and color.
Precision agriculture demands technology to predict certain content quickly and cheaply. Agricultural products cannot be separated from the characteristics of having a significant moisture content, so some industrial technologies can use this to carry out non-destructive technology [6]. The same applies to those who use spectroscopy technology. Molecular spectroscopy methods such as near-infrared are helpful for the quality control of olive oils, the rapid evaluation of essential oils such as thyme, oregano, and chamomile or lavender Grosso, and the measurement of adulteration of virgin olive oils [7]. Assume that the distinction between these oils produced in different regions can be made using gas chromatography and expert smelling. In this scenario, the determination based on short-time spectroscopic approaches should aid in categorizing essential oils. To authenticate, identify, or categorize fats, oils, or essential oils, FTIR with attenuated total reflectance or transmission cell accessories.
The most popular method for spectral data analysis is partial least squares regression (PLSR), a linear multivariate analysis [8-10]. However, because spectral data and the dependent variable have a non-linear correlation, the accuracy of PLSR as a linear multivariate regression approach tends to decline. For spectroscopic studies of data spectrum, non-linear approaches were subsequently presented in the literature as superior substitutes to PLSR. It has been demonstrated that machine learning with the support vector regression (SVR) method produces better prediction results than other models [11-13].
Machine learning has recently received growing attention in vis-NIR spectral analyses in different domains. It is an ensemble machine-learning technique widely used for data processing but not for vis-NIR data processing. It has many advantages, such as resistance to noise, the ability to be used even when the predictor variables are higher than observations, and the suffering from small overfitting, and it assesses the variable's importance [14-16]. Accordingly, machine learning can handle nonlinear and hierarchical behaviors when introducing variability to the general spectral library for predicting samples like nutmeg. Although several studies on the use of machine learning for the analysis of spectral data like vis-NIR have been reported, to our best knowledge, no study of machine learning modeling of collected vis-NIR spectra can be found in the literature for nutmeg.
Based on the explanation above, it can be seen that no one has reported using electromagnetic waves, especially Vis-NIR, in detecting the myristicin and alpha-pinene content from Aceh nutmeg (Indonesia). Therefore, this study aims to develop a calibration model for the prediction of myristicin and alpha-pinene on Aceh nutmeg combined with the chemometric method. The chemometric practice used in this study focuses on a comparison study of the PLSR algorithm and the machine learning algorithm represented by the SVM algorithm. The results will provide information on the best harvesting periods and extraction processes based on industrial requirements. The results will give information on the myristicin and alpha-pinene content of Aceh nutmeg so that the counterfeiting of Aceh (Indonesia) nutmeg can be minimized.
2.1 Nutmeg fruits sampling
Nutmeg fruits were collected from Aceh Selatan districts, Aceh province, Indonesia, including Kluet Utara subdistrict, Kluet Tengah subdistrict, Labuhan Haji Tengah subdistrict, Labuhan Haji Timur subdistrict, Pasie Raja subdistrict, Mekek subdistrict district, Sama Dua subdistrict, Tapak Tuan subdistrict, Sawang subdistrict and Labuhan Haji Barat subdistrict. Up to 40 samples of nutmeg were collected and brought to the laboratory for spectral data collection. After the samples arrived in the laboratory, they were then cleaned and allowed to stand for one hour at a laboratory room temperature of 29.0 to 31℃. The samples were then scanned using the Vis-NIR XDS spectrophotometer. Furthermore, the sample was subjected to a destructive test to obtain reference values for myristicin and alpha-pinene using gas chromatography mass spectrometry (GC-MS).
2.2 Spectra NIR data acquisition
A Vis-NIR XDS spectrophotometer was utilized to scan spectroscopy in the length of 381 to 1065 nm at a resolution of 3 nm. Vis-NIRs were observed on the nutmeg fruit sample in the grated condition and then contained in the vial. The individual sample was acquired by averaging 32 scans. In this study, 40 spectroscopy was obtained by recording more than seven spectra per sample of nutmeg fruits. All measurements were taken at room temperature (29.0 to 31℃).
2.3 Laboratory analysis of myristicin and alpha-pinene
Myristicin and alpha-pinene was detected by gas chromatography mass spectrometry (GC-MS) (Agilent Technologies GC-MS instrument equipped with a gas chromatograph GC 7890A gas chromatograph). Data acquisition and data processing were performed using MSD Chemstation E.01.01.335 software (Agilent). Peaks were identified by comparison with myristicin and alpha-pinene by comparing their fragmentation pattern with standard mass spectra available in the instrument spectral library. The percentages of each constituent were obtained using the approach of area normalization and without the use of typical response factor modifications [17].
2.4 PLSR algorithm and machine learning algorithm
Raw NIR spectra data was treated with several techniques to achieve reliability. The treatment of spectral data used in this study aims to transform the data to make them suitable for an analysis whose activities include standard normal variate (SNV) and multiplicative scatter correction (MSC). These two types of preprocessing were chosen because, according to several research results, they showed good performance in dealing with interference from spectral data such as particle size and temperature when data acquisition, especially NIR [18-20].
In this study, 40 samples were divided into calibration datasets containing 28 samples and 12 samples for the validation samples test. Calibration models based on Vis-NIR spectra for prediction were established using enhanced spectral data. Three prediction algorithms were compared, including partial least squares regression (PLSR) and support vector machine (SVM) as a representation of the machine learning algorithm.
The chemometric analysis in this study was performed using Unscrambler software (X10.1). The model's performance was analyzed based on calibration and validation results according to the coefficient correlation of calibration, root means a square error of calibration (RMSEC), and cross-prediction (RMSEP) [21, 22]. Additionally, the prediction-to-deviation ratio (RPD) was evaluated [23].
The support vector machine is a class of algorithms distinguished by their use of kernels. In kernel-based approaches, calibration is performed in the space of non-linearly changed input data without the transformation itself. The kernel function defines the feature space as a measure of spectral similarity. Radial basis function (RBF) and polynomial function are kernel functions most often used. In RBF, three tuning parameters must be tuned, including the parameter c (penalty factor), which measures the model's resilience. The value of the c-argument must exceed 0. Gamma is a kernel parameter that specifies the scope of influence of the training sample. The high gamma suggests an immediate positive effect that can result in accurate predictions but skewed outcomes (vice versa). Parameters c and gamma must be simultaneously tuned for the RBF kernel. If gamma is large, c will have a minor effect. If gamma is low, c has the same effect on the model as on the linear model. In addition, the epsilon parameter is defined as a margin of tolerance in which errors incur no penalty.
3.1 Spectral variability
Table 1 shows the statistical data for the nutmeg fruits, including the myristicin and alpha-pinene used for model development and the amount of data set, minimum data set, maximum data set, average data set and standard deviation data set for calibration and prediction. The sample was left in the laboratory for one hour to stabilize the temperature of the nutmeg before the Vis-NIR data were acquired. The laboratory temperature at the data acquisition time ranged from 29.0 to 31℃. The nutmeg fruits samples had the widest range for myristicin with a variance of 8.92 and an average of 27.27%. In addition, the alpha-pinene content in nutmeg also has a variance of 1.69, with an average of 1.98%. The myristicin content in Aceh nutmeg is more significant than that reported by Dupuy et al. [24], who found around 1.74-12.92% myristicin content from Sulawesi, Indonesia. However, the alpha-pinene content of nutmeg from Aceh province is lower than that of nutmeg from Sulawesi, in the range of 13.18-22.80% [24].
Table 1. Summary statistics of compositional analysis data for myristicin and alpha-pinene content in the sample population
|
Constituent data |
N |
Min |
Max |
Mean |
SD |
|
|
Myristicin |
Calibration dataset |
28 |
14.97 |
41.08 |
27.27 |
8.92 |
|
Prediction dataset |
12 |
15.43 |
40.33 |
25.73 |
7.52 |
|
|
Alpha-pinene |
Calibration dataset |
28 |
0.25 |
6.30 |
1.98 |
1.69 |
|
Prediction dataset |
12 |
0.29 |
5.45 |
1.90 |
1.36 |
|
3.2 Construction of quantitative models
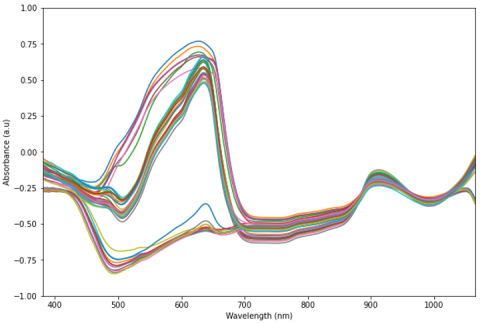
The raw spectra are in the range of 381-1065 nm, as illustrated in Figure 1, with the main positive peaks having a high absorbance variance at 627-640 nm, 915 nm and a negative peak at 480-490 nm. This spectrum confirms the existence of organic materials derived from bands that result from molecular bonds of a single bond of OH and CHO and a double bond of CO with the emitted radiation. These bonds are subjected to vibrational energy transformations in which two vibration patterns exist in these bonds, including stretch vibration and bend vibration. The peak at 627 to 640 nm was correlated with the third overtone of the single bond of OH stretching from the free OH alcohol [25]. The peak of 915 nm diffuse reflectance was correlated with the third overtone of single-link CH stretching, which led to CH2, CH3, and CH bands [26]. A negative peak in the range of 480 to 490 nm for nutmeg originating in region C, which is related to the fourth overtone of the OH stretching and a combination of the OH stretching [27].
Figure 1. Plot of raw absorbance spectra of external standard materials check cells
3.3 Calibration model for prediction myristicin
Table 2 presents the results of the performance of the PLSR algorithm and machine learning algorithm (SVM-RBF kernel) model developed from raw spectra and two methods of pre-processing data spectral for predicting myristicin in nutmeg fruits. The optimal model with the PLSR algorithm is obtained using raw spectral data using five latent variables at 381 to 1065 nm wavelengths. This model performs when calibrated with rc and RMSEC of 0.925 and 2.801%, respectively. Furthermore, when the PLSR algorithm was tested with a predictive data set, the R2, RMSE, and RPD performances were 0.853, 4.778%, and 2.068, respectively. In addition, the performance of the best SVM algorithm in the training stage measured using rc and RMSEC was 0.992 and 0.941%, respectively, in the use of data that had been preprocessed using SNV. In the testing phase with the prediction data set, R2, RMSE, and RPD were obtained at 0.986, 1.325% and 8.348, respectively. From this, it is shown that the machine learning algorithm represented by SVM performs better than the PLSR algorithm to predict myristicin content in nutmeg fruits using Vis-NIR spectra data. This is in line with several research results and adds more recent information related to the better performance of the SVM algorithm when used in spectral data analysis, especially Vis-NIR [28-30].
Using SVM improves the correlation coefficient in both the calibration and prediction phases. Consequently, the RPD index by SVM for myristicin is also better than by the PLSR algorithm. Figure 2 shows the scatter plot of the best model to estimate myristicin in nutmeg fruits from Aceh province (Indonesia) by Vis-NIR spectroscopy. The machine learning algorithm represented by SVM performs optimally when using SNV preprocessing. The search results using the “Gridsearchcv” optimization method found that the SVM kernel type radial basis function (RBF) kernel with v-SVM is the best for estimating the myristicin content in nutmeg fruits using Vis-NIR spectral data. The composition of gamma ($\gamma$), c, and nu (v) in the SVM are 0.1, 1.0, and 0.99, respectively. The composition of these hyperparameters is essential to optimize when using the SVM algorithm to make predictions [31].
Table 2. Summary of a performance model for prediction of myristicin constituent in nutmeg fruits
|
Algorithm |
LVs or Hyperparameter |
Pre-processing |
Calibration |
Prediction |
RPD |
||
|
r |
RMSE |
R2 |
RMSE |
||||
|
PLSR |
5 |
Raw* |
0.925 |
2.801 |
0.853 |
4.778 |
2.608 |
|
10 |
SNV |
0.972 |
1.748 |
0.818 |
4.007 |
2.346 |
|
|
10 |
MSC* |
0.925 |
2.801 |
0.853 |
4.778 |
2.608 |
|
|
SVM-RBF kernel |
$\varepsilon$-SVM, $\gamma$=0.01; c=10; $\varepsilon$=0.1 |
Raw |
0.991 |
0.977 |
0.863 |
3.153 |
2.697 |
|
v-SVM, $\gamma$=0.1; c=1; v=0.99 |
SNV* |
0.992 |
0.941 |
0.986 |
1.325 |
8.348 |
|
|
$\varepsilon$-SVM, $\gamma$=0.01; c=10; $\mathcal{E}$=0.1 |
MSC |
0.991 |
0.977 |
0.494 |
3.994 |
1.405 |
|
PLSR=partial least square regression; SVM-RBF=support vector machine-radial basis function; LVs=laten variables; SNV=standard normal variate; MSC=multiplicative scatter correction; r=coefficient of correlation; RMSE=root mean square error; R2=coefficient of determination; RPD=ration of performance to deviation; *=best model of each algorithm.
Figure 2. Predicted vs. measured myristicin content in nutmeg fruits using SVM models
3.4 Calibration model for prediction alpha-pinene
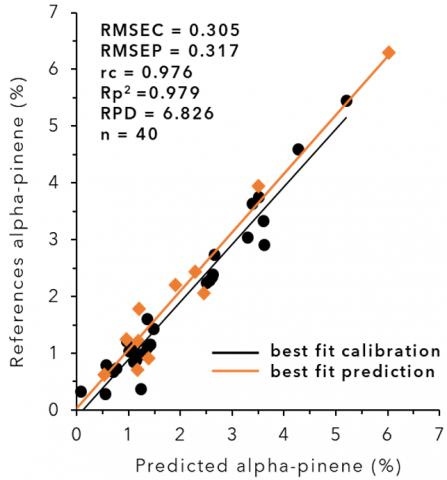
Table 3 presents the results of the performance of the PLSR algorithm and machine learning algorithm (SVM-RBF kernel) model developed from raw spectra and two methods of preprocessing data spectral to predict alpha-pinene in nutmeg fruits. The optimal model with the PLSR algorithm is obtained using raw spectral data using ten latent variables at 381 to 1065 nm wavelengths. This algorithm performs when training with rc and RMSEC of 0.850 and 0.704%, respectively. Furthermore, when the PLSR algorithm was tested with a predictive data set, the R2, RMSE, and RPD performances were 0.564, 1.212%, and 1.514, respectively. Furthermore, when using raw spectral data, the best performance of the SVM algorithm at the training stage measured with rc and RMSEC was 0.976 and 0.305%, respectively. In the testing phase with the predictive data set, R2, RMSE, and RPD were obtained at 0.979, 0.317% and 6.826, respectively. From this, it is shown that the machine learning algorithm represented by SVM performs better than the PLSR algorithm to predict the alpha-pinene content in nutmeg fruits using Vis-NIR spectra data. If it is observed from the RPD parameters in alpha-pinene estimation modeling using Vis-NIR spectral data, it has been better than the model built by Jiang et al. [32] to estimate the acid value of oil using portable NIRs.
The best model performance for alpha-pinene prediction is achieved using the SVM algorithm as a machine learning method because SVM gives the smallest RMSEC, and RMSEP also gives the highest RPD index of 6.826. The machine learning algorithm demonstrated by SVM is optimal for using a spectrum of raw data. Figure 3 shows the scatter plot of the best model to estimate alpha-pinene in nutmeg from Aceh province (Indonesia) using Vis-NIR spectroscopy. The search results using the “Gridsearchcv” optimization method found that the SVM kernel type radial basis function (RBF) kernel with e-SVM was the best for estimating alpha-pinene content in nutmeg using Vis-NIR spectral data. The compositions of gamma ($\gamma$), c, and epsilon ($\varepsilon$) in the SVM are 0.01, 10, and 0.1, respectively. This is in line with the results of Hong et al. [33], which uses the epsilon-SVM algorithm and the radial basis function (RBF) to develop models for selection for the estimation of organic matter in homogeneous soil samples by Vis-NIR spectroscopy.
Figure 3. Predicted vs. measured alpha-pinene content in nutmeg fruits using SVM models
Table 3. Summary of a performance model for prediction of alpha-pinene constituent in nutmeg fruits
|
Algorithm |
LVs or Hyperparameter |
Pre-processing |
Calibration |
Prediction |
RPD |
||
|
r |
RMSE |
R2 |
RMSE |
||||
|
PLSR |
10 |
Raw |
0.850 |
0.704 |
0.564 |
1.212 |
1.514 |
|
10 |
SNV* |
0.840 |
0.726 |
0.803 |
0.858 |
2.254 |
|
|
7 |
MSC |
0.119 |
1.364 |
0.000 |
1.658 |
1.000 |
|
|
SVM-RBF kernel |
$\mathcal{E}$-SVM, $\gamma$=0.01; c=10; $\mathcal{E}$=0.1 |
Raw* |
0.976 |
0.305 |
0.979 |
0.317 |
6.826 |
|
$\mathcal{E}$-SVM, $\gamma$=0.1; c=100; $\mathcal{E}$=0.1 |
SNV |
0.987 |
0.216 |
0.946 |
0.526 |
4.323 |
|
|
$\mathcal{E}$-SVM, $\gamma$=100; c=10; $\mathcal{E}$=0.1 |
MSC |
0.970 |
0.385 |
0.871 |
0.617 |
2.788 |
|
PLSR=partial least square regression; SVM-RBF=support vector machine-radial basis function; LVs=laten variables; SNV=standard normal variate; MSC=multiplicative scatter correction; r=coefficient of correlation; RMSE=root mean square error; R2=coefficient of determination; RPD=ration of performance to deviation. *=best model of each algorithm.
The calibration model and prediction results satisfactorily indicate that Vis-NIRs integrated with PLSR, and the machine learning algorithm can be successfully employed to predict myristicin and alpha-pinene in nutmeg fruits. The most increased correlation coefficient for myristicin prediction using SNV pre-processing was 0.992 in calibration and 0.986 in prediction, which was achieved using the SVM algorithm by RBF kernel with gamma ($\gamma$), c, and nu ($v$) of 0.1, 1.0, 0.99, respectively. SVM also provided more precise prediction results with an RPD index of 8.348. For alpha-pinene prediction, SVM is the best algorithm with the highest correlation coefficient of 0.976 in calibration and 0.979 in prediction using Vis-NIR spectral raw data. In this modeling, the SVM kernel type radial basis function (RBF) kernel with $\varepsilon$-SVM is the best with gamma ($\gamma$), c, and epsilon ($\varepsilon$) compositions of 0.01, 10, 0.1, respectively. Estimation with this model also gives an RPD index of 6.826. More studies with more spectra enhancement methods, sample varieties, different locations, and a wide range of maturity are needed to enhance the robustness of the myristicin and alpha-pinene prediction model from nutmeg. In addition, the future impact of the discovery of this predictive model is that the determination of the myristicin and alpha-pinene content of nutmeg can be carried out more quickly and inexpensively. Also, the possibility of fraud can be avoided as the economic and social impact of this nutmeg trade.
[1] Muchtaridi, Subarnas, A., Apriyantono, A., Mustarichie, R. (2010). Identification of compounds in the essential oil of nutmeg seeds (myristica fragrans houtt.) that inhibit locomotor activity in mice. International Journal of Molecular Sciences, 11(11): 4771-4781. https://doi.org/10.3390/ijms11114771
[2] Ashokkumar, K., Simal-Gandara, J., Murugan, M., Dhanya, M.K., Pandian, A. (2022). Nutmeg (myristica fragrans houtt.) essential oil: A review on its composition, biological, and pharmacological activities. Phytotherapy Research, 36(7): 2839-2851. https://doi.org/10.1002/ptr.7491
[3] Šojić, B., Tomović, V., Kocić-Tanackov, S., Škaljac, S., Ikonić, P., Džinić, N., Živković, N., Jokanović, M., Tasić, T., Kravić, S. (2015). Effect of nutmeg (myristica fragrans) essential oil on the oxidative and microbial stability of cooked sausage during refrigerated storage. Food Control, 54: 282-286. https://doi.org/10.1016/j.foodcont.2015.02.007
[4] Ansory, H.M., Sari, E.N., Nilawati, A., Handayani, S., Aznam, N. (2020). Sunscreen and antioxidant potential of myristicin in nutmeg essential oils (myristica fragrans). In 2nd Bakti Tunas Husada-Health Science International Conference (BTH-HSIC 2019), pp. 138-142. https://doi.org/10.2991/ahsr.k.200523.034
[5] Wall, M.M. Gentry, T.S. (2007). Carbohydrate composition and color development during drying and roasting of macadamia nuts (macadamia integrifolia). LWT-Food Science and Technology, 40(4): 587-593. https://doi.org/10.1016/j.lwt.2006.03.015
[6] Sitorus, A., Novrinaldi, N., Bulan, R. (2020). Non-invasive moisture content measurement system based on the ESP8266 microcontroller. Bulletin of Electrical Engineering and Informatics, 9(3): 924-932. https://doi.org/10.11591/eei.v9i3.2178
[7] Schulz, H., Quilitzsch, R., Krüger, H. (2003). Rapid evaluation and quantitative analysis of thyme, origano and chamomile essential oils by ATR-IR and NIR spectroscopy. Journal of Molecular Structure, 661-662: 299-306. https://doi.org/10.1016/S0022-2860(03)00517-9
[8] Malvandi, A., Feng, H., Kamruzzaman, M. (2022). Application of NIR spectroscopy and multivariate analysis for Non-destructive evaluation of apple moisture content during ultrasonic drying. Spectrochimica Acta Part A: Molecular and Biomolecular Spectroscopy, 269: 120733. https://doi.org/10.1016/j.saa.2021.120733
[9] Sitorus, A. Bulan, R. (2022). Development of a screening method for adulteration detection in coconut milk via mid-infrared spectroscopy: A study of linear and nonlinear regression method. Journal of Agriculture and Food Research, 10: 100438. https://doi.org/10.1016/j.jafr.2022.100438
[10] Sadergaski, L.R., Myhre, K.G., Delmau, L.H. (2022). Multivariate chemometric methods and Vis-NIR spectrophotometry for monitoring plutonium-238 anion exchange column effluent in a radiochemical hot cell. Talanta Open, 5: 100120. https://doi.org/10.1016/j.talo.2022.100120
[11] Chanda, S., Hazarika, A.K., Choudhury, N., Islam, S.A., Manna, R., Sabhapondit, S., Tudu, B., Bandyopadhyay, R. (2019). Support vector machine regression on selected wavelength regions for quantitative analysis of caffeine in tea leaves by near infrared spectroscopy. Journal of Chemometrics, 33(10): e3172. https://doi.org/10.1002/cem.3172
[12] Xu, S., Lu, B., Baldea, M., Edgar, T.F., Nixon, M. (2018). An improved variable selection method for support vector regression in NIR spectral modeling. Journal of Process Control, 67: 83-93. https://doi.org/10.1016/j.jprocont.2017.06.001
[13] Shafiee, S., Lied, L.M., Burud, I., Dieseth, J.A., Alsheikh, M., Lillemo, M. (2021). Sequential forward selection and support vector regression in comparison to LASSO regression for spring wheat yield prediction based on UAV imagery. Computers and Electronics in Agriculture, 183: 106036. https://doi.org/10.1016/j.compag.2021.106036
[14] Nawar, S. Mouazen, A.M. (2019). On-line vis-NIR spectroscopy prediction of soil organic carbon using machine learning. Soil and Tillage Research, 190: 120-127. https://doi.org/10.1016/j.still.2019.03.006
[15] Mamouei, M., Budidha, K., Baishya, N., Qassem, M., Kyriacou, P. (2020). Comparison of wavelength selection methods for in-vitro estimation of lactate: a new unconstrained, genetic algorithm-based wavelength selection. Scientific Reports, 10(1): 16905. https://doi.org/10.1038/s41598-020-73406-4
[16] Silalahi, D.D., Midi, H., Arasan, J., Mustafa, M.S., Caliman, J.P. (2020). Robust wavelength selection using filter-wrapper method and input scaling on near infrared spectral data. Sensors, 20(17): 5001. https://doi.org/10.3390/s20175001
[17] Molinet, J., Claeys-Bruno, M., Dupuy, N., Kister, J., Sergent, M. (2016). Optimization and classification of natural products by chemometric method. Analysis of gas chromatographic data of essential oils of indonesia myristica fragans houtt. Planta Medica, 82(S 01): S1-S381. http://dx.doi.org/10.1055/s-0036-1596268
[18] Dhanoa, M.S., Lister, S.J., Sanderson, R., Barnes, R.J. (1994). The link between multiplicative scatter correction (MSC) and standard normal variate (SNV) transformations of NIR spectra. Journal of Near Infrared Spectroscopy, 2(1): 43-47. https://doi.org/10.1255/jnirs.30
[19] Ely, D.R., Thommes, M., Carvajal, M.T. (2008). Analysis of the effects of particle size and densification on NIR spectra. Colloids and Surfaces A: Physicochemical and Engineering Aspects, 331(1-2): 63-67. https://doi.org/10.1016/j.colsurfa.2008.07.017
[20] Yang, J.R., Wang, J., Lu, G.D., Fei, S.M., Yan, T., Zhang, C., Lu, X.H., Yu, Z.Y., Li, W.C., Tang, X.L. (2021). TeaNet: Deep learning on Near-Infrared Spectroscopy (NIR) data for the assurance of tea quality. Computers and Electronics in Agriculture, 190: 106431. https://doi.org/10.1016/j.compag.2021.106431
[21] Suprajitno, H. (2022). Experimental analysis of training parameters combination of ANN backpropagation for climate classification. Mathematical Modelling of Engineering Problems, 9(4): 994-1004. https://doi.org/10.18280/mmep.090417
[22] Vega-Zuñiga, S., Rueda-Bayona, J.G., Ospino-Castro, A. (2022). Evaluation of eleven numerical methods for determining weibull parameters for wind energy generation in the Caribbean Region of Colombia. Mathematical Modelling of Engineering Problems, 9(1): 194-199. https://doi.org/10.18280/mmep.090124
[23] Sitorus, A., Muslih, M., Cebro, I.S., Bulan, R. (2021) Dataset of adulteration with water in coconut milk using FTIR spectroscopy. Data in Brief, 36: 107058. https://doi.org/10.1016/j.dib.2021.107058
[24] Dupuy, N., Molinet, J., Mehl, F., Nanlohy, F., Le Dréau, Y., Kister, J. (2013). Chemometric analysis of mid infrared and gas chromatography data of indonesian nutmeg essential oils. Industrial Crops and Products, 43: 596-601. https://doi.org/10.1016/j.indcrop.2012.07.073
[25] Ishiuchi, S.I., Fujii, M., Robinson, T.W., Miller, B.J., Kjaergaard, H.G. (2006). Vibrational overtone spectroscopy of phenol and its deuterated isotopomers. The Journal of Physical Chemistry A, 110(23): 7345-7354. https://doi.org/10.1021/jp060723q
[26] Thanyacharoen, T., Chuysinuan, P., Techasakul, S., Nooeaid, P., Ummartyotin, S. (2018). Development of a gallic acid-loaded chitosan and polyvinyl alcohol hydrogel composite: Release characteristics and antioxidant activity. International Journal of Biological Macromolecules, 107: 363-370. https://doi.org/10.1016/j.ijbiomac.2017.09.002
[27] Thue, P.S., Lima, E.C., Sieliechi, J.M., Saucier, C., Dias, S.L.P., Vaghetti, J.C.P., Rodembusch, F.S., Pavan, F.A. (2017). Effects of first-row transition metals and impregnation ratios on the physicochemical properties of microwave-assisted activated carbons from wood biomass. Journal of Colloid and Interface Science, 486: 163-175. https://doi.org/10.1016/j.jcis.2016.09.070
[28] Sarkar, S., Basak, J.K., Moon, B.E., Kim, H.T. (2020). A comparative study of PLSR and SVM-R with various preprocessing techniques for the quantitative determination of soluble solids content of hardy kiwi fruit by a portable Vis/NIR spectrometer. Foods, 9(8): 1078. https://doi.org/10.3390/foods9081078
[29] Dotto, A.C., Dalmolin, R.S.D., Grunwald, S., Caten, A.T., Filho, W.P. (2017). Two preprocessing techniques to reduce model covariables in soil property predictions by Vis-NIR spectroscopy. Soil and Tillage Research, 172: 59-68. https://doi.org/10.1016/j.still.2017.05.008
[30] Yang, M.H., Xu, D.Y., Chen, S.C., Li, H.Y., Shi, Z. (2019). Evaluation of machine learning approaches to predict soil organic matter and pH using Vis-NIR spectra. Sensors, 19(2): 263. https://doi.org/10.3390/s19020263
[31] Ivorra, E., Sánchez, A.J., Verdú, S., Barat, J.M., Grau, R. (2016). Shelf life prediction of expired vacuum-packed chilled smoked salmon based on a KNN tissue segmentation method using hyperspectral images. Journal of Food Engineering, 178: 110-116. https://doi.org/10.1016/j.jfoodeng.2016.01.008
[32] Jiang, H., He, Y.C., Chen, Q.S. (2020). Determination of acid value during edible oil storage using a portable NIR spectroscopy system combined with variable selection algorithms based on an MPA‐based strategy. Journal of the Science of Food and Agriculture, 101(8): 3328-3335. https://doi.org/10.1002/jsfa.10962
[33] Hong, Y.S., Chen, Y.Y., Yu, L., Liu, Y.F., Liu, Y.L., Zhang, Y., Liu, Y., Cheng, H. (2018). Combining fractional order derivative and spectral variable selection for organic matter estimation of homogeneous soil samples by VIS–NIR spectroscopy. Remote Sensing, 10(3): 479. https://doi.org/10.3390/rs10030479