Fakhriya Obead Mosa* | Abdulnasser M. Abbas
© 2022 IIETA. This article is published by IIETA and is licensed under the CC BY 4.0 license (http://creativecommons.org/licenses/by/4.0/).
OPEN ACCESS
The structural behavior of Reinforced Concrete Haunched Beams (RCHBs) was investigated in this study. One prismatic control beam and fourteen Haunched Beams (HBs) were used in the experimental test and numerical analysis. The variables considered are Recycled Concrete Aggregate (RCA) ratio which is taken as 0, 30 %, and 60 %, opening shape (square and circular with the same area of 4560 mm2), and haunch angle (α) of 6.34° and 9.46°. The samples of dimensions (1750x200x300) mm were tested under a two-point load. The samples were simulated numerically using the Abaqus/CAE tool. The experimental outcomes show that using 30% RCA decreased the resistance by 8.24% - 26.45% compared with the control sample. While at 60% RCA, the resistance decreased by 16.35% - 34.71%. HBs with α=6.34° give a strength quite close to the control beam (PN) by 1.93%, while α=9.46° decreases the strength by 12.94% compared with PN. Compared with the solid beam, square holes in HBs provide a strength reduction range of 5.83% - 18.79% for α=6.34° and α=9.46°, respectively. The beams with circular apertures have a resistance decrease of about 3.43% - 14.70%, which corresponds to α=6.34° and α=9.46°. The numerical findings were 8.41% of the experimental data.
haunched beam, recycled concrete aggregate (RCA), square openings, circle openings, finite element analysis, Abaqus software
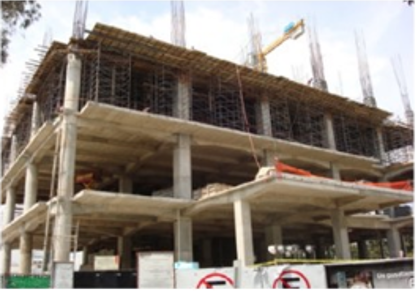
Reinforced Concrete Haunched Beams (RCHBs) are beams with varying depths along their length yet have a constant width. They are frequently used in continuous bridges, simply supported mid-rise framed buildings, and structural portal frames [1], as seen in Figure 1 The use of RCHB instead of the prismatic beam can allow for weight reduction and achieve larger spans without clearly degrading the load capacity [2]. Despite these advantages, few studies have been done so far on the behavior of RCHBs. Therefore, it is necessary to enhance the theoretical and experimental foundation for the mechanical behavior of RCHBs. However, it should be noted that the mechanical behavior and structural analysis of RCHBs differ from those of prismatic beams since the effective depth of RCHBs varies throughout their length. Debaiky and Elniema [3] conducted the first experimental study on the shear behavior of RCHBs.
Jebur [1] examined three beams: One prismatic and two Haunched Beams with varying haunch angles (α). In this work, reinforced concrete beams with different types of haunch angles and no shear reinforcement were studied. Researchers inferred that the shear strength of a beam decreases with the decrease of its depth near the support, and shear failure occurs at a 45° angle, which matches the test findings. Despite their failure in shear, Reinforced Concrete Haunched Beams appear to be more efficient compare with reinforced concrete prismatic beams, proved by Tena-Colunga et al. [4, 5]. A thicker concrete cover at the mid-span impacted the crack propagation, but it had nearly no impact on the shear capacity, according to Hou et al. [6]. As shown in research done by Tena-Colunga et al. [7, 8]. These studies have concluded that the Haunched Beams show a different cyclic shear behavior from the prismatic beams, where the Haunched Beams prefer an arching action in the length of the haunch as the main mechanism for preventing failure, which leads to smoother cracking patterns. To prevent the formation of plastic deformation in the steel bars, which would have an impact on the general behavior of the haunched reinforced concrete beams, a value of the complementary strain-energy limit is utilized to control it during the loading process proven by Rad et al. [9]. Recently, the use of Recycled Concrete Aggregate (RCA) instead of normal Aggregate (RA) in different proportions in beams to compare the shear strength of reinforced concrete has been widely studied for a variety of reasons, including being more effective, saving material, providing more height at the central span, and being more shear resistant. As shown in research done by Tabsh and Yehia [10], Fathifaz et al. [11], Pedro et al. [12], and Hamoodi et al. [13]. These studies have concluded that the use of RCA instead of RA in beams does not show major variations in mechanical or toughness between aggregates from controlled sources and those from precast rejects. According to Verian et al. [14], the use of partially saturated to fully saturated RCA, along with the appropriate mix design and mixing procedure, has been shown to increase the performance of concrete when compared to concrete batched using dry RCA. As noted by Sulaiman and Khudair [15], RCA not only reduces crack size and final loads but also results in the first crack and ultimate loading appearing earlier thanks to its lower stiffness than natural aggregate. According to Rahal and Alrefaei [16], the incorporation of recycled aggregates has been demonstrated to have less effect on beams reinforced with longitudinal and transverse reinforcement than on beams strengthened just with longitudinal rebar. The higher replacement ratio of RCA, the lower the ultimate load and the first cracking load, according to Khtar and Khudhair [17].
This article aims to evaluate the behavior of reinforced Haunched Beams made from recycled concrete aggregate with or without opening and to study the effect of inclination angle on shear strength. There are many studies on the presence of holes in all kinds of beams, and there are many studies on recycled concrete, but there is not enough presence research to connect all these effects and know most aspects of the behavior of Haunched Beams.
(a) Bridges in Lisbon, Portugal [4]
(b) Buildings [5]
Figure 1. Examples of RCHB use
2.1 Materials
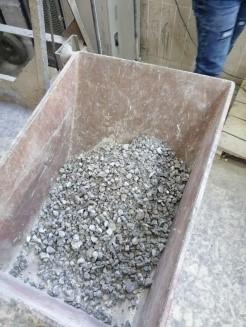
The utilized cement in this research is ordinary Portland cement (FALCON), which complies with Iraqi Specifications (5: 2019) [18]. The fine and normal course aggregate from the Jebel Sanam region in Basrah were used in the concrete mixes, and their characteristics were according to Iraqi Specifications (45: 1984) [19]. Waste materials from crushed concrete cubes were used to make recycled concrete aggregate (RCA). The RCA-graded material met the exact specifications of regular coarse aggregate in terms of particle size distribution. The rebar used in this study was manufactured in Ukraine, and the rebar of 10 mm in diameter was utilized for flexural and shear reinforcement. The concrete mixture's design has been done according to the American mix design method (ACI 211.1-91) [20] to get a compressive strength of 30 MPa (normal strength concrete). Two types of mix designs were used in this test, the first with natural coarse aggregate and the second with a recycled concrete aggregate of 0%, 30%, and 60% as a replacement for natural coarse aggregate. Where RCA was prepared through the two-stage crushing of destroyed concrete (from the pre-tested cubes), screening, and contamination removal. The technology used in the preparation of RAC is distinct from that used in the production of concrete with natural aggregate. Recycled aggregate has a noticeably higher water absorption rate than normal aggregate because of the mortar associated with it. The recycled aggregate must therefore be saturated with water before or during mixing to achieve the requisite workability of RAC. Figure 2 shows the crushing stages of RCA.
2.2 Models details
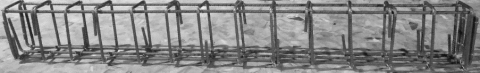
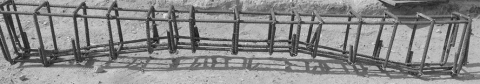
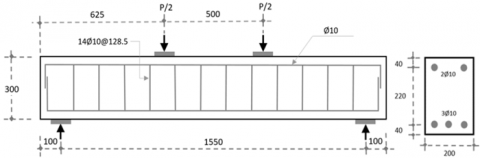
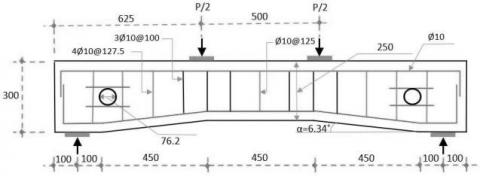
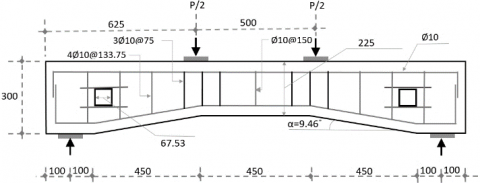
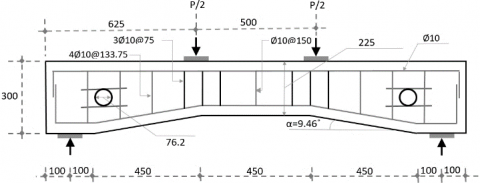
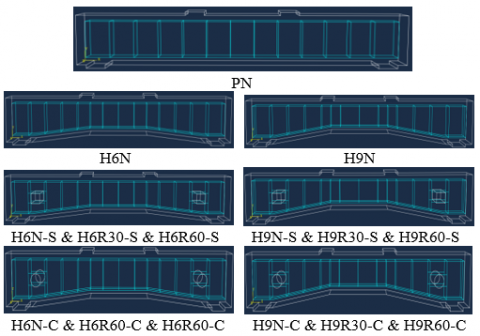
Tests were conducted on fifteen simply supported beams; see Table 1 Fourteen beam specimens were Haunched Beams, while one beam specimen employed as a prismatic (control) beam. The dimensions (length, width, and depth) of the total number of specimens were kept constant (1750 × 200 × 300 mm), and the test was conducted under a two-point load. The variables were the presence or absence of openings (square or circular), the angle of inclination of the beams (6.34°, and 9.46°), and the type of the used aggregate, Normal Aggregate (NA), and Recycled Concrete Aggregate (RCA). For a haunch angle of 6.34° and 9.46°, the vertex reinforcement space was 100 mm and 75 mm, respectively. Figures 3 a-d show details of reinforcing. All the top and bottom tension-reinforced bars (flexural) of all the tested beams, and the span and strength of concrete, were kept constant in Figure 4, beam details as well as the detail of space between the stirrups for all type of models are shown. It is essential to mention that the tested beams were designed to ensure shear failure.
Table 1. Details of Haunched Beams
|
Beam item |
Clear span (mm) |
Width (mm) |
Slope angle |
Opening shape |
Opening area (mm2) |
Aggregate type |
Stirrups |
|
|
Normal |
Vertex |
|||||||
|
PN |
1550 |
200 |
0 |
- |
- |
N |
14f 10 @ 128.5 |
|
|
H6N |
6.34° |
- |
- |
N |
4f 10 @ 127.5 for each side & 10@ 125mm in mid-span |
3f10@100 |
||
|
H6NS |
Square |
4560 |
N |
|||||
|
H6R30-S |
Square |
R30 |
||||||
|
H6R60-S |
Square |
R60 |
||||||
|
H6NC |
Circle |
N |
||||||
|
H6R30-C |
Circle |
R30 |
||||||
|
H6R60-C |
Circle |
R60 |
||||||
|
H9N |
9.46° |
- |
- |
N |
4f 10 @ 133.75 for each side & 10@ 150 mm in mid-span |
3f10@75 |
||
|
H9NS |
Square |
4560 |
N |
|||||
|
N |
||||||||
|
H9N30-S |
Square |
R30 |
||||||
|
H9N60-S |
Square |
R60 |
||||||
|
H9NC |
Circle |
N |
||||||
|
H9R30-C |
Circle |
R30 |
||||||
|
H9R60-C |
Circle |
R60 |
||||||
(1)
(2)
(3)
Figure 2. The crushing stages of RCA
(a) Prismatic beam
(b) Haunched beam (without openings)
(c) Haunched beam (with square openings)
(d) Haunched beam (with circle openings)
Figure 3. Reinforcing of the samples
(a) PN
(b) HN6
(c) H6N-S & H6R30-S & H6R60-S
(d) H6N-C & H6R30-C & H6R60-C
(e) HN9
(f) H9N-S & H9R30-S & H9R60-S
(g) H9N-C & H9R30-C & H9R60-C
Figure 4. Details of prismatic & Haunched Beams (All demotions in mm)
2.3 Experimental test
Figure 5. Space between two-point loads
Three cubes of (150 × 150 × 150) mm were tested according to ASTM (C39/39M-03) [21]. And take the compressive strength at 28 days, and it was 37.81 MPA for normal concrete aggregate, 35.71 for 30% of RCA, and 30.35 for 60% of RCA. The tests were conducted in the Basra laboratory of the civil engineering college. In the Haunched Beam test, the H-beam shaft (150 × 150 × 180) mm is employed in the universal hydraulic machine to distribute the single concentrated load (P) into the two-point load (P/2) applied with a span of 50 cm between them, as shown in Figure 5. The specimen was simply supported on a solid steel plate with a dimension of (200×100×20) mm, and the increase in load was 0.5 tons. A dial gauge is attached to the bottom of the sample at mid-span to measure the deflection proportionate to the applied force and plot the load-deflection curve as in Figure 6.
Figure 6. A dial gauge to measure the deflection
2.4 Experimental result
Table 2, illustrates the first crack load, ultimate load, and deflection are displayed based on the ultimate load.
2.4.1 The haunched beam behavior and cracking patterns
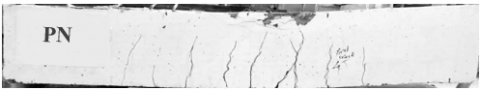
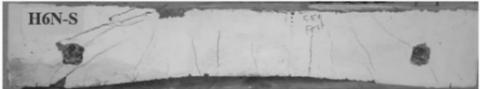
The crack has been closely monitored during the loading stages of the beams. Lines have been drawn along the crack path. After starting the loading process, shear stresses developed, and then shear cracks appeared on the sides and middle of all beams. After successive load increments on the specimens, a few small flexural cracks appeared below the beam loading area. With the gradual increase of the load, the first diagonal shear crack propagated until failure. Like the reference beam, all models exhibit almost identical cracking behavior, but for Haunched Beams with openings, other shear cracks develop in the corners of the holes. Openings in web reduce area of cross-sectional for the structural element in an affected region, which leads to a decrease in its ability to withstand loads and stiffness. It means existence of the holes in the shear area of a reinforced concrete Haunched Beam reduced its ultimate load carrying capacity, as maintained by Aksoylu et al. [22] and Abdalla et al. [23]. Figures 7 illustrate the crack pattern of some tested models. Due to the preliminary design of beams being assumed to fail in shear instead of flexure, diagonal cracks emerged before flexure cracks.
Table 2. Ultimate load and maximum deflection for models
|
Spesimans |
First cracking load (kN/m2) |
Ultimate load (KN) |
Maximum deflection (mm) |
Decrease in cracking load (%) |
Decrease in ultimate load (%) |
Decrease in Deflection (%) |
|
PN |
54 |
165 |
30.56 |
------- |
------- |
------- |
|
H6N |
52.79 |
161.81 |
18.23 |
2.24% |
1.94 |
40.35 |
|
H6N-C |
49.03 |
156.26 |
13.91 |
9.20% |
5.29 |
54.48 |
|
H6N-S |
47.58 |
152.38 |
12.22 |
11.89% |
7.65 |
60.01 |
|
H9N |
30.41 |
143.65 |
24 |
43.69% |
12.94 |
21.47 |
|
H9N-C |
28.52 |
128.21 |
21.25 |
47.19% |
22.29 |
30.46 |
|
H9N-S |
25.61 |
123.74 |
19.17 |
52.57% |
25.01 |
37.27 |
|
H6R30-C |
44.13 |
151.41 |
11.96 |
18.28% |
8.24 |
60.86 |
|
H6R30-S |
41 |
144.62 |
10 |
24.07% |
12.35 |
67.28 |
|
H9R30-C |
24 |
127.15 |
18.11 |
55.56% |
22.94 |
40.74 |
|
H9R30-S |
22.02 |
121.36 |
16.55 |
59.22% |
26.45 |
45.84 |
|
H6R60-C |
36.23 |
138.02 |
9.21 |
32.91% |
16.35 |
69.86 |
|
H6R60-S |
34.32 |
131.41 |
7.58 |
36.44% |
20.36 |
75.2 |
|
H9R60-C |
21.99 |
115.09 |
15.99 |
59.28% |
30.25 |
47.68 |
|
H9R60-S |
19.81 |
109.68 |
14 |
63.32% |
33.53 |
54.19 |
(a) Normal control beam PN
(b) Haunched beam H6N-S
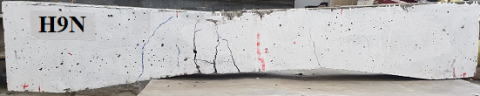
(c) Haunched beam H9N
(d) Haunched beam H9R60-S
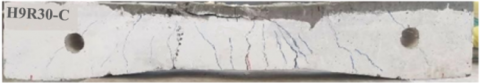
(e) Haunched beam H9R30-C
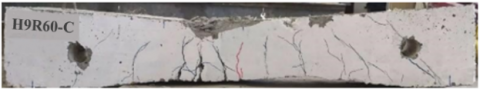
(f) Haunched beam H9R60-C
Figures 7. The crack pattern at failure for some tested beams
2.4.2 Inclination angle effect on load ultimate and deflection
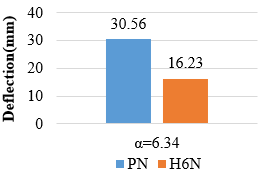
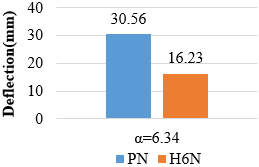
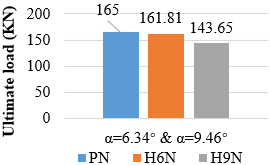
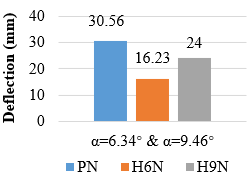
The influence of the inclination angle mainly appears on the deflection and ultimate load values of the tested Haunched Beams (HB). The deflection increases dramatically as the inclination angle (α) increases. In contrast, increasing the haunch angle (α) reduces the first shear cracking and ultimate shear load values because when the hunch angle (α) rises, the concrete volume decreases. Therefore, the shear strength decreases as well, as noted by Tena-Colunga et al. [7], see Figure 8a and b. The Haunched Beams with an angle α=6.34° have ultimate load and deflection closer to the prismatic control beam, and the decrease ratio for ultimate load and deflection was (1.94%-40.35%).
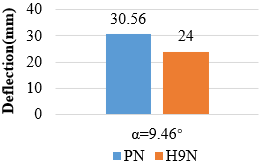
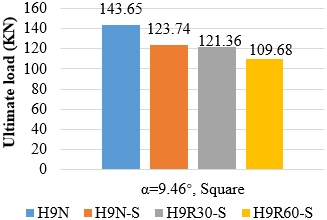
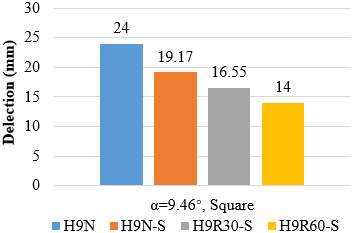
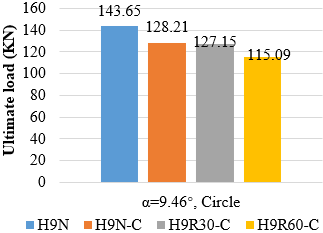
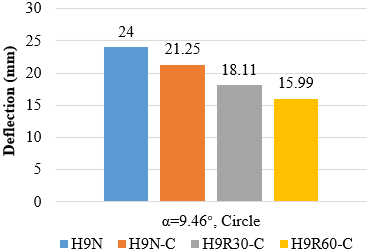
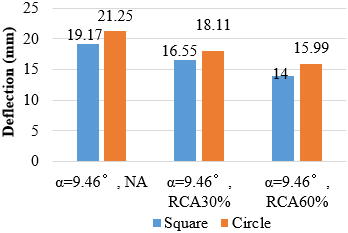
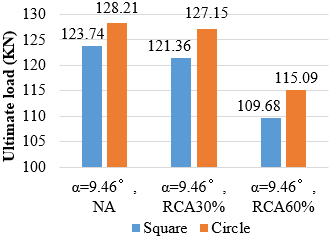
While the ultimate load and deflection for the HBs with an angle of α=9.46° is less compared with the prismatic control beam, as the decrease ratio for the ultimate load and deflection was (12.94% - 21.47%), see Figures 8c and d.
Figures 8e and f, show the comparison between α=9.46° and α=6.34°, where the divergence ratio in ultimate load was (1.94%, 12.94%) and the divergence ratio in deflection was (40.35%, 21.47%) for α=9.46° and α=6.34°, respectively. It can be noticed that in α=9.46° the ultimate load decreases while the deflection increases.
(a) Effect of α=6.34° on ultimate load
(b) Effect of α=6.34° on the deflection
(c) Effect of α=9.46° on ultimate load
(d) Effect of α=9.46°on the deflection
(e) Effect of α=6.34° & α=9.46° on ultimate load
(f) Effect of α=6.34° & α=9.46° on the deflection
Figure 8. Effect of inclination angle effect on load ultimate and deflection
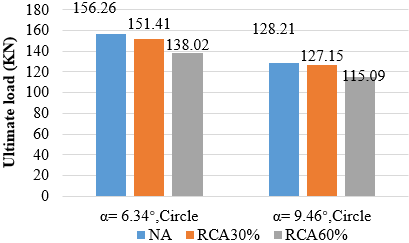
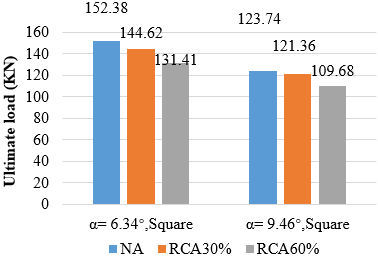
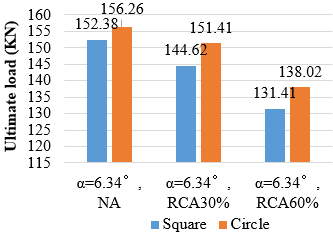
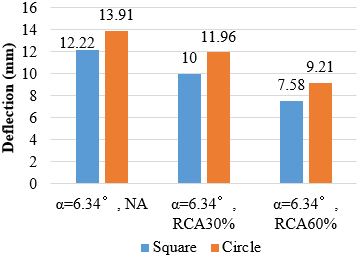
(a) RCA effect of circle opening on ultimate load and deflection for H6N-C & H6R30-C & H6R60-C & H9N-C & H9R30-C & H9R60-C
(b) RCA effect of square opening on ultimate load and deflection for H6N-S & H6R30-S & H6R60-S & H9N-S & H9R30-S & H9R60-S
Figure 9. RCA effect on ultimate load and deflection
2.4.3 RCA effect on ultimate load and deflection
The RCA ratio has a significant impact on the cracked and ultimate loads. As illustrated in Figures 9, the RCA replacement ratio increases, so do ultimate loads and cracks.
(a) Effect of square opening on load and deflection for α=6.34°
(b) Effect of circle opening on load and deflection for α=6.34°
(c) Effect of square opening on load and deflection for α=9.46°
(d) Effect of circle opening on load and deflection for α=9.46°
(e) Effect of difference opening on load and deflection for α=6.34°
(f) Effect of difference opening on load and deflection for α=9.46°
Figures 10. Effect of openings shape on load and deflection
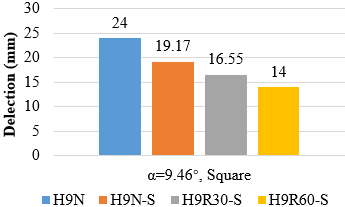
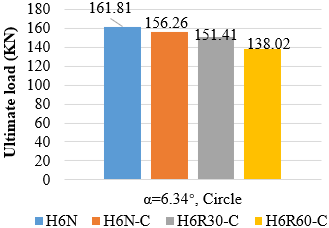
Figures 11. Effect of reinforcing the vertex on ultimate load and deflection of Haunched Beams
As compared to the final load of the prismatic sample, it was found that the ultimate load for the RCA 30 % varied between 8.24 and 26.45 %, while the final deflection varied between 18.28 and 59.22 %. Comparing the final load for RCA 60 % to the final load of the prismatic sample, the ultimate load for RCA 60 % ranged from (16.35 % - 34.71 %), while the final deflection ranged from (32.91 % - 63.32 %). The higher RCA content is responsible for the greater reduction in ultimate and cracking loads, as the existence of old mortar on RCA surfaces reduces the concrete's compressive strength. This is because RCA has a lower density than NA, which directly affects the density of the concrete mixes, as noted by Kurda et al. [24]. The decrease in concrete's compressive strength can be attributed to the increase in RCA replacement ratios. Models with 0% replacement of RCA displayed higher ultimate loads than models with 30% and 60% replacement of RCA. However, the RCA 30% replacement had minimal impact on the workability of concrete and properties of mechanical, as proved by Alsalman et al. [25].
2.4.4 The effect of the opening on load lltimate and deflection
The opening's existence in beams affected the ultimate capacity and final deflection. The ultimate load values were observed for the haunched beam without an opening to be higher than those with a square or circular opening. Twelve beam specimens were used to investigate the effect of openings in Haunched Beams. The reduction in load was calculated as a percentage using the solid haunched beam as a control. As shown in Figure 10, for Haunched Beams with α=6.34°, the reduction rate in the square opening is between (5.83% - 18.79%) and (24.71% - 53.30%) for the ultimate load and cracking, respectively. In contrast, circular openings reduced ultimate and cracking loads by (3.43% - 14.70%) and (14.29% - 43.25%), respectively. While for Haunched Beams with α=9.46°, the reduction rate in the square opening is between (13.86% - 23.65%) and (20.13% - 41.67%) for the ultimate load and cracking, respectively. In contrast, circular openings reduced ultimate and cracking loads by (10.75% - 19.88%) and (11.46% - 33.38%), respectively. The ultimate load-carrying capacity of Haunched Beams with circular openings is higher than that of square openings as described by Hafiz et al. [26].
2.4.5 The effect of reinforcing the vertex on ultimate load and deflection
The larger the haunch angle, the weaker the vertex area. As explained by Aziz et al., the number of stirrups increases the resistance and deflection increase [27], with taking into account the type of concrete and the type of reinforcement used in addition to the conditions of casting and curing. Therefore, the space between the stirrups in the vertex area was used: 100 mm for Haunched Beams with α=6.34° and 75 mm for Haunched Beams with α=9.46°. As shown in Figure 11, the reduction ratio in the haunched beam with α=6.34° was (1.93%-46.89%) and (12.94%-21.47%) in the haunched beam with α=9.46° as compared with the control beam for the ultimate load and cracking, respectively.
The Finite Element (FE) method has become a significant and versatile tool for numerical solutions to many engineering problems. The FE technique has been used for linear and nonlinear analysis of reinforced concrete structures. The Abaqus Standard version 2020 is employed to simulate the finite element model. This section outlines the Abaqus/CAE 2020 program and the necessary steps to create and analyze the beams. The FE model represents the geometry, material properties, boundary conditions, and sample meshing.
3.1 Geometry
The geometry for the Abaqus simulation was chosen to match the actual size of experimental models. Figure 12 shows the geometric representation of prismatic beams and Haunched Beams.
Figure 12. Geometric representation of prismatic beams and Haunched Beams
3.2 Material properties
Material properties must be specified for all elements. While obtaining high-quality material data might be difficult, particularly for complex material models, the accuracy and breadth of the material data impact the validity of Abaqus results. Material properties are defined by multiple input data for each element in the ABAQUS program. Materials used in this study included concrete and steel reinforcement. The following are the characteristics of each material:
3.2.1 Concrete properties
In this study, elastic and plastic behavior were used to define concrete material. For modeling the elastic behavior of NA and RCA, the parameters Poisson’s ratio (ν) and Young’s modulus (Ec) are used [28]. The CDP takes into account both isotropic compressive and isotropic tensile behavior to determine the plastic performance of concrete. Elastic properties. The Modulus of Elasticity for NA, R30 and R60 took from the Experimental Test, while the Poisson’s ratio (ν) was assumed =0.2 in this study as used by Tao and Chen [29]. The Elastic properties given in Table 3.
Table 3. The properties of elastic behavior
|
Properties |
Value |
|
|
Modulus of Elasticity |
NA |
28668 |
|
R30 |
27915.38 |
|
|
R60 |
24851.28 |
|
|
Poisson’s ratio |
0.2 |
|
Concrete damage plasticty. The CDP modeling in ABAQUS consists of plasticty, tensile behavior and compressive behavior of concrete as following:
-Plasticity: Variables of plasticity include viscosity parameter (μ), eccentricity (e), surface yielding shape (Kc) factor, the relationship between the stress of initial biaxial compression yield and the stress of initial uniaxial compression yield (σbo/σco), and (ψ) dilation angle of NA and RCA [30]. The plasticity properties given in Table 4.
Table 4. The properties of plasticity [30]
|
Concrete Damage Plasticity |
|
|
Dilation Angle |
31 |
|
Eccentricity |
0.1 |
|
fb0/fc0 |
1.66 |
|
K |
0.667 |
|
Viscosity Parameter |
0 |
-Compressive behavior: For simulating the compressive behavior of NA and RCA, the parameters Yield Stress and Inelastic Strain are used.
The inelastic hardening strain in compression is calculated using the following equation, εin,h c:
$\varepsilon^{i n, h}=\varepsilon c-\frac{\sigma c}{E 0}$ (1)
where,
εc: nominal strain.
σc: nominal compressive stress.
E0: modulus of elasticity.
-Tensile behavior: Tensile behavior contains three methods: Stress-Strain, Stress-Displacement, and Strain Fracture Energy (GFI). After trying all the methods, the GFI method was chosen to simulate the tensile behavior of NC & RC in this research because it gave is closer to the practical results than other methods. There are two determinants of the GFI method, which are Yield Stress (ft) computed by splitting test, while fracture energy (GF) was counted utilizing CEB-FIP MC 90, as shown in the following equation:
Gϝ =Gϝο ((fcm)/(fcmo))0.7 [31] (2)
The fracture energy GF, which distinguishes the stress-strain curve’s softening branch, is the fundamental parameter of tensile concrete. The aggregate sizes have an impact on the fracture characteristics of concrete [31]. Where, Gϝ fracture energy (N/mm), GFo: fracture energy base value based on the maximum aggregate size Dmax: given in Table 5; fcm: concrete compressive strength (MPa); fcmo: compressive strength, 10 (MPa).
Table 5. The Gϝο fracture energy base value based on the maximum aggregate size Dmax
|
Dmax |
[mm] |
8 |
16 |
32 |
|
GFo |
[N/mm] |
0.025 |
0.03 |
0.058 |
A tensile behavior for reinforced concrete with (0%, 30% and 60%) of RCA, used in Abaqus is registered in the Table 6.
3.2.2 Steel properties
In contrast to concrete, steel's properties can more easily be determined through a tension experiment because of its homogeneous nature. Two types of steel sections were used in this study; bar and stirrup reinforcement. These materials were defined based on the elastic and plastic properties of steel reinforcement. The two elastic parameters, elastic modulus (Es) and Poisson’s ratio (ν) are needed in the elastic stage. While only one plastic parameter, the yield stress (fy), is required in the plastic stage. Steel plates were added to the finite element model at load and support positions to produce a uniform stress distribution over the loading and support regions. Table 7 indicates the reinforcing properties.
Table 6. The tensile behavior of concrete
|
Tensile behavior of normal concrete |
Tensile behavior of RCA30% |
Tensile behavior of RCA60% |
|||
|
yield stress(ft), (MPa) |
Fracture Energy(ft), (Gϝ) |
yield stress(ft), (MPa) |
Fracture Energy (Gϝ) |
yield stress(ft), (MPa) |
Fracture Energy (Gϝ) |
|
3.32 |
0.113 |
3.19 |
0.107 |
2.75 |
0.091 |
Table 7. The properties of reinforcing
|
Properties |
Value |
|
|
Modulus of Elasticity |
NA |
28668 |
|
R30 |
27915.38 |
|
|
R60 |
24322.01 |
|
|
Poisson’s ratio |
0.3 |
|
|
fy |
420 |
|
3.3 Load and boundary conditions
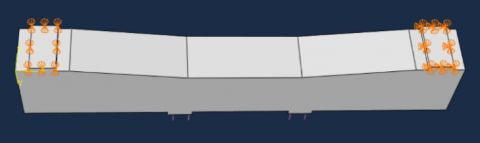
Supports and loading points are supplied by steel plates with dimensions (200x100x20) embedded into the model. The addition of loading plates will improve the load distribution across the structure. The loading plate was needed to facilitate the application of loads as point loads to the requisite nodes. Boundary conditions must be applied at sites where supports and loadings exist to guarantee that the model behaves similarly to the experimental beams. The beam's boundary condition was specified as a simply supported beam by defining one support as hinged support on one side and roller support as hinged support on one side and roller support on the other side, as shown in Figure 13.
Figure 13. Details of hinged and roller support
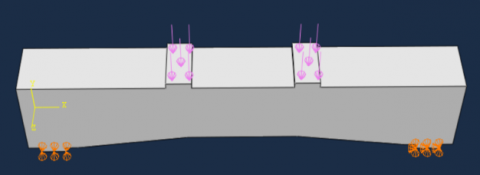
The supports are attached to the bearing plates, not directly to the concrete element. The load distribution throughout the structure improves when the loading plates are introduced. Figure 14 show the load and boundary conditions of each model.
Figure 14. Load and Boundary conditions for the models
3.4 Mesh
A rectangular mesh was utilized to get the best results from the model. The model was broken down into small elements. Since all beams had identical dimensions, the same mesh size was employed for all.
The mesh sizes employed in this study were three mesh sizes (30, 40, and 50) mm. A 30 mm mesh size gives a closer response to the load-deflection curve experimentally and is close to the mesh 40 curve. Therefore, the rest of the samples were analyzed numerical using a mesh size of 30 mm.
3.5 Numerical results
3.5.1 Ultimate load capacity and ultimate deflection
Compared to the experimental results, the findings of the nonlinear finite element analysis (FEM) of the tested beams in terms of ultimate load and deflection are discussed. Table 8 summarizes the ultimate load result and the deflections for experimental and FEM results. In this table, it is shown that the experimental results and the FE results agree well. In terms of percentage, the highest percentage divergence of the ultimate load is 8.41%, and the highest percentage divergence of deflection is 19.54%.
Table 8. Comparison between FEM and experimental for ultimate load and deflection values
|
Group No. |
Sample Name |
Ultimate load (KN) |
Decrease in ultimate load (%) |
Deflection at ultimate load (mm) |
Decrease in Deflection (%) |
|
Group1 |
PN |
165 |
------- |
30.56 |
------- |
|
H6N |
161.81 |
1.94 |
18.23 |
40.35 |
|
|
H6N-C |
156.26 |
5.29 |
13.91 |
54.48 |
|
|
H6N-S |
152.38 |
7.65 |
12.22 |
60.01 |
|
|
H9N |
143.65 |
12.94 |
24 |
21.47 |
|
|
H9N-C |
128.21 |
22.29 |
21.25 |
30.46 |
|
|
H9N-S |
123.74 |
25.01 |
19.17 |
37.27 |
|
|
Group2 |
H6R30-C |
151.41 |
8.24 |
11.96 |
60.86 |
|
H6R30-S |
144.62 |
12.35 |
10 |
67.28 |
|
|
H9R30-C |
127.15 |
22.94 |
18.11 |
40.74 |
|
|
H9R30-S |
121.36 |
26.45 |
16.55 |
45.84 |
|
|
Group3 |
H6R60-C |
138.02 |
16.35 |
9.21 |
69.86 |
|
H6R60-S |
131.41 |
20.36 |
7.58 |
75.2 |
|
|
H9R60-C |
115.09 |
30.25 |
15.99 |
47.68 |
|
|
H9R60-S |
109.68 |
33.53 |
14 |
54.19 |
3.6 Beam behavior
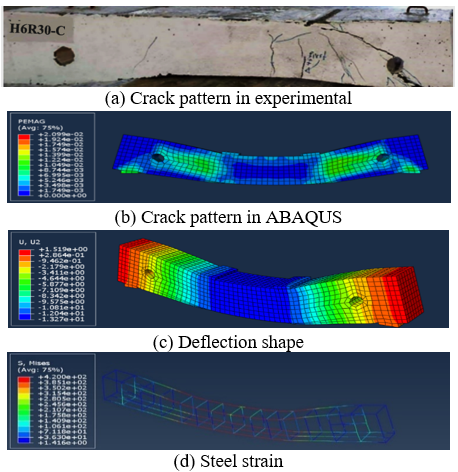
According to ABAQUS software documentation, the damage region for tension and compression is described as substations parameters that are Concrete Compression Damage (dc) and Concrete Tension Damage (dt) in the Concrete Damage Plasticity Model (CDPM). The FE findings of crack patterns in the tension face of models that modeling in ABAQUS software gives good compatibility with the crack patterns obtained from the experimental findings after failure, as shown in Figures 15-17.
Figure 15. Tension cracks for beam H6N
Figure 16. Tension cracks for beam H6N-S
Figure 17. Tension cracks for beam H6R30-C
3.7 Factors affecting beam behavior
Many factors affect the numerical simulation of the beams, such as the recycled concrete aggregate, the haunch angle, the spacing between stirrups, and the presence of openings. The use of recycled aggregate instead of ordinary aggregate affected the ultimate load. Therefore, when comparing samples with concrete mixes (the other factors remaining constant), it has been found that the final load of normal concrete was (3.26%-12.86%) greater than the ultimate load of RCA 30 samples. While the final load of RCA 60 was found to be lower than normal concrete by (15.16%-25.6%).
The difference in haunch angle also affects ultimate load, where the model with = 9.46° haunch angle is weaker than the model with α=6.34° haunch angle. For example, solid samples with normal concrete and α = 6.34° were stronger than solid samples with normal concrete and α=9.46° by 10.8% for the ultimate load.
Openings reduce the ultimate load, irrespective of the shape of the opening. Based on a comparison of samples with normal concrete, it was found that the solid samples were stronger than the samples with circular openings by 2.14% and 8% for samples with α=6.34° and samples with α=9.46°, respectively. However, the solid samples were stronger than samples with square openings by 6.7% and 23% for beams with α=6.34° and samples with α=9.46°, respectively.
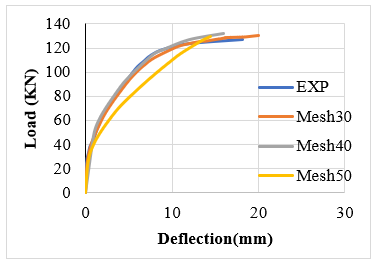
3.8 Effect of mesh size on FE analysis of beam
It has been shown in several studies that mesh size affects the accuracy of findings obtained using FE Analysis in several studies. By varying element size and type, Liu et al. [32] obtained different results. Figures 18 show a comparison between three mesh sizes: 30, 40, and 50.
As mentioned earlier, it is clear from the graph of these models that a 30 mm mesh size gives a closer response to the load-deflection curve experimentally and is close to the mesh 40 curve. Therefore, the rest of the samples were analyzed numerically using a mesh size of 30 mm.
(a) PN
(b) H9R30-C
Figures 18. Load-Deflection curve for different mesh sizes
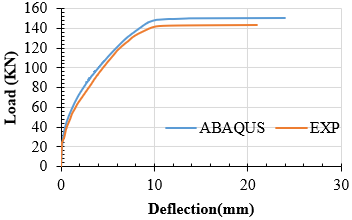
3.9 Load-deflection curve
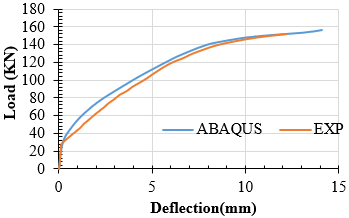
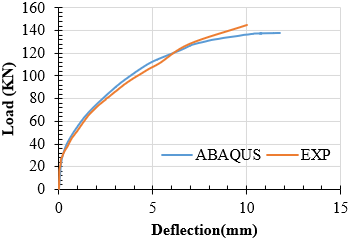
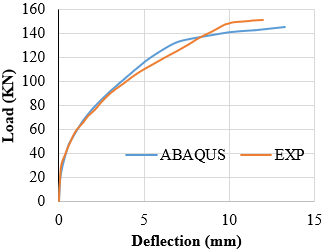
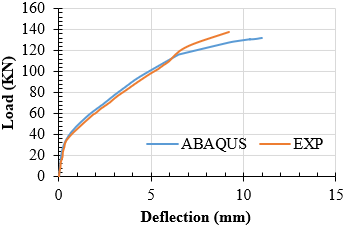
The value of the mid-span deflection is measured at each load step, and the load versus deflection curves are plotted. During the entire loading process, all specimens pass through three behavior stages. The load mid-span deflection response behaves linearly during the first stage. The load increments rose gradually until the first cracking load. Therefore, the specimens remain elastic, and no visual cracks appear in the samples at this stage. However, when the second stage begins, diagonal and flexure cracks occur in the shear and flexure zones, and the curve shifts from linearity to nonlinearity behavior. Since this occurs as the load increases, the deflection rate is continuously rising with the load. Finally, in the third stage (failure stage), as an applied load reaches the vicinity of its ultimate value, deflections are increasing at a faster rate than the applied loads are increasing, thus causing samples to fail. The load-deflection responses of the current FE analysis and experimental findings are shown in Figures 19. As observed in these figures, the curves show a remarkable convergence between the FE and the experimental outcomes.
(a) H6N
(b) H9N
(c) H6N-S
(d) H6R30-S
(e) H6R30-C
(f) H6R60-C
Figures 19. Comparison between the FEM and experimental response to load-deflection
The conclusions drawn from the experimental and numerical results are as follows:
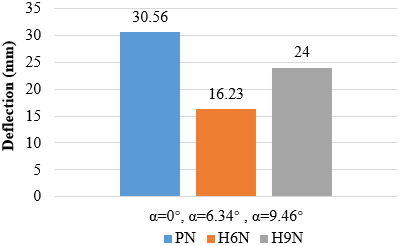
1. The decrease of inclination angle led to increasing the beam strength, prismatic control beam had more ultimate load and deflection from the solid hunched beam with a haunch angle of 6.34° by (1.02%) and (1.68%) respectively, while the solid hunched beam with a haunch angle of 9.46° by (1.15%) and (1.27%) respectively.
2. The ratio of increase in ultimate load and deflection of the model with normal concrete compared with the model with RCA 30 (regardless of inclination angle and opening shape) was (1.01-1.05) and (1.16-1.22), respectively. The ratio of increase in ultimate load and deflection was (1.11-1.16) and (1.33-1.61) compared with the model with RCA 60.
3. Based on comparisons of solid Haunched Beams (6.34° and 9.46° inclination angle models) with Haunched Beams with openings of the same angle, the ultimate load ratio ranged between 1.04% and 1.31%, while the deflection ratio was (1.13%-2.41%).
4. By comparing the Haunched Beams containing circular openings with the Haunched Beams containing square openings, the circular opening gave an ultimate load and deflection higher than the square opening by (1.03%-1.05%).
5. By comparing the control beam with all Haunched Beams, the reduction ratio of the ultimate and cracking load in the haunched beam with α = 6.34° (100 mm space between the stirrups in the vertex area) was (1.2% - 1.26%) respectively, and (1.15% - 1.5%) in the haunched beam with α = 9.46° (75 mm space between the stirrups in the vertex area) for the ultimate load and cracking, respectively.
6. In Abaqus, it was found that the final load of samples with normal concrete was (1.03%-1.13%) greater than the final load of samples with RCA 30%, while the final load of samples with normal concrete was (1.15%-1.26%) greater than the final load of samples with RCA 60%.
7. For the ultimate load in numerical analysis, solid samples with normal concrete and α = 6.34° were stronger than solid samples with normal concrete and α = 9.46°.
8. The solid samples in Abaqus were stronger than the samples with circular opening by a ratio of (1.02%-1.24%) and (1.08%-1.19%) for samples with α =6.34° and samples with α =9.46°, respectively, while they were stronger than the samples with square opening by (1.07%-1.31%) and (1.16%-1.34%).
9. The numerical findings were 8.41% of the experimental data.
ABAQUS is a very accurate program that must have a good knowledge of all its aspects before use and choose the appropriate analysis methods for implementation.
|
N |
normal aggregate |
|
R |
recycled concrete aggregate |
|
fb0 |
the stress of initial biaxial compression yield |
|
fc0 |
the stress of initial uniaxial compression yield |
|
Kc |
surface yielding shape factor |
|
E0 |
modulus of elasticity |
|
Gϝ |
fracture energy |
|
GFo |
the base value of Gf and depends on the maximum aggregate size of Dmax |
|
fcm |
concrete compressive strength (MPa) |
|
fcmo |
compressive strength, 10 (MPa) |
|
e |
eccentricity |
|
Greek symbols |
|
|
εc |
nominal strain |
|
σc |
nominal compressive stress |
|
α |
haunch angle |
|
μ |
viscosity parameter |
|
Ψ |
dilation angle |
[1] Jebur, H.S. (2021). Nonlinear finite element analysis of Reinforced Concrete Haunched Beams without shear reinforcement under static shear load. In Advances in Civil Engineering and Infrastructural Development, pp. 77-89. https://doi.org/10.1007/978-981-15-6463-5_9
[2] Naik, P.K., Manjunath, M. (2017). Pushover analysis of multi-storey frame structure with haunched beam. International Journal of Trend in Research and Development, 4(3): 333-336.
[3] Debaiky, S.Y., Elniema, E.I. (1982). Behavior and strength of Reinforced Concrete Haunched Beams in shear. In Journal Proceedings, 79(3): 184-194. https://doi.org/https://doi.org/10.14359/10896
[4] Tena-Colunga, A., Urbina-Californias, L.A., Archundia-Aranda, H. I. (2017). Shear behavior of continuous Reinforced Concrete Haunched Beams subjected to cyclic loading. In Memorias, 16th World Conference on Earthquake Engineering, Santiago Chile, pp. 3242.
[5] Tena-Colunga, A., Urbina-Californias, L.A., Archundia-Aranda, H.I. (2018). Cyclic shear response of continuous Reinforced Concrete Haunched Beams. In Eleventh US National Conference on Earthquake Engineering (11 NCEE), Los Angeles, California.
[6] Hou, C., Matsumoto, K., Niwa, J. (2015). Shear failure mechanism of Reinforced Concrete Haunched Beams. Journal of JSCE, 3(1): 230-245. https://doi.org/10.2208/journalofjsce.3.1_230
[7] Tena-Colunga, A., Archundia-Aranda, H.I., González-Cuevas, Ó. M. (2008). Behavior of Reinforced Concrete Haunched Beams subjected to static shear loading. Engineering Structures, 30(2): 478-492. https://doi.org/10.1016/j.engstruct.2007.04.017
[8] Tena-Colunga, A., Archundia-Aranda, H.I., Grande-Vega, A. (2013). Behavior of Reinforced Concrete Haunched Beams subjected to cyclic shear loading. Engineering Structures, 49: 27-42. https://doi.org/10.1016/j.engstruct.2012.10.037
[9] Rad, M.M., Ibrahim, S.K., Lógó, J. (2022). Limit design of Reinforced Concrete Haunched Beams by the control of the residual plastic deformation. In Structures, 39: 987-996. https://doi.org/10.1016/j.istruc.2022.03.080
[10] Tabsh, S.W., Yehia, S. (2018). Shear strength of reinforced concrete beams made with recycled aggregate. In Proceedings of the World Congress on Civil, Structural, and Environmental Engineering, Budapest, Hungary, Budapest, Hungary, pp. 8-10. https://doi.org/10.11159/icsenm18.130
[11] Fathifazl, G.B.B.S., Razaqpur, A.G., Isgor, O.B., Abbas, A., Fournier, B., Foo, S. (2009). Shear strength of reinforced recycled concrete beams without stirrups. Magazine of Concrete Research, 61(7): 477-490. https://doi.org/10.1680/macr.2008.61.7.477
[12] Pedro, D., De Brito, J., Evangelista, L. (2014). Influence of the use of recycled concrete aggregates from different sources on structural concrete. Construction and Building Materials, 71: 141-151. https://doi.org/10.1016/j.conbuildmat.2014.08.030
[13] Hamoodi, A.Z., Chkheiwer, A.H., Kadim, J.A. (2021). Shear Strength of Reinforced Recycled Aggregate Concrete Corbels. Journal of Engineering, 2021: 6652647. https://doi.org/10.1155/2021/6652647
[14] Verian, K.P., Ashraf, W., Cao, Y. (2018). Properties of recycled concrete aggregate and their influence in new concrete production. Resources, Conservation and Recycling, 133: 30-49. https://doi.org/10.1016/j.resconrec.2018.02.005
[15] Sulaiman, E.A.S.E.A., Khudair, J. (2020). Effect of using recycled concrete aggregate on behavior of RC corbels cast with self-compacting concrete (experimental and analytical study). Kufa Journal of Engineering, 11(1): 1-21. https://doi.org/10.30572/2018/KJE/110101
[16] Rahal, K.N., Alrefaei, Y.T. (2018). Shear strength of recycled aggregate concrete beams containing stirrups. Construction and Building Materials, 191: 866-876. https://doi.org/10.1016/j.conbuildmat.2018.10.023
[17] Khtar, A.K., Khudhair, J.A.S. (2019). Experimental study of the shear strength of self compacting concrete t-beams made with recycled concrete as coarse aggregate. University of Thi-Qar Journal, 14(1): 31-52.
[18] Iraqi Standard No. 5: Portland Cement. (2019). Baghdad, Iraq: Central Organization for Standardization and Quality Control.
[19] Iraqi Specifications for Aggregates of Natural Resources used for Concrete and Construction. (1984). Baghdad, Iraq.
[20] A Committee (2002). ACI 211.1-91. Standard Practice for Selecting Proportions for Normal, Heavyweight, and Mass Concrete, no. 9, Unites States, pp. 120-121.
[21] A Standard. (2005). C39/C39M, Standard test method for compressive strength of cylindrical concrete specimens. ASTM International.
[22] Aksoylu, C., Özkılıç, Y.O., Madenci, E., Safonov, A. (2022). Compressive behavior of pultruded GFRP boxes with concentric openings strengthened by different composite wrappings. Polymers, 14(19): 4095. https://doi.org/10.3390/polym14194095
[23] Abdalla, H.A., Torkey, A.M., Haggag, H.A., Abu-Amira, A.F. (2003). Design against cracking at openings in reinforced concrete beams strengthened with composite sheets. Composite Structures, 60(2): 197-204. https://doi.org/10.1016/S0263-8223(02)00305-7
[24] Kurda, R., de Brito, J., Silvestre, J.D. (2018). Indirect evaluation of the compressive strength of recycled aggregate concrete with high fly ash ratios. Magazine of Concrete Research, 70(4): 204-216. http://dx.doi.org/10.1680/jmacr.17.00216
[25] Alsalman, A., Khudair, J., Kareem, R., Assi, L., Dang, C., Martí-Vargas, J.R. (2022). Examining mechanical properties of recycled aggregate concrete. In Proceedings of 2nd International Multi-Disciplinary Conference Theme: Integrated Sciences and Technologies, IMDC-IST 2021, Sakarya, Turkey. http://dx.doi.org/10.4108/eai.7-9-2021.2314894
[26] Hafiz, R.B., Ahmed, S., Barua, S., Chowdhury, S.R. (2014). Effects of opening on the behavior of reinforced concrete beam. IOSR Journal of Mechanical and Civil Engineering, 11(2): 52-61. https://doi.org/10.9790/1684-11275261
[27] Aziz, A.H., Hassan, H.F., Razzaq, F.M.A. (2016). Experimental study on shear behavior of reinforced self-compacted concrete tapered beams. Civil and Environmental Research, 8(8): 11-22.
[28] Lubliner, J., Oliver, J., Oller, S., Oñate, E. (1989). A plastic-damage model for concrete. International Journal of solids and structures, 25(3): 299-326. https://doi.org/10.1016/0020-7683(89)90050-4
[29] Tao, Y., Chen, J.F. (2015). Concrete damage plasticity model for modeling FRP-to-concrete bond behavior. Journal of composites for construction, 19(1): 04014026. https://doi.org/10.1061/(ASCE)CC.1943-5614.0000482
[30] Hafezolghorani, M., Hejazi, F., Vaghei, R., Jaafar, M.S. B., Karimzade, K. (2017). Simplified damage plasticity model for concrete. Structural Engineering International, 27(1): 68-78. https://doi.org/10.2749/101686616X1081
[31] Taerwe, L. (2008). Constitutive modelling of high strength/high performance concrete: State-of-art report. Fédération internationale du Béton (FIB).
[32] Liu, W.B., Gheni, M., Yu, L. (2011). Effect of mesh size of finite element analysis in modal analysis for periodic symmetric struts support. In Key Engineering Materials, 462: 1008-1012. https://doi.org/10.4028/www.scientific.net/KEM.462-463.1008