Cordelia Onyinyechi Omodero* | Philip Olasupo Alege
© 2022 IIETA. This article is published by IIETA and is licensed under the CC BY 4.0 license (http://creativecommons.org/licenses/by/4.0/).
OPEN ACCESS
Most major rising economies are seeing a rise in health problems as a result of airborne smog caused by carbon dioxide discharges. The situation in Nigeria is getting too concerning, as the expense of healthcare services continues to rise as a result of environmental problems. The purpose of this research is to determine the extent to which investments in healthcare and social welfare have altered Nigeria's carbon footprint. Dependent variable in this study is CO2 emissions captured by the World Bank Development Indicators in metric tonnes, whereas the independent variables are public healthcare spending and social welfare cost. The data for these variables are kept in the Central Bank of Nigeria Statistical Bulletin from 2006 to 2020. Several statistical tests are being used in the study to confirm model stability, appropriateness, and normalcy. As a consequence, the unit root is validated at the level, and additional diagnostic tests show that the multiple regression model used in this work is free of distortion, serial correlation, and hetroskedacity. As a result, the data reveal that the predictor factors have a substantial and positive correlation with Nigeria's carbon footprint. Further data show that healthcare costs have a considerable and beneficial influence on carbon footprint, but social welfare spending is insignificant in this regard. The report recommends the use of green technologies to minimize carbon emissions and enhance the overall health of the population. As a solution, both people and the government's health-care costs will be significantly reduced in the absence of air pollution.
public health, air pollution, green environment, government investment, social welfare
Health care investment is becoming an integral ingredient in both advanced and emerging economies to enhance quality of healthcare of the entire universe. The rising public health cost is associated with carbon footprint in most emerging nations especially in Nigeria. Health is one of the most essential variables in determining people's quality of life since a healthy society is a vital component of long-term economic success. As part of the Maintainable Enlargement Objectives, the World Health Organization published a plea for universal health insurance, emphasizing that every citizen, regardless of financial means, must have equitable access to health care services [1]. To achieve so, governments must allocate a larger proportion of public health financing to ensure that everyone has access to health care without prejudice and that everybody's entitlement to medical services is fulfilled [1]. Environmental health, social position, economic development, and environmental quality are only a few of the aspects that might have a waves on the person's excellence of natural life [2]. Giving the extant literature, air pollution causes multiple negative health effects and welfare costs that have an influence on long-term socioeconomic development and human evolution [3, 4]. As air quality and the environment deteriorate, the demand for medical spending grows in order to ensure a healthy living [5]. New analysis by [6, 7] also indicates that climate variability is altering the typical behaviors of both animals and plants within their environments, with both beneficial and detrimental consequences, even though in most circumstances the implications are harmful to human health.
The current COVID-19 global health disaster, for example, is assumed to have a wide range of ecological roots [8-10]. Air pollution, high temperatures, and other meteorological conditions can all contribute to nosocomial infection [11-13]. Scientists are adamant that if certain initiatives of managing the carbon output like CO2 are not implemented, the CO2 content of the atmosphere would touch 0.1 percent by the start of 22nd epoch, which is twofold as plentiful as it was earlier than the industrialized uprising [14]. The current warming generated by CO2 secretions and further conservatory fumes will also create weather alterations, which will have a severe influence on social fitness. Scientists think that the increase in CO2 and endothermic gases like varieties of industrial fumes are to be held accountable for the rise in earth's surface temperature. IPCC [15] observes that the middling superficial hotness of the Globe has climbed by 1.5 points Celsius since the 1880s. Because of extremely people's poor wellbeing, numerous Nigerians are especially vulnerable to natural disasters. There may occur in a number of circumstances. Several of the instant repercussions of physiological responsiveness include mortality, strokes, illness, and injuries as a result of rising temperatures storm experience, as well as effects on various organs and tissues. Modifications in the incidence and spreading of vector-borne disorders (such as plasmodium) and alterations in the virus transmission are two indirect outcomes of global temperature rise.
Environmental health is reciprocal in 2 directions: Environmental elements that influence human health and human pursuits that impact on ecological integrity [16]. Greenhouse smoke releases have demonstrated a major predictor of health cost. CO2 is the most influential of all GHG gases, followed by carbon monoxide [17]. Hazes productions are miasma emissions created by the burning of relic energies and industries for the duration of the development of energy producing products [18]. Gangadharan and Valenzuela [19] discovered that a declining climate negatively affect health pointers. By examining 125 nation, it was observed that GHG emissions considerably increase health-care expenses [20]. Since typical weather variation is essentially a healthiness issue, understanding how wellbeing upkeep contributes to the smog footmark is supportive [21].
Consequently, the response of carbon footprints to a nation’s healthcare costs may vary significantly. Designing an adaptive medical system to fight the rising medical consequences of environmental devastation is crucial for various governments. Several growing societies, like Nigeria, seek to create a strong welfare state, yet rising healthcare expenditure consumes a big amount of their revenue. This is the first study to investigate the intensity of carbon dioxide pollution and the possibility for government investment on health and social welfare to ameliorate the impact of pollution saturation on human life in a developing country. Climate change complexities need this empirical research, which emphasizes the significance of a robust fiscal strategy for social welfare in the face of health-harming environmental threats. Therefore, this study scrutinizes the waves of Nigeria’s healthcare overheads on haze footprints in the country. This research supports SDGs 3, 13, and 15.
Li et al. [14] applied the Fourier ARDL method to study the link between BRICS healthcare costs, Carbon intensity, and GDP changes from 2000 to 2019. In the near run, there was a severe causative association across India's Emissions of smog and healthiness spending, with medical expenditure and cost-effective progress as predictor factors; other countries showed only an each link between smoke discharges, healthiness payments, or job prosperity. In a further study, Bayar et al. [22] evaluated the power of environs, longevity expectation, and real Gross domestic product on health care costs in a sampling of 27 EU member states from 2000 to 2018 using causation and variance decomposition analyses. The causativeness breakdown found a noteworthy autonomous causation between carbon dioxide productions, life span, and real GDP per capita and health costs. The co-integration study revealed that mortality rate and actual GDP per capita had a momentous beneficial influence on overall health expenses. The counteraction study revealed that lifecycle expectation and real GDP per capita had a momentous beneficial influence on well-being disbursements across the board. On the other hand, the nation state side by side counteraction factors exposed that average lifespan had a significant affirmative bearing with well-being overheads, real GDP per capita had a modest optimistic impression on healthiness incidentals in most of the nations in the panel, but the surroundings, as denoted by carbon dioxide discharges, had a low detrimental effect on healthcare costs in a handful of countries.
Bilgili et al. [23] investigated the link between municipal and private health care investment, fiscal development, and contamination in 36 Asian nations from 1991 to 2017. The quantile regression upshots demonstrated that unrestricted and sequestered healthiness payments had a significant impact on decreasing CO2 at the 50th and 75th quantiles, but not at the 25th. Overall, the analysis found that in cooperation municipal and secluded health-care funding lowered CO2 emissions in Asia, with the commercial health-care sector having a greater negative impact on CO2 emissions than the public health-care sector. Odhiambo [24] investigated the cause - effect relationship between the quality budget and industrial progress using cross sectional data from Sub-Saharan African countries from 2008 to 2017. Using a panel ECM-based Granger-causation model, the researchers observed that when state spending is used as a substitute, there is a discrete vertical link from healthcare costs to industrial prosperity in poor states, but no connectedness occurs in intermediate ones. Conversely, when private medical consumption is used, a relatively brief correlation from productivity expansion to healthcare costs is seen in top half economies, but no coherence is shown in Baltic States.
Rahman and Alam [25] investigated the relationship flanked by well-being prominence, healthiness disbursement, power usage, and ecological challenges in the SAARC-BIMSTEC states from 2002 to 2017. The discoveries exhibited that there were favorable and had weighty impacts. The measurement of ecological fumes is 0.085, meaning that environmental pollution has a considerable detrimental influence on the health condition of these locations in the long run. In the short run, however, no panel-wise substantial influence was discovered. There were also underlying linkages discovered between the factors analyzed and healthiness position.
Ganda [26] examined the impact of medical spending on fog discharges in BRICS nations from 2000 to 2017. The causation studies demonstrated bi-directional causality between contemporary wellbeing spending, private health spending, and domestic general government health spending and greenhouse output. In standings of summative fitness spending, the amount of current health spending was strongly and adversely related to carbon emissions. In terms of differentiated factors, private health spending was likewise shown to be adversely and strongly related to emissions. Local overall administration healthiness spending and foreign health spending were shown to be positively and substantially related to carbon pollution.
From 1995 to 2014, Alimi et al. [5] investigated the association between environmental quality and medical care cost in 15 ECOWAS countries. Three estimators were used to generate the empirical evidence: pooled OLS, fixed effects, and system GMM. According to empirical evidence, carbon emanations had a weighty encouraging control on both unrestricted and coast-to-coast wellness expenditures, however there appears to be no connection between ecological toxic waste and private healthiness prices. Ibukun and Osinubi [27] revealed in their research that higher health expense is attributable to poor ecosystems. Sasana et al. [18] looked at the influence of ecological dilapidation, demography, and economic factors on administration wellbeing spending from 1995 to 2014. For the inquiry, multiple regression was used as an analytical tool. The findings revealed that enlarged regime expenditure on health care was caused by population variables, such as an increase in the number of old individuals, as well as environmental issues, such as greenhouse gas emissions. Wang et al. [2] applied data from 1975-2017 to look at the connection between healthiness expense, fumes as well as wealth increase in 18 OECD. They used the bootstrap autoregressive-distributed lag (ARDL) cointegration model. Cointegration was discovered in the Netherlands when real GDP per capita was used as a reliant factor, in New Zealand when health spending was used as a response element, and in the United States when CO2 emissions were used as a dependent variable. The three factors had a short-run association. Bidirectional causation existed between health spending and GDP growth in Germany and the United States, as well as between coal emanations and Productivity growth in Canada, Germany, and the United States, as well as between health expenditure and haze releases in New Zealand and Norway. The findings also revealed that unidirectional causation existed in other nations.
Zaidi and Saidi [28] estimated the link between health spending, air contamination agents, and pecuniary development in Sub-Saharan African countries from 1990 to 2015. In the study, the ARDL estimation technique was employed to model the long and short term. The VECM Granger interconnection test was also used to assess the direction of causation. To begin, the ARDL test findings showed that monetary progress had a constructive stimulus on healthiness costs, but CO2 emissions and Nitrous oxide emissions had a harmful impression on fitness overheads in the elongated term. Malik et al. [21] examined the Australian health-care system's economic input–output lifecycle. The study disclosed that expenditure on heathcare management was increasingly high annually due to high level of fumes. Sirag et al. [1] investigated the link between health financing, CO2 emissions, and population health in 35 Sub-Saharan African nations from 1995 to 2012. The empirical approaches showed noteworthy results. The study's discoveries demonstrated the significance of municipal wellbeing sponsoring as one of the primary elements that lead to improved condition, but secluded spending was found to be detrimental to public health since it increased the under-5 death rate. Yahaya et al. [20] discovered a long-run beneficial influence of fog release components and returns per capita on healthiness outflows by means of compiled figures from 125 emerging economies. However, nitrous oxide and sulfur dioxide had diminutive upshot on per capita well-being overheads in poor homelands in the near run.
Throughout the academic evidences observed in this research, several socio - economic thresholds, which include: power usage, Nox, demographics, job prosperity, and people' health condition, among others, might impact healthcare spending in diverse countries. Mineral wealth, industrialization, increased trade, and Gasses all raise healthcare cost, according to researchers’ findings. Furthermore, there is a causative response link between economic boom and welfare spending. The relevant literature provides rare glimpse into the determinants of healthcare spending, such as affluence, industrialization, environmental assets, and Carbon intensity. As a consequence, in Nigeria, with a population density of 216 million, we analyze the link between medical costs and its crucial component (CO2). Other researchers’ position on the effect of welfare and medical spending on fumes are not well highlighted. Furthermore, oil and natural gas extraction created health risks due to the various toxins discarded of at quarry sites, which has not received the attention it needs in relation to human health. As top of the regular novelty of this assessment, the present study distinguishes itself by providing an intense evaluation of the cumulative effects of health costs and social assistance cost on reducing pollution in Nigeria within the structure of sophisticated forecasting approaches such as correlational analysis and regression method.
The study considers the power of community health overheads on carbon footprint in Nigeria using data from 2005 to 2020. The dependent variable is the CO2 emission in metric tonnes and the data are gathered from the World Bank Expansion Pointers. Due to the need to examine the weight of CO2 output on health cost of the society, we have employed the public health expenditure and the cost of general social welfare of the society. These data are in the archive of the Central Bank of Nigeria Statistical Bulletin. The study used natural log to express the figures for accurate analysis. Thus, the model for the study can be expressed as follows:
$\ln \mathrm{CO}_2=\mathrm{f}(\ln \mathrm{HLT}, \ln \mathrm{WLF})$ (1)
where, ln signifies the natural log, CO2 represents greenhouse gas emissions, HLT stands for public health expenditure and WLF is the cost of general social welfare of the society. Thus, lnCO2 is the dependent variable while the independent variables include investment in health (lnHLT) and social welfare (lnWLF). CO2 is the proxy for the carbon footprint while government investments in medical care and social welfare are proxied by HLT and WLF respectively.
An alternate relapse in which a response element has a rectilinear linking with numerous self-determining components denoted as compound relapse. Compound undeviating reversion is based on the proposition that the reliant element and every of the self-regulating factors have a linear relationship. Second, the data should not show signs of multicollinearity, which occurs when the independent factors (explanatory variables) are substantially related. In this situation, the variance inflation factor (VIF) is employed to establish whether or not multicollinearity exists. Third, multiple linear regression assumes that the quantity of noise variance is comparable at each point of the linear model. This is known as homogeneity of variance. Fourth, the model implies that the observations are unrelated to one another. That is, the residual values are autonomous. The Durbin Watson statistic is used to test for this hypothesis. The analysis conveniently available scale from zero to 4, with values 0 to 2 suggesting positive autocorrelation and values 2 to 4 showing negative autocorrelation. The midline, a value of 2, implies that no recurrence exists.
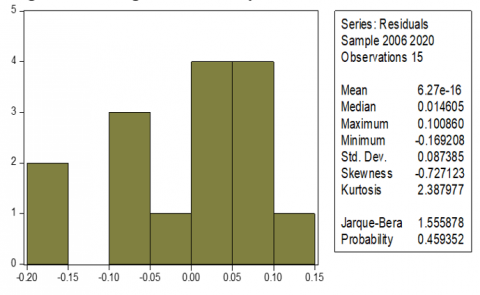
Finally, there is the assumption of normal data distribution. When residuals are regularly distributed, multivariate normality arises. Scrutinize the sharing of left over values to put this assumption to the test. It may also be checked using one of two methods: a histogram with a put on top usual curve or a Jarque Bera p-value larger than 5% threshold of significance. The second approach is the Normal Probability Plot. Everything is dependent on the program used.
The multiple regression formula applied in this study is as shown below:
$Y=a+b_1 X_1+b_2 X_2+\ldots+b_k X_k+e$ (2)
where, Y is the reliant factor and X connotes the autonomous factors. It's worth noting that we have k independent variables, each with its own slope. There is still one error term and one intercept. Again, the aim is to find a and b estimates that minimize the total of squared errors in estimation. The following formula is applied for the two variable case:
$b_1=\frac{\left(\sum x_2^2\right)\left(\sum x_1 y\right)-\left(\sum x_1 x_2\right)\left(\sum x_2 y\right)}{\left(\sum x_1^2\right)\left(\sum x_2^2\right)-\left(\sum x_1 x_2\right)^2}$
$b_2=\frac{\left(\sum x_1^2\right)\left(\sum x_2 y\right)-\left(\sum x_1 x_2\right)\left(\sum x_1 y\right)}{\left(\sum x_1^2\right)\left(\sum x_2^2\right)-\left(\sum x_1 x_2\right)^2}$ (3)
The significant level of the p-value is stated at 0.05. Thus, at 5% level of significance, the t-test result will be significant while above this threshold will be considered insignificant. In this study, we employ the multiple regression method and correlation analysis to elucidate the impact of health care and social welfare costs on carbon footprint. The relationship is explained by associating a very weak relationship to a correlational value of 00 – 19 percent; weak to 20 – 39 percent; moderate relationship is from 40 – 59 percent; while strong relationship is attributed to values from 60 – 79 percent and very strong relationship is associated with values from 80 and above.
Table 1 shows the result of unit root test. This study makes use of time series data spanning from 2006 to 2020, thus is assumed that the regression result may be misleading if unit root test is not conducted to establish the firmness of the dataset. The unit root test is the test that helps the researcher to confirm the stability of a dataset intended for use in a study.
The group unit root test conducted for this research is displayed in Table 1, the result indicates that all datasets are stationary at level, thereby justifying the use of ordinary least squares multiple regression method.
Table 1. Group unit root test: Summary
|
Series: LN_CO2, LN_HTH, LN_WFR |
||||
|
Sample: 2006 2020 |
||||
|
Method |
Statistic |
Prob.** |
Cross- sections |
Obs |
|
Null: Unit root (assumes common unit root process) |
||||
|
Levin, Lin & Chu t* |
-4.02848 |
0.0000 |
3 |
42 |
Researchers’ computation, 2022
As indicated in Table 2, the datasets are also examined for stability, autocorrelation or serial correlation, variance errors, and multicollinearity. The criterion for serial correlation is that if the p-value exceeds 5%, it indicates that there is no out of order connection in the model. As a result, the serial correlation value is 0.93, which is more than 0.05, indicating that there is no serial correlation. Table 4 gives a Durbin-Watson value of 1.89, which is roughly 2. As a result, it confirms that autocorrelation is not present in the model used for this investigation. The study also demonstrates that the model is devoid of variance errors, which might occur in the presence of heteroskedacity. Again, with the VIF of 3.15 which is less than 4 [29] and less than 10 [30], it is obvious that multicollinearity is absent in the model.
Table 2. Diagnostic test
|
Type |
P-value |
Predictor Variables |
Variance Inflation Factor (VIF) |
|
Ramsey RESET Test |
0.36 |
lnHTH |
3.15 |
|
Breusch-Godfrey Serial Correlation LM Test |
0.93 |
lnWFR |
3.15 |
|
Heteroskedasticity Test: Pagan-Godfrey |
0.98 |
|
|
Authors’ calculation, 2022
Figure 1. Histogram normality test
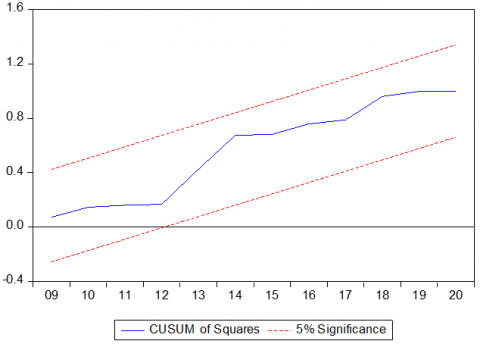
Figure 2. Robustness test
The Histogram normality test is used in this work to assess the normal distribution of the datasets (see Figure 1). The most important statistic is the Jarque-Bera p-value, which is greater than 5% and suggests that the datasets are normally distributed. The model's robustness is tested using CUSUM of Squares in Figure 2, which reveals that the model is robust and stable. This is seen by the presence of the azure stroke between the dual dotted reddened streaks denoting the 5% boundaries.
Table 3. Correlation analysis
|
Sample: 2006 2020 |
|
||
|
Included observations: 15 |
|
||
|
Correlation |
|
|
|
|
t-Statistic |
|
|
|
|
Probability |
LN_CO2 |
LN_HTH |
LN_WFR |
|
LN_CO2 |
1.000 |
|
|
|
LN_HTH |
0.849 |
1.000 |
|
|
|
5.801 |
... |
|
|
|
0.000 |
... |
|
|
LN_WFR |
0.634 |
0.826 |
1.000 |
|
|
2.959 |
5.292 |
... |
|
|
0.011 |
0.000 |
... |
Authors’ calculation, 2022
Table 3 shows that health care spending and CO2 pollution have a very strong link, which is established at 85 percent with a p-value of 0.00, which is considerably below the 5% degree of importance. The policy conclusion is that CO2 contaminants have significantly contributed to Nigeria's health problems, hence raising the country's healthcare costs. Second, the cost of social assistance has a strong association with CO2 emissions. That is, the relationship between social welfare and haze is found to 63 percent at a p-value of 0.01 which is below 0.05 (see Table 3). This means that the government spends a lot of money to keep the environment clean, yet the pollution is rather severe. As a result, significant efforts are directed on mitigating the impacts on humans. Furthermore, social welfare has a very significant and positive relationship with healthcare spending as indicated in Table 3. As shown in Table 3, the relationship is 83 percent and the p-value is 0.00. This value is below 0.05 percent and reflects a very strong relationship between social cost and medical cost. The meaning is that both social welfare commitments of the government and healthcare services work together to sustain the society. Nevertheless, the environmental pollution ultimately increases the investments in both heath care services and societal welfare.
Table 4. Regression analysis
|
Method: Least Squares |
|
|
||
|
Sample: 2006 2020 |
|
|
||
|
Included observations: 15 |
|
|
||
|
Variable |
Coefficient |
Std. Error |
t-Statistic |
Prob. |
|
LN_HTH |
0.303941 |
0.078143 |
3.889539 |
0.0022 |
|
LN_WFR |
-0.035492 |
0.043979 |
-0.807010 |
0.4354 |
|
C |
3.245857 |
0.252438 |
12.85804 |
0.0000 |
|
R2 |
0.735715 |
Mean dependent var |
4.631519 |
|
|
Adjusted R2 |
0.691667 |
S.D. dependent var |
0.169981 |
|
|
S.E. of relapse |
0.094387 |
Akaike info criterion |
-1.705980 |
|
|
Sum2 resid |
0.106906 |
Schwarz criterion |
-1.564370 |
|
|
Log likelihood |
15.79485 |
Hannan-Quinn criter. |
-1.707488 |
|
|
F-statistic |
16.70274 |
Durbin-Watson stat |
1.886943 |
|
|
Prob(F-statistic) |
0.000341 |
|
|
|
Authors’ calculation, 2022
According to Table 4, healthcare costs have a large beneficial influence on CO2 emissions. As a result, environmental quality has been damaged, leading to a number of health conditions that have resulted in high medical costs for both people and the government. In the impact test, the welfare cost is small; nonetheless, the F-statistic demonstrates that both healthcare investment and social welfare costs have a combined effect on CO2 emissions. That is, the government's two primary capital expenditures work together to tackle the country's environmental pollution. The F-statistic p-value also signposts that the prototypical used in this work is highly adequate and statistically significant. The standard error of regression, 0.09, indicates that the model prediction is devoid of preconception.
Physical wellness is a universal social possession; nonetheless, current and earlier contagions and outbreaks have emphasized the need for a worldwide rethinking of a variety of health-related concerns. Due to various witlessness and a lack of sufficient thoughtfulness of numerous healthiness connected elements such as power, surroundings, community and cloistered fitness costs, cleanliness, and cleanliness, the globe is currently undergoing a major peal on vigor and life cycle (Rahman & Alam, 2021) [25]. Health-care facilities have been found to be deficient in numerous areas, increasing health-related difficulties. As a result, delivering improved medical amenities for the societies in order to develop a safer society has now become a top policy priority across the world. The positive and highly significant relationship between CO2 pollutants and investment in medical services demonstrates that pollution has led to a number of health issues in the country, thereby increasing medical expenses. Furthermore, the cost of social assistance is strongly related to CO2 emissions, indicating that the government is investing heavily in reducing the environmental hazards produced by pollution in order to avert the loss of lives and biodiversity.
The result of this study shows that green technology is required to overcome environmental pollution in the society. Green technology will help to reduce healthcare and social welfare costs because it guaranteed clean environment and air free pollution. This is the only way the climate change effects can be reduced for the sake of humans and the sustainability of the ecosystem. The report advocates for legislation that would allow organizations to explore renewable energy, which will benefit the environment and lower pollution levels. In light of this idea, government entities are urged to adhere to the conditions of universally achievable sustainable objectives. Furthermore, organizations and households should be urged to follow all national and district-level environmental standards. Policymakers should make an effort to evaluate and implement environmental rules from other countries that, if accepted, may enhance the country's surroundings.
llution problems are multiplying and harming human dwellings and existence [31]. Notwithstanding the factual data shown in the literature review section, numerous emerging economies continue to reject aggressive ecological approach. In pursuit of economic recovery, these emerging nations place significant strain on natural resources (such as freshwater, farmland, and forests), and their increased output encourages higher Carbon outputs and industrial by - products. Based on the results of this study, public health spending improves ecological integrity and is closely linked to pollution reduction. The spending on social assistance is not proportional to the degree of contamination. Because of the poor public health, numerous Nigerians are especially vulnerable to climate change [32]. Therefore, this study further stresses that, policymakers should implement measures that minimize carbon output and, as a result, promote public health and performance. The report also advises that environmentally friendly technology and supplies, such as sustainable power, be employed in the manufacturing system; while medical investment on a federal budget be raised. Therefore all citizens should have access to safe water and basic proper sanitation. As a result, authorities could set targets for growth and prosperity, which should enhance community health care spending while maintaining and enhancing air protection. Both the industry and government should address regulating the budget and access to medical facilities by focusing on ecologically responsible healthcare administration, hospital structures, improper disposal, and the use of solar and wind power for power. This will minimize both their financial load and carbon pollution.
The authors appreciate the scholars whose works served as a guide to the development of this current study. We sincerely thank Covenant University Ota, Ogun State, Nigeria for the sponsorship of this research.
[1] Sirag, A., Mohamed Nor, N., Law, S.H., Abdullah, N. M.R., Lacheheb, M. (2017). The impact of health financing and CO2 emission on health outcomes in Sub-Saharan Africa: A cross-country analysis. GeoJournal, 82(6): 1247-1261. https://doi.org/10.1007/s10708-016-9749-4
[2] Wang, C.M., Hsueh, H.P., Li, F., Wu, C.F. (2019). Bootstrap ARDL on health expenditure, CO2 emissions, and GDP growth relationship for 18 OECD countries. Frontiers in Public Health, 7: 324. https://doi.org/10.3389/fpubh.2019.00324
[3] Ganda, F. (2022). The environmental impacts of human capital in the BRICS economies. Journal of the Knowledge Economy, 13(1): 611-634. https://doi.org/10.1007/s13132-021-00737-6
[4] Owusu, P.A., Sarkodie, S.A. (2020). Global estimation of mortality, disability-adjusted life years and welfare cost from exposure to ambient air pollution. Science of the Total Environment, 742: 140636. https://doi.org/10.1016/j.scitotenv.2020.140636
[5] Alimi, O.Y., Ajide, K.B., Isola, W.A. (2020). Environmental quality and health expenditure in ECOWAS. Environment, Development and Sustainability, 22(6): 5105-5127. https://doi.org/10.1007/s10668-019-00416-2
[6] World Health Organization. (2016). Ambient Air Pollution: A Global Assessment of Exposure and Burden of Disease. https://apps.who.int/iris/bitstream/handle/10665/250141/9789241511353-eng.pdf?sequence=1, accessed on 22 September, 2022.
[7] Zeng, J., He, Q. (2019). Does industrial air pollution drive health care expenditures? Spatial evidence from China. Journal of Cleaner Production, 218: 400-408. https://doi.org/10.1016/j.jclepro.2019.01.288
[8] Hamid, S., Mir, M.Y., Rohela, G.K. (2020). Noval coronavirus disease (COVID-19): A pandemic (Epidemiology, Pathogenesis and potential therapeutics). New Microbes and New Infections, 35: 100679. https://doi.org/10.1016/j.nmni.2020.100679
[9] Paital, B. (2020). Nurture to nature via COVID-19, a self-regenerating environmental strategy of environment in global context. Science of the Total Environment, 729: 139088. https://doi.org/10.1016/j.scitotenv.2020.139088
[10] Zhu, L., Liu, X., Huang, H., et al. (2020). Meteorological impact on the COVID-19 pandemic: A study across eight severely affected regions in South America. Science of the Total Environment, 744: 140881. https://doi.org/10.1016/j.scitotenv.2020.140881
[11] Méndez-Arriaga, F. (2020). The temperature and regional climate effects on communitarian COVID-19 contagion in Mexico throughout phase 1. Science of the Total Environment, 735: 139560. https://doi.org/10.1016/j.scitotenv.2020.139560
[12] Sarkodie, S.A., Owusu, P.A. (2021). Global assessment of environment, health and economic impact of the novel coronavirus (COVID-19). Environment, Development and Sustainability, 23(4): 5005-5015. https://doi.org/10.1007/s10668-020-00801-2
[13] Tosepu, R., Gunawan, J., Effendy, D.S., Lestari, H., Bahar, H., Asfian, P. (2020). Correlation between weather and Covid-19 pandemic in Jakarta, Indonesia. Science of the Total Environment, 725: 138436. https://doi.org/10.1016/j.scitotenv.2020.138436
[14] Li, F., Chang, T., Wang, M.C., Zhou, J. (2022). The relationship between health expenditure, CO2 emissions, and economic growth in the BRICS countries—based on the Fourier ARDL model. Environmental Science and Pollution Research, 1-20. https://doi.org/10.1007/s11356-021-17900-w
[15] IPCC. (2018). The Intergovernmental Panel on Climate Change (2018). Reports, Global Warming of 1.5℃. https://www.ipcc.ch/sr15/
[16] Pona, H.T., Duan, X.L., Ayantobo, O.O., Tetteh, N.D. (2021). Environmental health situation in Nigeria: current status and future needs. Heliyon, 7(3): e06330. https://doi.org/10.1016j.heliyon.2021.e06330
[17] Murshed, M., Mahmood, H., Alkhateeb, T.T.Y., Banerjee, S. (2020). Calibrating the impacts of regional trade integration and renewable energy transition on the sustainability of international inbound tourism demand in South Asia. Sustainability, 12(20): 8341. https://doi.org/10.3390/su12208341
[18] Sasana, H., Kusuma, P., Setyaningsih, Y. (2019). The impact of CO2 gas emissions on government expenditure of health sector in Indonesia. In E3S Web of Conferences, p. 04004. https://doi.org/10.1051/e3sconf/20191250 ICENIS 2019 4004 4004
[19] Gangadharan, L., Valenzuela, M.R. (2001). Interrelationships between income, health and the environment: Extending the Environmental Kuznets Curve hypothesis. Ecological Economics, 36(3): 513-531. https://doi.org/10.1016/S0921-8009(00)00250-0
[20] Yahaya, A., Nor, N.M., Habibullah, M.S., Ghani, J.A., Noor, Z.M. (2016). How relevant is environmental quality to per capita health expenditures? Empirical evidence from panel of developing countries. SpringerPlus, 5(1): 1-14. https://doi.org/10.1186/s40064-016-2505-x
[21] Malik, A., Lenzen, M., McAlister, S., McGain, F. (2018). The carbon footprint of Australian health care. The Lancet Planetary Health, 2(1): e27-e35. https://doi.org/10.1016/S2542-5196(17)30180-8
[22] Bayar, Y., Gavriletea, M.D., Pintea, M.O., Sechel, I.C. (2021). Impact of environment, life expectancy and real GDP per capita on health expenditures: Evidence from the EU member states. International Journal of Environmental Research and Public Health, 18(24): 13176. https:// doi.org/10.3390/ijerph182413176
[23] Bilgili, F., Kuşkaya, S., Khan, M., Awan, A., Türker, O. (2021). The roles of economic growth and health expenditure on CO2 emissions in selected Asian countries: A quantile regression model approach. Environmental Science and Pollution Research, 28(33): 44949-44972. https://doi.org/10.1007/s11356-021-13639-6
[24] Odhiambo, N.M. (2021). Health expenditure and economic growth in sub-Saharan Africa: An empirical investigation. Development Studies Research, 8(1): 73-81. https://doi.org/10.1080/21665095.2021.1892500
[25] Rahman, M.M., Alam, K. (2021). The nexus between health status and health expenditure, energy consumption and environmental pollution: Empirical evidence from SAARC-BIMSTEC regions. BMC Public Health, 21(1): 1-12. https://doi.org/10.1186/s/2889-021-11534-w
[26] Ganda, F. (2021). The impact of health expenditure on environmental quality: The case of BRICS. Development Studies Research, 8(1): 199-217. https://doi.org/10.1080/21665095.2021.1955720
[27] Ibukun, C.O., Osinubi, T.T. (2020). Environmental quality, economic growth, and health expenditure: empirical evidence from a panel of African countries. African Journal of Economic Review, 8(2): 119-140.
[28] Zaidi, S., Saidi, K. (2018). Environmental pollution, health expenditure and economic growth in the Sub-Saharan Africa countries: Panel ARDL approach. Sustainable Cities and Society, 41: 833-840. https://doi.org/10.1016/j.scs.2018.04.034
[29] Garson, G. (2012). Testing statistical assumptions. Asheboro, NC: Statistical Associates Publishing.
[30] Gujarati, D.N., Porter, D.C. (2009). Basic econometrics (5th Ed.). Boston: McGraw-Hill Irwin. ISBN 978-0-07-337577-9.
[31] Omodero, C.O., Alege, P.O. (2022). Government Expenditure fiscal delegation and environmental quality: A study of Nigeria. International Journal of Sustainable Development and Planning, 17(3): 949-955. https://doi.org/10.18280/ijsdp.170325
[32] Omodero, C.O. (2022). Environmental taxation and public health issues. International Journal of Design & Nature and Ecodynamics, 17(1): 131-136. https://doi.org/10.18280/ijdne.170117