Catur Harsito* | Ariyo Nurachman Satiya Permata | Zainal Arifin
© 2022 IIETA. This article is published by IIETA and is licensed under the CC BY 4.0 license (http://creativecommons.org/licenses/by/4.0/).
OPEN ACCESS
Air conditioning systems have become very important at the end of this decade, due to global warming. Comfortable room conditions require a good air conditioning system. This paper aims to investigate the effect of the velocity inlet on central air conditioning. The boundary condition design was made using computer-aided design software. The temperature distribution was investigated numerically. The use of a central air conditioner with 12 inlet diffuser at a velocity of 0.7 m/s produces an even temperature distribution. The condition of the effective draft temperature produced is between -3 to 2 by 75% at an inlet velocity of 0.7 m/s. Meanwhile, at the inlet speed of more than 1m/s, the room temperature is met below 15℃. Thus, even temperature distribution and a suitable effective draft temperature can save energy consumption.
air distribution, inlet velocity, CFD, effective draft temperature
The increase in global temperature caused by global warming has an impact on the increasing use of air conditioning systems in the room. This system resulted in an increase in world energy consumption by 40% of the total world energy consumption [1]. On the other hand, the depletion of energy sources and increasingly stringent energy policies encourage research to be carried out related to energy creation and energy saving [2-6]. Air conditioning is a knowledge that discusses how to create a room in it into a controlled state. Environmental conditions have changed significantly, making air conditioners not a luxury anymore. In tropical and subtropical countries, cooling by using air conditioning is an important capability of development to achieve a comfortable environment. Thermal comfort is a state of mind that expresses satisfaction with the thermal environment [7]. Thermal comfort can be achieved by considering the right air conditioning system. This system is intended to get air that is always comfortable through a treatment process by adjusting temperature, humidity, cleanliness, and air distribution simultaneously to achieve it. With comfortable air conditions, the activities in the room will be effective and efficient.
One of the main demands of a building is to provide a comfortable environment for its occupants. In modern industrial civilization, humans spend most of their lives in indoor environments. In a long time, this has led to an increasing number of hobbies in analyzing the influence of indoor climate. Affordable thermal weather can be provided by cooling indoor air through several approaches that increase occupant productivity. A higher air temperature inside a building can reduce the productivity of its occupants and increase the air pressure inside the building. In poultry houses, better temperatures reduce feed consumption, weight gain and egg yield. All these factors require cooling of indoor air in hot climate zones. Air conditioning is one way to create a comfortable indoor climate by lowering the air temperature, especially in arid areas. In general, 20-26℃, 50-60% RH is the recommended comfort situation [8]. This can be achieved by using an air conditioning system.
Air conditioning systems contribute greatly to the excessive use of energy in most buildings. It is the process of making a room reach the appropriate temperature and humidity levels of comfort according to the requirements of a particular room. The overall performance of the air conditioning system is displayed and compared to avoid unnecessary waste of energy [9-11].
Air conditioning is a way of conditioning indoor air for specified thermal comfort. Air conditioning is an equipment, tool or system designed to maintain the temperature and humidity of the air in an area. It is used for cooling as well as heating, depending on the air temperature at a given time, generally using a cooling cycle. Sometimes, evaporative cooling is used for cooling in buildings and motor vehicles [1, 12, 13].
Studies related to the visualization of air flow and temperature in the air conditioning system were carried out using numerical methods as predictions of real conditions [14, 15]. The computational fluid dynamics investigation in the bedroom has been carried out by Ning et al. consider the position of the inlet height with respect to the bed. The lowest inlet position shows the most maximum results with overall airflow distribution [16].
Most air conditioning devices use a vapor compression system or vapor absorption device. The potential can also vary from a few kilowatts to megawatts. The vapor compression refrigeration cycle is widely used for indoor air situations because of its better performance. The working fluid used in the vapor compression cycle is referred to as refrigerant, which absorbs heat from the refrigerated space and is dissipated in the heat supply.
Therefore, it is necessary to develop a modern air conditioning system to meet the conditions of comfort needs. As the importance of cooling and air conditioning is increasing every day, it may be desirable to take a look at thermal comfort in various environmental situations.
This study aims to investigate the air conditioning system in the mosque room using computational fluid dynamics (CFD) with central air conditioning configuration. Indoor comfort and cooling performance are affected by the amount of warm or cold air supplied. The evaluation was carried out using standard indices: temperature, velocity distribution, airflow pattern, and effective draft temperature (EDT).
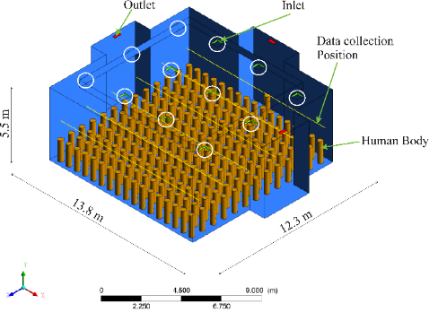
In this study using a numerical method to model the air flow and temperature that occurs in the mosque room with several conditions. The mosque room is modeled using a central conditioning system which is supported by using 12-nozzle ducting (inlet), the position is above and evenly distributed. The dimensions are 13.8*12.3*5.5 meters and configuration of the conditioning used in the mosque room are shown in Figure 1, the diffuser model used is shown in Figure 2.
Figure 1. Boundary conditions
Figure 2. Square diffuser [45°]
In this study, we investigate the performance of air distribution with variations in inlet velocity. In addition, the cooling load limit conditions are configured on the walls as well as the presence of a heat source from the human body of 222 people. The human body is simulated by setting a wall area that shows the human body by adding properties according to Table 1 and providing input of 5 Watt/m2. This condition describes the condition of the mosque being filled with worshipers with physical distance conditions. This inlet speed is varied from 0.1 – 9 m/s. The material properties used in the simulation are shown in Table 1.
Table 1. Properties of boundary conditions
|
Material |
k [W/m K] |
ρ [kg/m3] |
Cp [J/kg K] |
|
Brick wall [17] |
0.811 |
1820 |
880 |
|
Human body [18] |
0.61875 |
10.3875 E-4 |
3.34125 |
|
Air |
0.0244 |
1.225 |
1006.43 |
2.1 Simulation procedures
Based on the results of calculations and direct surveys, the mosque building was modeled in 3D using the Solidworks application. The results of the 3D modeling of the mosque can be seen in Figure 1. In the 3D modeling process, then the file is saved in the extension (.IGS) to be imported into ANSYS Software.
Designs that are successfully made in 3D are then imported into the ANSYS Workbench Software. The steps to enter the 3D design that has been made into ANSYS are carried out as follows. (Fluid Flow (Fluent) à Geometry à Import File Geometry). It is used as a way to create boundary conditions that control the volume environment for the simulation case. The boundary conditions in this simulation are walls, human body, and air.
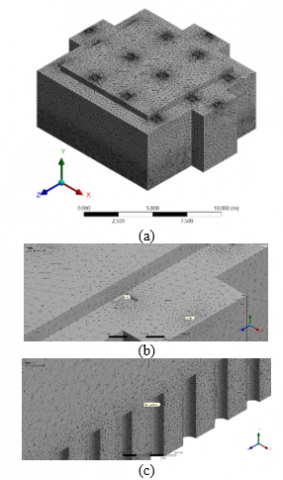
The meshing process is carried out as an indicator of the accuracy of a simulation process. The appropriate amount of meshing will result in a more accurate simulation. In this research, the making of grid meshing is done using ANSYS-Meshing interface. The resulting grid network has a high quality with a total of 4,762,157 elements in the room domain and also around the input and output airflow. The basis for determining the number of grids or the quality of the meshing is to re-simulate similar cases, the quality of the meshing results from the re-simulation of similar cases is used as a reference to determine the meshing in this study. Figure 3 shows the results of the mesh in the area around the room, while the inlet, outlet and human body areas have a smoother grid. This meshing method is used to produce illustrations of real conditions.
Figure 3. Meshing detailed; (a) room, (b) inlet and outlet, (c) human body
For the simulation, the parameter settings used to describe the situation are close to the real conditions. Setting the air velocity out of the air conditioner (varied 0.1-9 m/s), room temperature (24℃), inlet temperature (7℃), outlet temperature, human body temperature (see on Table 1), and wall properties (see Table 1).
At the end, the simulation process is completed by configuring the inlet speed of the Central AC system with 12 diffusers. Air conditioning is seen in the value of the effective draft temperature. In addition, it also considers the thermal comfort factor according to ASHRAE.
Simulation results with variations of predetermined parameters produce differences in effective draft temperature, temperature contour patterns and flow velocity patterns. The presentation of the simulation results is presented in the section below.
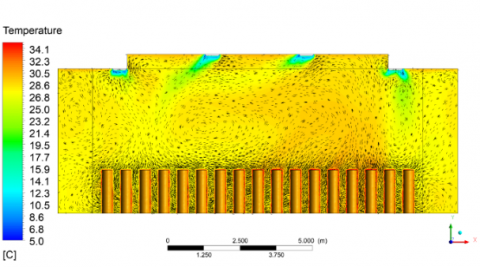
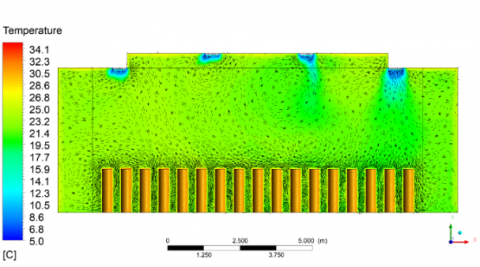
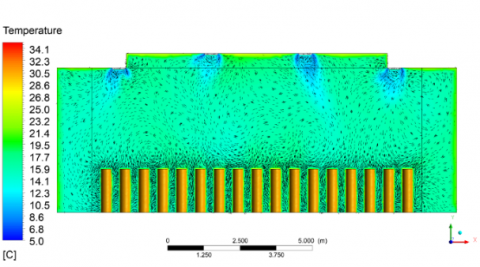
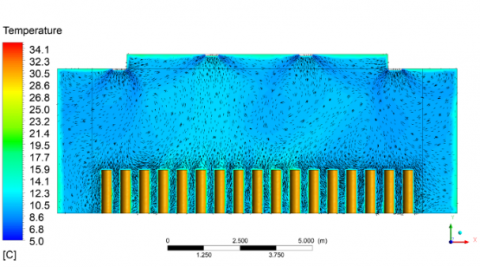
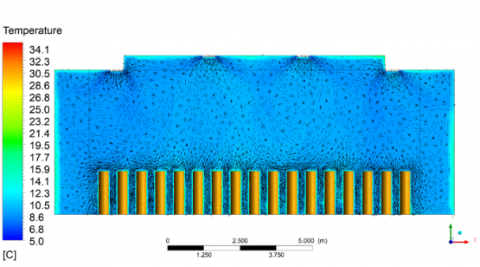
The results of the temperature distribution can be seen in Figure 4. The inlet velocity of the diffuser affects the uniformity of the resulting room temperature. Based on the temperature distribution pattern shown in Figure 4a with inlet velocity 0.1 m/s, the mosque room has a very high room temperature, which exceeds 34℃. At the 0.3m/s inlet velocity variation the room temperature shows the ambient temperature 28-30℃. Simulation with an inlet velocity configuration of 0.5m/s the resulting temperature is still above the comfortable room temperature of 25℃. The room temperature drops below 20°C on velocity variation 0.7m/s. While at the inlet velocity 3m/s-9m/s, room temperature is relatively cold, reaching temperatures below 15℃. Based on the temperature distribution pattern, the room temperature does not yet have overall uniformity in the inlet velocity 0.1m/s – 0.5m/s. At inlet velocity 0.7m/s – 3m/s room temperature uniformity shows a little bit evenly compared to the previous inlet velocity. Room temperature shows uniformity at inlet velocity 5m/s – 9m/s because the measurement results at this velocity are in the same value range, namely 9-11℃. However, at this velocity the temperature is below the expected indoor comfort standard [19].
(a) 0.1m/s
(b) 0.3m/s
(c) 0.5m/s
(d) 0.7m/s
(e) 0.9m/s
(f) 1m/s
(g) 3m/s
(h) 5m/s
(i) 7m/s
(j) 9m/s
Figure 4. Temperature pattern
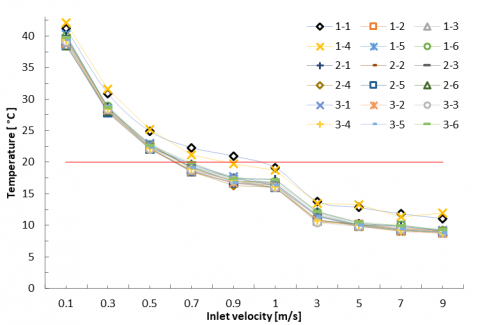
Figure 5 shows the effect of the water inlet velocity on the diffuser on the overall room temperature. Room temperature sampling was divided into three levels, the first level was taken around the human body (1 m above the floor), the second level was taken at a height of 2.5 meters above the floor, and the third level was taken at a height of 4 meters above the floor. The effect of inlet velocity is inversely proportional to room temperature, the higher the inlet speed, the lower the resulting room temperature. At an inlet velocity of 0.7-1m/s, the room temperature and the temperature around the human body are at the comfort level in the room according to the standard [19] i.e. range 17-21℃.
Figure 5. Cooling effect of inlet velocity
The temperature around the human body is evaluated to determine the level of comfort. Based on Figure 5, the temperature around the human body has a not so much difference. The temperature around the human body is shown by the label 1-1 to 1-6 in Figure 5. At the inlet 0.7m/s the temperature around the human body is at 21℃, at the inlet 0.9m/s temperature decreases to 19℃ and when the inlet speed is 1m/s the temperature around the human body becomes 17℃.
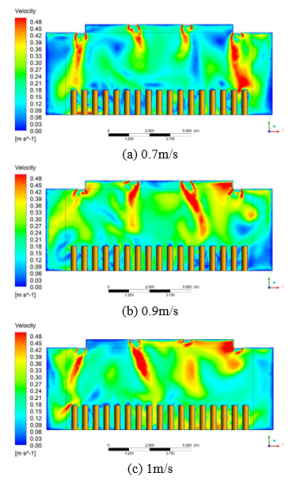
Based on Figure 6, this comfortable condition can be fulfilled because of the cold air that is completely blown into the room. While at the inlet speed below 0.5m/s. The cold air that was exhaled before arriving around the human body has returned to the outlet. The air flow at an inlet speed of 3m/s – 9m/s changes because there is high turbulence in the human body area, so the human body area has a cooler temperature.
Figure 6. Pattern of velocity
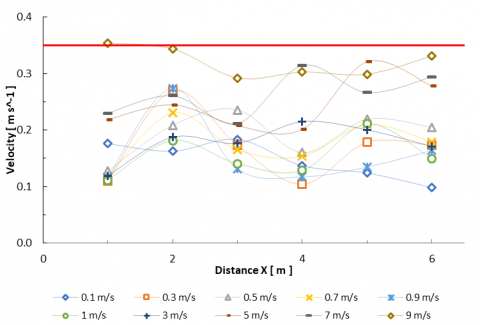
The Figure 7 shows the simulation results for the velocity values in the area around the human body. The air velocity around the human body shows the comfort level because the value is below 0.35m/s [19, 20]. Overall, the exhaled cold air can be distributed evenly, not only limited to certain areas. This is different from previous studies that used wall-mounted air conditioners which were only concentrated in close proximity to the air conditioner [15].
Figure 7. Velocity on human body area
Evaluation of the performance of the air distribution system in a room is a function of effective draft temperature and air velocity. The value of the effective draft temperature is generated from the formula below:
$E D T=\left(T-T_{a c}\right)-8(v-0.15)$ (1)
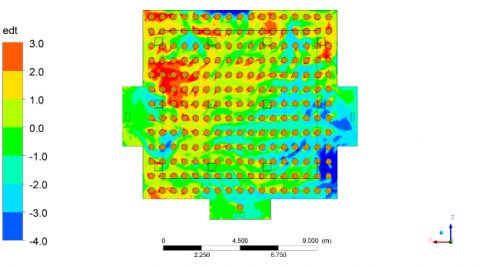
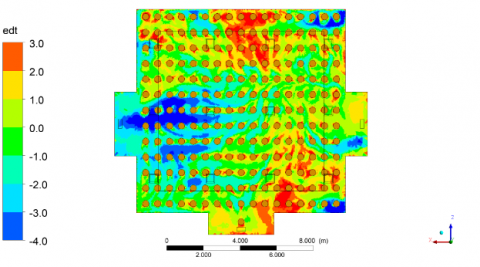
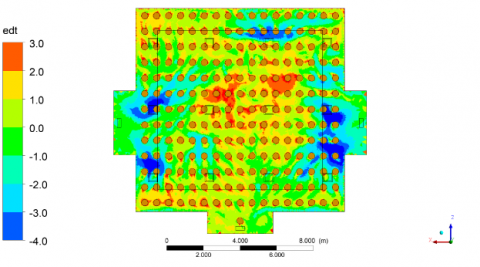
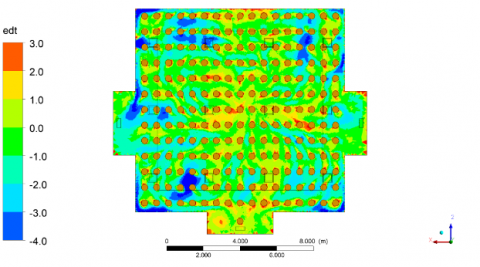
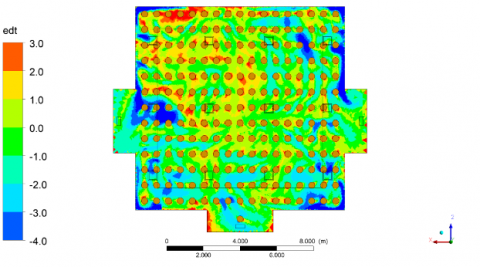
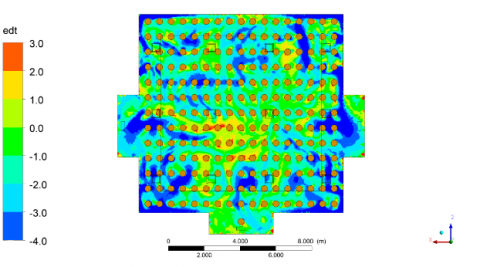
Figure 8 shows the EDT value in the area around the human body. At an inlet velocity 0.1m/s the EDT value at the back of the mosque has a high value (>3) indicated in red in Figure 8a. At an inlet velocity of 0.3m/s, the EDT contour results show a decrease in the percentage of red color. Likewise, at 0.5m/s and 0.7m/s the EDT contour results showed a decrease in the percentage of red. While at the inlet speed of 3m/s the contour changes are slightly different where the color contour changes decrease in red but the dark blue color contour increases compared to the previous speed. This is indicated by the more visible the color. This percentage can be seen in Figure 9.
(a) 0.1m/s
(b) 0.3m/s
(c) 0.5m/s
(d) 0.7m/s
(e) 0.9m/s
(f) 1m/s
(g) 3m/s
(h) 5m/s
(i) 7m/s
(j) 9m/s
Figure 8. Effective draft temperature pattern
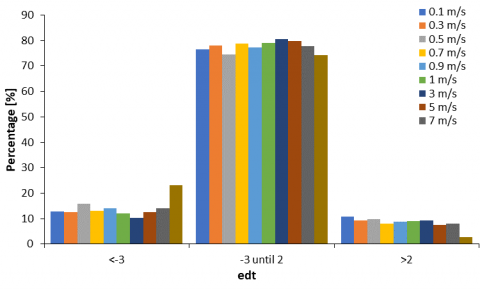
According to the simulation results that have been carried out. EDT percentage can be seen in Figure 10. Figure 10 Shows that the percentage of EDT values between -3 to 2 reaches 75% in all variations of inlet velocity. This shows that at all inlet velocity has a good level of comfort. Air conditioning with a central air conditioning system only requires an inlet speed of 0.7m/s lower than in previous studies using wall-mounted air conditioning to get a comfortable room temperature.
Figure 9. Calculations of EDT
Figure 10. Percentage of EDT
In this study, the performance of thermal comfort and air distribution was investigated numerically by evaluating based on standard indices of flow patterns, temperature distribution and effective draft temperature (EDT). Based on the simulation results, it can be concluded that the inlet velocity of 0.7 m/s with a cooling load of 222 people produces the maximum temperature distribution. The value of effective draft temperature at a velocity of 0.7 m/s exceeds 75%. Based on these results, we can conclude that the use of central air conditioning with 12 diffusers with an inlet velocity of 0.7m/s is the best configuration.
Authors are grateful to the Universitas Sebelas Maret for providing research facilities and Universitas Pertahanan Indonesia for collaborating research.
[1] Bamodu, O., Xia, L., Tang, L. (2017). A numerical simulation of air distribution in an office room ventilated by 4-way cassette air-conditioner. Energy Procedia, 105: 2506-2511. https://doi.org/10.1016/j.egypro.2017.03.722
[2] Arifin, Z., Soeparman, S., Widhiyanuriyawan, D., Suyitno, S. (2017). Performance enhancement of dye-sensitized solar cells using a natural sensitizer. International Journal of Photoenergy, 2017: 2704864. https://doi.org/10.1063/1.4968376
[3] Harsito, C., Tjahjana, D.D.D.P., Kristiawan, B. (2020). Savonius turbine performance with slotted blades. AIP Conference Proceedings, 2217: 30071. https://doi.org/10.1063/5.0000797
[4] Prasetyo, S.D., Harsito, C. (2019). Energy consumption of spray dryer machine for producing red natural powder dye and its stability energy consumption of spray dryer machine for producing red natural powder dye and its stability. AIP Conference Proceedings, 2097(1): 030076. https://doi.org/10.1063/1.5098251
[5] Ridwan Prasetyo, S.D., Kusuma, A.C., Rahman, R.A., Suyitno. (2019). Recent progress of biogas produced from the waste of natural indigo dyes for electricity generation. AIP Conference Proceedings, 2097: 30025. https://doi.org/10.1063/1.5098200
[6] Arifin, Z., Tjahjana, D.D.D.P., Suyitno, S., Juwana, W.E., Rachmanto, R.A., Apribowo, C.H.B., Harsito, C. (2021). Performance of crossflow wind turbines in in-line configuration and opposite rotation direction. Journal of Advanced Research in Fluid Mechanics and Thermal Sciences, 81(1): 131-139.
[7] ISO. (1994). Moderate thermal environments: Determination of the PMV and PPD indices and specification of the conditions for thermal comfort. https://doi.org/10.3403/00814151
[8] Stoecker, W.F., Jones, J.W. (1982). Refrigeration and Air Conditioning. Mc GrawHill Book Co, New York.
[9] Arismunandar, W., Saito, H. (1980). Penyegaran udara. Pradnya Paramita, dengan bantuan Association for International Technical Promotion.
[10] Noh, K.C., Han, C.W., Oh, M.D. (2008). Effect of the airflow rate of a ceiling type air-conditioner on ventilation effectiveness in a lecture room. International Journal of Refrigeration, 31(2): 180-188. https://doi.org/10.1016/j.ijrefrig.2007.07.005
[11] Harsito, C., Permana, A.N.S., Sihta, F. (2021). Energy efficiency calculation and air handling unit design based on cooling load capacity at MASTEK mosque. In IOP Conference Series: Earth and Environmental Science, 746(1): 012032. https://doi.org/10.1088/1755-1315/746/1/012032
[12] Gan, G. (1995). Evaluation of room air distribution systems using computational fluid dynamics. Energy and Buildings, 23(2): 83-93. https://doi.org/10.1016/0378-7788(95)00931-0
[13] Sabtalistia, Y.A., Ekasiwi, S.N.N., Iskandriawan, B. (2014). Effect of air conditioning position on thermal comfort in the floor air conditioning system. Applied Mechanics and Materials, 493: 74-79. https://doi.org/10.4028/www.scientific.net/AMM.493.74
[14] Chen, Q., Zhai, Z. (2004). The use of CFD tools for indoor environmental design. Advanced Building Simulation, 119-140.
[15] Harsito, C., Permata, A.N.S. (2021). Investigation of air distribution in mosque rooms with different angles of supply and inlet velocity. International Journal of Heat and Technology, 39(4): 1383-1388. http://dx.doi.org/10.18280/ijht.390439
[16] Ning, M., Mengjie, S., Mingyin, C., Dongmei, P., Shiming, D. (2016). Computational fluid dynamics (CFD) modelling of air flow field, mean age of air and CO2 distributions inside a bedroom with different heights of conditioned air supply outlet. Applied Energy, 164: 906-915. https://doi.org/10.1016/j.apenergy.2015.10.096
[17] Balaji, N.C., Mani, M., Venkatarama Reddy, B.V. (2013). Thermal performance of the building walls. Building Simulation Applications, 346: 151-159.
[18] Rugh, J.P., Bharathan, D. (2005). Predicting human thermal comfort in automobiles. SAE Transactions, 2508-2516. https://www.jstor.org/stable/44725282
[19] ANSI/ASHRAE Standard 55-2004. Thermal Environmental Conditions for Human Occupancy, 3. American Society of Heating, Refrigerating and Air-Conditioning Engineers, Inc.
[20] Cao, G., Awbi, H., Yao, R., Fan, Y., Sirén, K., Kosonen, R., Zhang, J.J. (2014). A review of the performance of different ventilation and airflow distribution systems in buildings. Building and Environment, 73: 171-186. https://doi.org/10.1016/j.buildenv.2013.12.009