Sri Indrawati* | Enif Ramadhan Madarja
© 2022 IIETA. This article is published by IIETA and is licensed under the CC BY 4.0 license (http://creativecommons.org/licenses/by/4.0/).
OPEN ACCESS
As a part of primary care clinic, the Indonesian-community health center is responsible for efforts to encourage independence and create a community for healthy living. The service facility commonly used is the general polyclinic. A number of problems occur are non-value added activities that lead to a longer waiting time. Therefore, the aim of this study is to improve the service performance at Indonesian-community health center. This research used six sigma DMAIC model in evaluating the current service system using value stream mapping (VSM), determining critical waste using the Borda count method, identifying the root causes of critical waste, designing the alternative service system improvements using theory of inventive problem solving (TRIZ), building alternative simulation models using Flexsim software, and evaluate the improvement plan. The result shows that the average time of general polyclinic services in current system is 107 minutes with waiting as critical waste (23%). There are two health-service improvement scenarios developed using theory of inventive problem-solving method (TRIZ), i.e. scenario 1 and scenario 2. Both scenarios are evaluated by considering some criterias, i.e. idle time, waiting time, number of patients served, lead-time and process cycle efficiency. The best scenario is scenario 2 with 48.2% reduction in lead time and process cycle efficiency increased by 48%.
lean healthcare, VSM, six sigma, TRIZ, simulation-based lean
By becoming a priority industry sector, the number of healthcare service providers in Indonesia is increasing. The growth reached 4.7% in 2020 with the majority provided non-inpatient services at 59.6% [1]. However, the increase in the number of healthcare service providers is not accompanied by an increase in the quality of services. Indonesia is still facing a poor performance in service promptness and quality of care especially at the community health centers [2]. In addition, there is also a problem regarding to accessibility of quality health services throughout Indonesia [3].
As a provider of health services, Indonesian-community health centers must provide services that are effective, safe, excellence, and desired result [4]. Meanwhile, most users of Indonesian-community health centers (primary care clinics) complain about long waiting times and short opening hours [5]. The majority of patients show dissatisfaction in health services especially with the health worker performance efficiency [6]. Therefore, a strategy to improve the healthcare services performance is strongly needed in realizing customer satisfaction.
Implementation of lean is one approach used for improving service quality performance. Lean is a specific speed tool for dealing with non-value add activities and cost to the service [7]. It is an important tool for increasing customer satisfaction and service performance improvement [8, 9]. There are five main principles in lean, i.e. specify value, identify whole value stream, flow, pulled, perfection [10].
Lean service has been developed over years of research and experience. The use of lean principles has been implemented in the aviation services industry with the result of increasing flexibility in meeting customer demand and reducing operational operating costs, development time, transactions, and licensing [11]. The lean concept has also been applied to improve health service access by identifying current service processes, identifying waste and developing service improvement opportunities based on the established customer values [12]. The waiting time in the outpatient CT scan process can be reduced by 19% using value stream mapping (VSM) [13]. Lean healthcare can improve operational effectiveness of health services [14]. Lean healthcare effectiveness can be measured using two main indicators, i.e. length of stay and waiting time for both appointments and treatments [15].
There are several problems in lean service implementation. Lack of cultural infrastructure leads to unsustainable results [7]. The successful implementation of the lean service concept is determined by several factors, which are management involvement in improving the process and employee attitudes to minimize waste in the process [16]. Six sigma is a method that can be integrated into lean to solve these problems. Six Sigma works with DMAIC cycle (define, measure, analyze, improve and control) and powerful statistical method that assist management and employee to control the system improvement [17]. Lean six sigma has been successfully used to improve operating room efficiency in pediatric hospitals [18]. Six sigma has been widely used in healthcare sector to improve efficiency and service quality [19].
VSM is a powerful lean tool used to identify inefficiencies in service processes and reduce value added activities [20]. VSM is a tool used to visualize an industry's business processes along with important information, i.e. cycle time and lead time [21]. There are five main components used in VSM, i.e. main input, key process, key process information, main output and system summary matric [21].
However, commonly used VSMs are not designed to accommodate variability [22]. So that simulations are needed to model a complex healthcare value stream such as patient queues in this case study. Simulations have been used effectively to increase quality potential in the healthcare sector [23].
A lean action usually being generated to address the lean problems found along the value stream. To produce more effective lean action, theory of inventive problem solving method (TRIZ) is able to provide more useful inventive solutions through its knowledge-based tools [24]. TRIZ use a systematic thinking that helpful for generating a breakthrough idea based on TRIZ knowledge base [25].
Application of lean healthcare in a community health center is rarely done. Therefore, this study aims to develop a quality improvement model with simulation-based lean six-sigma and TRIZ. Simulation models are integrated to evaluate lean actions [26]. TRIZ is recommended to provide a creative action plan in healthcare quality problem [27, 28].
The subject of the research is Indonesian-community health center in West Java. Data about cycle time, layout, average employee/nurse/doctor per day, information flow in each department and working hours are collected through direct observation. This research was conducted using six sigma methodology through five main stages, which are [7]:
(1) Define, problem identification from the health service system is done using a current value stream mapping (CVSM). The cycle time of each service process is obtained from primary data by measuring 30 samples directly using a stopwatch. After that, the adequacy test is carried out on each type of data obtained using Eq. (1) [29]. From CVSM, service activities are identified and grouped into value added (VA), non-value added (NVA) and non-value added (NNVA) activities. The process cycle efficiencies then being evaluated.
$N=\left(t_{\alpha / 2^{S}} / E\right)^{2}$ (1)
(2) Measure, the measure stage is to measure the performance of the current service system as baseline measurement. Service system performance indicators in this study are service lead-time and process cycle efficiency. At this stage, a critical waste identification process is also performed using a survey for several experts consisting of doctors, heads of departments, senior employees, pharmacist, operational staff, and laboratory personnel. The survey is conducted through a questionnaire to evaluate eight types of service waste. There are nine types of waste found in the service industry known as E-DOWNTIME comprising of defects, waiting, transportation, over production, inappropriate processing, excess inventory, unnecessary motion and human potential [30]. The assessment score on the questionnaire is 1-8 with the number 1 for the most frequent waste and the number 8 for the waste that occurs the least frequently and even never happened. Then, the results of the questionnaire are processed using the Borda count method using Eq. (2) to get critical waste [31].
$b_{i}=\sum_{k}\left(N w-r_{i k}\right)$ (2)
(3) Analyze, determining the root cause of critical waste is done at this stage by using an initial model simulation. The software used is Flexsim 6. The development of simulation models is done by dragging objects in the library column in Flexsim 6 software. The source object function for arrival time, queue for waiting time, processor for work processes in each workstation, operator, network node for path distribution, and sink output results that come out, the object that will describe the layout of the system to be modeled and given the appropriate connection between objects related to the real system. After that, the behavior of each object is defined in accordance with the data distribution and the actual system, processing time, capacity and so on. The simulation model is implemented by validating the test in the form of a similarity of two averages, a similarity test of two variances and a Chi-square test based on simulation data from the initial model output with historical data. The data used to validate the model is the average output of patients served.
(4) Improve, the kaizen planning principle is used which aims to eliminate non-value added activity by considering the root cause of critical waste. An engineering contradiction developed based on that root cause. The TRIZ method then being used to create quality improvement plan. The system parameters are determined using TRIZ 39 system parameters for business and management. The 40 inventive principles and a contradiction matrix are used [32]. The TRIZ contradiction analysis is a powerful tool for generating alternative solutions [25]. Two alternative improvement scenarios, which are scenario 1 and scenario 2, are developed to evaluate the performance of alternative service system improvements.
(5) Control, the best scenario is determined based on lean performance measurement criteria. There are four criteria, i.e. idle percentage, waiting time in administration and payment, waiting time in general polyclinic and number of patient. Then evaluation of service lead-time and process cycle efficiency is done.
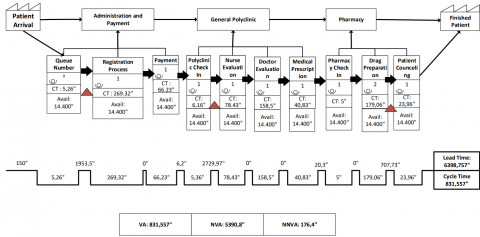
The general Polyclinic process at the Indonesian-community health center consists of ten processes which can be grouped into four parts, i.e. patient registration, nurse evaluation, doctor evaluation and pharmacy. Patients who come to the general polyclinic are divided into 2 types, i.e. general patients and national health insurance patients. General patients are patients who served with a cash payment system, while nation health insurance patients are patients who served based on an insurance form. The current service system has a lead-time of 1 hour 46 minutes and a cycle time of 13 minutes 51 seconds as seen in Figure 1.
Activities categorized as a value added are 13%, non-value added are 84.5%, necessary non value added are 2.75%. It shows that the process cycle efficiency is still low at only 13%. Low cycle efficiency indicates some of resources consumed for non-value added activities.
Figure 1. Current service system of general polyclinic in Indonesian community health center
Figure 2. Initial simulation model
Long patient service time is caused by some service waste that commonly occurs in the patient service process. To determine the critical waste, a survey is conducted to seven respondents from the management level. Survey data processing is carried out using the Borda count method by ranking each type of waste and multiplying it with the appropriate weights that is rank 1 has the highest weight (n-1) and so on. The analysis shows that there are eight types of waste in the process, i.e.
(1) Waiting (Borda value 0.23) i.e. waiting for the administration queue, patients waiting for the doctor and patients waiting in line to take medicine.
(2) Transportation (Borda value 0.19) i.e. officers walk to take patient identity status files, officers walk to send documents, medical record documents are brought by the patient and shown to each unit.
(3) Defect (Borda value 0.15) i.e. the drug prescriptions is not clear, the patient's medical record is not clear, wrong amount of medicine.
(4) Inappropriate processing (Borda value 0.12) i.e. the officers provide the same information to patients repeatedly, officers explain the flow of services to new patients, the officer checks the completeness of the insurance file in each unit.
(5) Inventory (Borda value 0.1) i.e. stacking medical record documents, administration officers pile up a lot of medical record folders before being sent to the clinic at once, pharmacists stack drugs that have been mixed before being handed over to patients.
(6) Motion (Borda value 0.09), i.e. officers looking for patient medical record files, officers looking for equipment, officers asking for unclear document, officers check drug availability.
(7) Over production (Borda value 0.08) i.e. release the same laboratory results, enter the same data repeatedly. pharmacists make concoctions that are often prescribed, the officer called many times so that the patients who are queuing answered each other.
(8) Human potential (Borda value 0.04) i.e. officers feel that their ideas are not being heard, large idle time in certain units.
Based on Borda count method, it is found that critical waste in the patient service process is waiting. This is in accordance with the results of direct interview. The interview is conducted with the management leader to identify the complaints received from patients. Complaints experienced by patients that affect the service quality are long waiting times. To find the root cause for waste type waiting, a simulation model is used for describing the current service process.
The simulation model is created using the cycle time data used in CVSM and its distribution. There are 18 types of data being used, i.e. the time of queue number printing, the time of administrative registration process 1, the time of administrative registration process 2, admin 1 processing time entering patient data, admin 2 processing time entering patient data, process time admin 1 receives payment,, process time admin 2 receives payment, process time admin 1 submits the queue number for doctor's examination, process time admin 2 submits the queue number for the doctor's examination, transfers time of the patient to the doctor's examination room, process time for nurse evaluation, process time for doctor's examination, process time for the doctor making prescriptions, time for transferring patients to pharmacy, processing time for submitting pharmacy queue numbers, processing time for pharmacist 1 providing drugs, processing time for pharmacist 2 providing drugs, processing time for Admin of pharm 1 delivering drugs to patients, process time for Admin of pharm 2 delivering drugs to patients as seen in Figure 2.
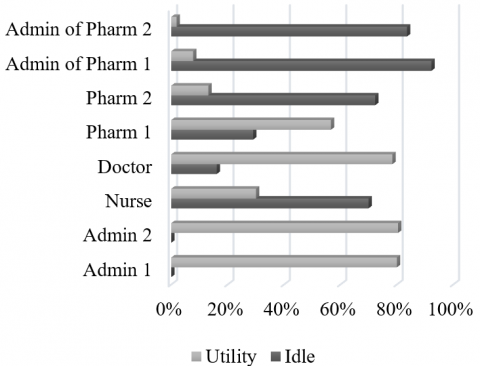
Furthermore, the initial simulation model validation is carried out based on the model's output and the actual output. There are three validation method used in this study, i.e. the similarity test of two averages, the similarity test of two variances and the Chi-Square test. The t test is used to analyzed the similarity of real system data and simulated data with 30 samples and an alpha level of 0.05. The result of t count is 1.37 while the t table is 2.048 then the null hypothesis is accepted because t count < t table. While the similarity test of two variances is conducted using F test with 0.05 alpha level. The test is used to determine whether the real system data and simulated data samples have different variances. The result of F count is 2.00 while the F table is 2.101 then the null hypothesis is accepted because F count < F table. The Chi-Square test is used to find out how far the simulation data deviate from the real system data. The Chi-Square test is carried out with the same alpha level and produce Chi Square count of 4.89$<$Chi Square table of 42.55. Based on the three statistical tests, it can be concluded that the initial simulation model is representative for real system. Initial model simulation results show that the waiting time on administrative workstations and payments is on average of 5200.2 seconds with 44-45 people queuing. Whereas the waiting time is on average of 1958.7 seconds with a queue of 22 people. The number of initial model outputs is 96 patients. The operator with the highest idle is at the pharmacy workstation with a value of 92.24% as seen in Figure 3.
Figure 3. State report of initial simulation model
While operator utilities on administration and payment workstations are 80.02-80.41%, which means that the workload experienced is quite high. Hence, it can be concluded that the biggest waiting time is caused by the work capacity of operators in the administration and payment process. The workload on the patient registration department has increased from year to year and created long queues [33].
If the work capacity of operators is increased, the service loss can decrease. This will reduce service inefficiency as well. However, this condition can also increase the operational cost arising from the addition of work capacity, i.e. recruitment costs, salary of new workers, training and insurance cost. TRIZ is used to solve that contradictory problem. From that condition, the improving parameter used is service loss or waste of energy caused by waiting time (TRIZ parameter no 22). As for the worsening parameter used is system productivity that intend to cost per unit output (TRIZ parameter no 39).
There are four inventive principles alternative obtained from the TRIZ contradiction matrix based on the improving and worsening parameters [28] i.e.
The suitable inventive principle is pneumatics and hydraulics that performed with transforming a rigid to flexible organization [28]. In flexible organization, the company can easily mobilize worker. In this case, the pharmacy administration operator will work in administration and payment workstation to reduce waiting times in the general polyclinic process. This alternative solution is then referred to scenario 1.
In scenario 1, Admin of pharm 1 become Admin 3. Scenario 1 can produce a reduction in waiting time on administrative workstations and payments by 69% with the number of queues reduced to 95%. This condition leads to increasing number of patients served so that the utility of doctors in general polyclinic increased by 1.23% with 76 people in line as seen in Figure 4. This is due to the limited productivity of a doctor.
Figure 4. State Report of Scenario 1 Simulation Model
Currently, available doctor is insufficient to deal with the growing potential demands. The Indonesian Government needs to improve the country's healthcare capacity by increasing the number of medical staff and distribute them equally [34]. The number of doctors who died while on duty during the covid 19 period, lead to increasing shortage of doctors. This cannot be seen as an ideal situation because it triggers the existing doctors to work more than their capacity. If the doctor work capacity increased, then the Indonesian-community health center will be able to increase its service performance but the doctor health worsens. So it can be concluded that the improving parameter is service reliability (TRIZ parameter no 27). However the worsening parameter is force that associated with doctor stress (TRIZ parameter no 10).
The recommended inventive principles based on that system parameters are local quality (TRIZ inventive principle no 3), anti-weight (TRIZ inventive principle no 8), preliminary action (TRIZ inventive principle no 10) and mechanics substitution (TRIZ inventive principle no 28) [28]. The potential inventive principle is anti-weight through compensating the workload of doctor in general polyclinic by combining him with other polyclinic doctors to provide support. The Indonesian-community health center can use the specialist doctor at gynecology polyclinic to help service at the general polyclinic during busy times.
For this reason, scenario 2 model is developed by adding a temporary doctor as a server. Scenario 2 model is developed based on combining the initial model and scenario 1 model, with the addition of a server (doctor). The final service model, mobilize the people of pharmacies administration 1 to the administration and payment workstation and adding a temporary doctor, produce a queue reduction in general polyclinic than the initial model. Several service performance criteria are used to evaluate the alternative solution, i.e. output results, operator idle percentages and waiting times [35]. Scenario model 2 decreased waiting time in general polyclinic by 98% as seen in Table 1. By implementing scenario 2 model, the process cycle efficiency of patient services in the Indonesian community health center increases to 25%.
Table 1. Comparison of initial model, scenario 1 and scenario 2
|
Criteria |
Initial Model |
Scenario 1 |
Scenario 2 |
|
Adm of Pharm 1 Idle time (%) |
92.24 |
9.78 |
- |
|
Waiting Time in Administration and Payment (second) |
5200.2 |
1582.7 |
- |
|
Waiting Time in General Polyclinic (second) |
1958.7 |
4301.1 |
24.6 |
|
Output (patient) |
96 |
101 |
143 |
A healthcare service quality measurement is essential for its continuous quality improvement. Measuring the current service quality can help the healthcare service providers to produce a better action plan. Based on the research that has been conducted at the Indonesian community health center, the critical waste identified is the waiting, i.e. the time when no value-added activities take place. Initial simulation model is used to evaluate this type waste. The simulation result shows the inadequate work capacity of operators in the administration and payment process and general polyclinic doctor lead to waiting times and long queue. If this problem is not solved, patient satisfaction will decrease. A healthcare improvement action then being generated using TRIZ. This action can perform a better result by reducing the waiting time and number of queues in each unit.
This lean healthcare implementation framework can be used in other case study with some adjustment. Adding other healthcare service providers will create a better comparison and a robust framework. Another lean tools for service waste assessment can be applied, such as 5 Why, A3 and so on. Other TRIZ tools can also be applied, i.e. substance-field model and algorithm of inventive problem solving (ARIZ) [27]. In addition, to get a more comprehensive evaluation of service performance, other performance criteria can be used i.e. cost reduction, improved patient satisfaction, improved employee satisfaction and so on [35].
This research is supported by Industrial Engineering Department, Faculty of Industrial Technology, Universitas Islam Indonesia.
|
N |
sample size |
|
t(α/2) |
t table value |
| s | sample standard deviation |
|
E |
error tolerance |
|
bi |
Borda value |
|
Nw |
Number of service waste |
|
r |
ranking of service waste i based on criterion k |
|
B1 |
Patient registration 1 |
|
B2 |
Patient registration 2 |
|
C1 |
Admin 1 input patient data into system |
|
C2 |
Admin 2 input patient data into system |
|
D1 |
Patient payment process 1 |
|
D2 |
Patient payment process 2 |
|
E1 |
Admin 1 Submit the Doctor's examination queue number to the patient |
|
E2
|
Admin 2 submit the Doctor's examination queue number to the patient |
|
F |
Patient goes to general poly |
|
G |
Nurse evaluation process |
|
H |
Doctor checks patient |
|
I |
Doctor makes drug prescription |
|
J |
Patient goes to pharmacy |
|
K |
Patient submits the queue number for taking medicine |
|
L1 |
Pharmacists 1 make medicine, mix, and prepare medicine |
|
L2 |
Pharmacists 2 make medicine, mix, and prepare medicine |
|
M1 |
Admin of Pharm 1 handing over the medicine, and explaining the procedure for using the medicine |
|
M2 |
Admin of Pharm 2 handing over the medicine, and explaining the procedure for using the medicine |
[1] Kementrian Kesehatan, R.I. (2021). Profil Kesehatan Indonesia 2020. Available: www.pusdatin.kemkes.go.id, accessed on 30 November, 2021.
[2] Mahendradatha, Y., Trisnantoro, L., Listyadewi, S., Soewandono, P., Marthias, T., Harimurti, P., Prawira, J. (2017). The republic of Indonesia health system review. Health Systems in Transition, 7(1). WHO Regional Office for South-East Asia. https://apps.who.int/iris/handle/10665/254716.
[3] Wiseman, V., Thabrany, H., Asante, A., et al. (2018). An evaluation of health systems equity in Indonesia: Study protocol. International Journal for Equity in Health, 17(1): 1-9. https://doi.org/10.1186/s12939-018-0822-0
[4] Allen-Duck, A., Robinson, J.C., Stewart, M.W. (2017). Healthcare quality: A concept analysis. Nurse Forum. 52(4): 377-386. https://doi.org/10.1111/nuf.12207
[5] Ekawati, F.M., Claramita, M., Hort, K. (2017). Patients’ experience of using primary care services in the context of Indonesian universal health coverage reforms. Asia Pacific Family Medicine, 16(1): 1-10. https://doi.org/10.1186/s12930-017-0034-6
[6] Pertiwi, M.I., Rosyida, M.K., Sari, O.N., et al. (2021). Effectiveness of resources to provide health care of national health insurance participants satisfaction: Meta-analysis. Journal of Health Policy and Management, 6(02): 154-159.
[7] George, M.L. (2003). Lean Six Sigma for Service. Mc Graw-Hill Inc. USA.
[8] D’Andreamatteo, A., Ianni, L., Lega, F., Sargiacomo, M. (2015). Lean in healthcare: A comprehensive review. Health Policy, 119(9): 1197-1209. https://doi.org/10.1016/j.healthpol.2015.02.002
[9] Vadivel, S.M., Sequeira, A.H., Sakkariyas, R.R., Boobalan, K. (2021). Impact of lean service, workplace environment, and social practices on the operational performance of India post service industry. Annals of Operations Research, 1-26. https://doi.org/10.1007/s10479-021-04087-z
[10] Hines, P., Taylor, D. (2000). Going Lean, Lean Enterprise Research Center. Cardiff Bussiness School.
[11] Ikatrinasari, Z.F., Haryanto, E.I. (2014). Implementation of lean service with value stream mapping at directorate airworthiness and aircraft operation, ministry of transportation republic of Indonesia. Journal of Service Science and Management, 7(4): 49136. https://doi.org/10.4236/jssm.2014.74026
[12] Parkhi, S.S. (2019). Lean management practices in healthcare sector: A literature review. Benchmarking: An International Journal, 26(4): 1275-1289. https://doi.org/10.1108/BIJ-06-2018-0166
[13] Dako, F., Cobb, R., Verdi, S., Grygorenko, M., Patel, T., Zink, R., Belden, C. (2018). Use of value stream mapping to reduce outpatient CT scan wait times. Journal of the American College of Radiology, 15(1): 82-85.
[14] Hallam, C.R., Contreras, C. (2018). Lean healthcare: Scale, scope and sustainability. International Journal of Health Care Quality Assurance, 31(7): 684-696. https://doi.org/10.1108/IJHCQA-02-2017-0023
[15] Tlapa, D., Zepeda-Lugo, C.A., Tortorella, G.L., Baez-Lopez, Y.A., Limon-Romero, J., Alvarado-Iniesta, A., Rodriguez-Borbon, M.I. (2020). Effects of lean healthcare on patient flow: a systematic review. Value in Health, 23(2): 260-273. https://doi.org/10.1016/j.jval.2019.11.002
[16] Lisiecka, K., Burka, I. (2016). Lean service implementation success factors. Quality Innovation Prosperity, 20(1): 72-94. https://doi.org/10.12776/qip.v20i1.640
[17] Mousavi, B., Mojdeh, S., Larti, N. (2021). Assessing safety hazards and occupational health in operating room nurses using Lean Six Sigma method. Perioperative Care and Operating Room Management, 24: 100197. https://doi.org/10.1016/j.pcorm.2021.100197
[18] Tagge, E.P., Thirumoorthi, A.S., Lenart, J., Garberoglio, C., Mitchell, K.W. (2017). Improving operating room efficiency in academic children's hospital using lean six sigma methodology. Journal of Pediatric Surgery, 52(6): 1040-1044. https://doi.org/10.1016/j.pcorm.2021.100197
[19] Niñerola, A., Sánchez-Rebull, M.V., Hernández-Lara, A.B. (2020). Quality improvement in healthcare: Six Sigma systematic review. Health Policy, 124(4): 438-445. https://doi.org/10.1016/j.healthpol.2020.01.002
[20] Renfro, C., Blagg, K., Wilson, C.A., Overshine, K., Hohmeier, K. (2021). Use of value stream mapping to improve the medication synchronization process. Journal of the American Pharmacist Association, 62(3): 740-749. https://doi.org/10.1016/j.japh.2021.12.007
[21] Keyte, B., Locher, D.A. (2016). The Complete Lean Enterprise: Value Stream Mapping for Office and Services 2nd Ed. CRC Press. New York.
[22] Baysan, S., Kabadurmus, O., Cevikcan, E., Satoglu, S.I., Durmusoglu, M.B. (2019). A simulation-based methodology for the analysis of the effect of lean tools on energy efficiency: An application in power distribution industry. Journal of Cleaner Production, 211: 895-908. https://doi.org/10.1016/j.jclepro.2018.11.217
[23] Betegon, M.A.T, Gonzales, V.B., Ramrez, N.B., Acre, A.M., De Guzman, J.R., Calvo, F.J.R. (2021). Quality management system implementation based on lean principles and ISO 9001:2015 standard in an advanced simulation centre. Clinical Simulation in Nursing, 51: 28-37. https://doi.org/10.1016/j.ecns.2020.11.002
[24] Lee, C.H., Chen, C.H., Li, F., Shie, A.J. (2020). Customized and knowledge-centric service design model integrating case-based reasoning and TRIZ. Expert Systems with Applications, 143: 113062.
[25] Wang, Y.H., Lee, C.H., Trappey, A.J. (2017). Service design blueprint approach incorporating TRIZ and service QFD for a meal ordering system: A case study. Computers & Industrial Engineering, 107: 388-400. https://doi.org/10.1016/j.cie.2017.01.013
[26] Barnabè, F., Giorgino, M.C., Guercini, J., Bianciardi, C., Mezzatesta, V. (2018). Management simulations for lean healthcare: Exploiting the potentials of role-playing. Journal of Health Organization and Management, 32(2): 298-320. https://doi.org/10.1108/JHOM-07-2017-0191
[27] Lari Semnani, B., Mohebbi Far, B., Shalipoor, E., Mohseen, M. (2015). Using creative problem solving (TRIZ) in improving the quality of hospital services. Global Journal of Health Services, 7(1): 88-97. https://doi.org/10.5539/gjhs.v7n1p88
[28] Guner, S., Kose., I.A. (2020). New approach that proposes triz as a creative problem solving technique in health services. Research Journal of Business and Management, 7(2): 67-79. http://doi.org/10.17261/Pressacademia.2020.1200
[29] Walpole, R.E., Myers, R.H., Myers, S.L. (1998). Probability and Statistics for Engineers and Scientist 6th edition. Prentice-Hall. New Jersey.
[30] Gazpersz, V. (2011). Lean six sigma for manufacturing and service industries–waste elimination and continuous cost reduction. Vinchristo Publication. Bogor. Indonesia.
[31] Fraenkel, J., Grofman, B. (2014). The Borda Count and its real-world alternatives: Comparing scoring rules in Nauru and Slovenia. Australian Journal of Political Science, 49(2): 186-205. https://doi.org/10.1080/10361146.2014.900530
[32] San, Y.T. (2014). TRIZ: Systematic Innovation in Business and Management. Firstfruits Sdn.Bhd. Malaysia.
[33] Tyagi, M., Tyagi, P.K., Singh, S., Sathpaty, S., Kant, S., Gupta, S.K, Singh, R. (2021). Impact of application of queuing theory on operational efficiency of patient registration. Medical Journal Armed Forces India. https://doi.org/10.1016/j.mjafi.2021.06.028
[34] Mahendradhata, Y., Andayani, N.L.P.E., Hasri, E.T., Arifi, M.D., Siahaan, G.M.M Solikha, D.A., Ali, P.B. (2021). The capacity of the Indonesian healthcare system to respond to COVID-19. Frontiers in Public Health, 9: 649819. https://doi.org/10.3389/fpubh.2021.649819
[35] Costa, L., B.M, Filho, M.G. (2016). Lean healthcare: Review, classification and analysis of literature. Production Planning & Control, 27(10): 823-836. https://doi.org/10.1080/09537287.2016.1143131