Saleem K. Kadhim* | Sinan Abdul-Ghafar Ali
© 2022 IIETA. This article is published by IIETA and is licensed under the CC BY 4.0 license (http://creativecommons.org/licenses/by/4.0/).
OPEN ACCESS
Computational fluid dynamics is a computer simulation technique used to study the effects of stenosis and aneurysm degree on haemodynamics in the blood vessels such as blood velocity, pressure, and wall shear stress. The current study employed the numerical simulations of pulsed blood flow using the Carreau non-Newtonian rheological and Newtonian models to model the wall shear stresses and haemodynamics in blood vessels. Furthermore, the model included three stenosis areas with different diameters, 70%, 80%, and 90%, and two aneurysm areas with different diameters, 15% and 44%. The study observed the blood velocity, pressure, and wall shear stresses at the damaged blood vessels areas. It was found that the maximum velocity was observed from stenosis when the stenosis ratio was increased to 90%. Additionally, the velocity increased up to 3.4 times, which led to increased blood shear stresses to up to 8.4 times, when the start acceleration flow and peck flow were compared. It is known that the degree of damage on blood vessels produces the most significant influence on local blood pressure and shear stresses. Therefore, it was concluded that stenosis at 90% may probably lead to serious lesions and effectively block the bloodstream by the ensuing thrombus.
stenosis, aneurysm, blood pressure, wall shear stress, damage vessels area
Currently, heart-related diseases are the leading causes of death around the world. Arterial diseases such as stenosis and aneurysm could affect the haemodynamics of the blood vessels. Intravascular atherosclerotic plaques cause stenosis of an artery. Intravascular atherosclerotic plaques form on vessel walls and extend into vessel lumens. Any obstructions in the arteries would change the blood flow considerably, with alterations in pressure and shear stress on the walls of the blood vessels reported as the most common [1].
An in-depth understanding of the blood flow in stenosed arteries is crucial to comprehend its characteristics better. However, not enough analyses were carried out to investigate the impact of different degrees and types of disease have on the distribution of shear stress and pressure along the length of a blood vessel. Moreover, a comparative analysis of the pathological effects of different degrees and types of damages of the blood vessels (stenosis and aneurysm) and blood flow turbulence on blood pressure showed that most of the studies were separate and fragmented [1, 2].
Generally, increased blood pressure is established when blood pressure is measured. However, determining the blood pressure of a damaged blood vessel at the damaged location is challenging since it is local blood pressure, and its value could differ from the total pressure. In addition, determining the pressure and blood vessel wall tensions concerning pathological size is almost impossible. Therefore, scientists employ modern and different methods to diagnose vascular diseases, including the ultrasonic double-scanning duplex method [3].
Furthermore, experimental diagnostic research necessitates the use of specialised technology. Pannier et al. [4] only used experimental blood pressure measurement for certain patients with specific pathologies. Biswas and Chakraborty [5] adopted the blood as a two-fluid model to examine the effects of body acceleration and slip velocity at the walls. Due to a wall slip, they discovered that the velocity and blood flow rate increased, but the effective viscosity decreased. Additionally, due to body acceleration, blood flow rates and velocity were significantly increased. In another study, a model based on a radially non-symmetric artery was created by Singh A.K. and Singh, D.P. [6]. They discovered that as the yield stress was increased and flux reduced, the resistance to blood flow approached unity. The resistance-to-flow ratio did not significantly change when the viscosities were varied. Additionally, yield stress displayed the most significant degree of change, while flux showed the smallest.
Shukla et al. [7] investigated the blood flow dynamics of stenosed arteries using the non-Newtonian fluid flow. The results showed that as the stenosis ratio grew, the flow resistance and wall shear stress increased. However, due to the blood's non-Newtonian behaviour, the increases were minor, indicating its rheological characters were advantageous to the functioning of the damaged arterial circulation.
The blood flow through a stenosed artery with a uniform cross-section was studied by Prakash et al. [8]. Blood flow rate, wall shear stress, and flow resistance against the stenosis size were calculated. The findings showed that stenosis increased the wall shear stress and flow resistance while decreasing the blood flow rate. Mallik et al. [9] investigated multiple stenosis effects with viscosity modifications through a power law fluid model. The results illustrated that arterial stenosis affected the haemodynamic behaviours of blood. Therefore, the researchers suggested that theoretical research could aid in lowering the flow irregularities in human arteries that might cause the formation and spread of arterial diseases and cardiovascular disorders.
For a power law fluid model, Mallik et al. [9] investigated the multiple stenosis effects with viscosity modification. He discovered that arterial stenosis affects blood hemodynamic behavior, therefore theoretical research could aid in lowering the flow irregularities in human arteries that lead to the formation and spread of arterial diseases and cardiovascular disorders.
Sreenadh et al. [10] used an inclined tube with a non-uniform cross-section to build a model and study the effects of numerous stenosis. In another study, Reddy et al. [11] reported the influence of viscosity on Jeffrey fluid peristaltic flow in a uniform tube. Kadhim et al. [12] studied whether the blood flow in the arterial area was within the range of possible non-Newtonian rheological qualities in the presence of various twofold stenosis in the left coronary artery. In another study, Hayat et al. [13] explored the peristaltic flow in a tube with an endoscope. The results showed that when the volume flow rate was high, the axial pressure gradient grew. Additionally, when the wave amplitude was high, the axial pressure first decreased and then increased. Furthermore, Abd-Alla et al. [14] discovered peristaltic flow in an asymmetric channel when magnetic and gravity fields were considered.
As abovementioned, researchers had investigated the effects of various shapes of stenosis in uniform and non-uniform cross-sectional tubes by employing non-Newtonian fluid. However, to date, there are no reports on the effects of the degree of diseases on shear stress and pressure along the length of blood vessels when vascular pathologies (stenosis and dilation) are combined. Consequently, the present study employed a numerical approach to investigate the impacts of a diseased blood vessel and other parameters on blood flow velocity, blood pressure, and shear stress values of the damaged blood vessel. Additionally, the complicated effects of the degrees and types of diseases and blood flow turbulence on blood pressure, stress patterns in diseased blood vessels were assessed. Furthermore, the most dangerous disease cases were identified in this study.
The study aimed to investigate the effects of vascular pathology (stenosis and dilation) on the haemodynamics in the blood vessels by utilising ANSYS CFD (FLUENT) software. The wall pressure and shear stress at the diseased blood vessels were determined. Furthermore, if the degree of the disease reached the point of blood vessel damage was investigated. Numerical simulations for flows at three-stenosed areas with different diameters, 70%, 80%, and 90%, and two aneurysm areas with diameters 15% and 44%, were employed. Subsequently, the Carreau non-Newtonian rheological and Newtonian models were employed to model the haemodynamics and wall shear stresses in the blood vessels. Additionally, the stenosis model was validated against experimental measurements obtained from previous reports.
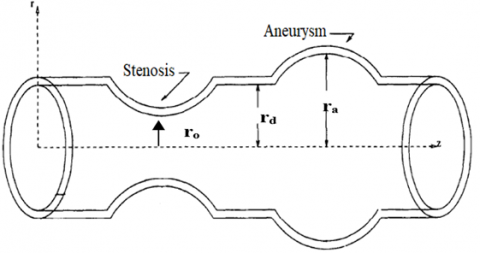
Figure 1 shows the complete model of the degree of disease of the blood vessels, including the symmetrical stenosis and aneurysm areas. The three-dimensional (3-D) model was based on a 3.3 mm diameter and 30 mm long blood vessel [15]. Figure 1a shows a model of a diseased artery with normal segments interposed that was used. Multi-oblique navigation was employed to determine the percentages of stenosis and aneurysm and the lengths of stenotic (LS) and aneurysm (LD) segments. Additionally, the planes for the most significant stenosis and aneurysm and the plane of a normal lumen were found. Multi-planar navigation ensured orthogonality to the artery axis. The centre panels depicted the lowest and largest arterial diameters in the planes of maximum stenosis (dS and DS), maximal aneurysm (dD and DD), and normal arterial lumen (dD and DD, and dN and DN).
Figure 1b shows the three stenosis areas (70%, 80%, and 90% in diameters) and two aneurysm areas (15% and 44% in diameters). Table 1 displays the attributes of the stenosed arteries [16]. According to previous studies [6, 17], a diseased blood vessel model, including stenosis and aneurysm, should be 30 mm, and the blood velocity profile should not change more than 30 mm. Additionally, reports proposed that the diseased blood vessel should be physiologically located at 12 mm from the flow inlet of the model [17].
(a) Diagnostic imaging to artery stenosis and aneurysm [18]
(b) Schematic diagram of the disease degree blood vessels utilized in this study
Figure 1. Disease degree blood vessels model
Table 1. Characteristic parameters of the disease degree blood vessels used in this work (All dimension in mm) [6]
|
Artery |
AN 15% |
AN 44% |
Case 1 (70%) ST |
Case 2 (80%) ST |
Case 3 (90%) ST |
|||
|
ra |
ra |
r |
ro |
r |
ro |
r |
ro |
|
|
blood vessels |
1.6 |
2.082 |
1.5 |
0.82 |
1.5 |
0.67 |
1.5 |
0.47 |
|
Length Ls=Ld |
l=6 |
l=6 |
l=6 |
l=6 |
l=6 |
|||
where, ro is the radius of stenosis, r represents the radius of artery, l is the length of each stenosis and aneurysm, ra represents the radius of aneurysm, AN is the aneurysm, and ST is the stenosis.
The blood flow continuity (Eq. 1) and the Navier-Stokes (NS) equations (Eqns. (2) to (4)) are the general equations of motion used to evaluate the haemodynamics of a 3-D blood flow with cartesian coordinates. For the NS equations, the left-hand side is the inertia forces, balanced by the right-hand side of the equation, which includes the pressure force, body force, and viscous force [19].
Continuity equation is:
$\frac{\partial u}{\partial x}+\frac{\partial v}{\partial y}+\frac{\partial w}{\partial z}=0$ (1)
The NS equation is composed of the following terms:
$\rho\left(\frac{\partial u}{\partial t}+u \frac{\partial u}{\partial x}+v \frac{\partial u}{\partial y}+w \frac{\partial u}{\partial z}\right)$$=-\frac{\partial p}{\partial x}+\rho g_{x}$$+\mu\left(\frac{\partial^{2} u}{\partial x^{2}}+\frac{\partial^{2} u}{\partial y^{2}}+\frac{\partial^{2} u}{\partial z^{2}}\right)$ (2)
$\rho\left(\frac{\partial v}{\partial t}+u \frac{\partial v}{\partial x}+v \frac{\partial v}{\partial y}+w \frac{\partial v}{\partial z}\right)$$=-\frac{\partial p}{\partial y}+\rho g_{y}+\mu\left(\frac{\partial^{2} v}{\partial x^{2}}+\frac{\partial^{2} v}{\partial y^{2}}+\frac{\partial^{2} v}{\partial z^{2}}\right)$ (3)
$\rho\left(\frac{\partial w}{\partial t}+u \frac{\partial w}{\partial x}+v \frac{\partial w}{\partial y}+w \frac{\partial w}{\partial z}\right)$$=-\frac{\partial p}{\partial z}+\rho g_{z}+\mu\left(\frac{\partial^{2} w}{\partial x^{2}}+\frac{\partial^{2} w}{\partial y^{2}}+\frac{\partial^{2} w}{\partial z^{2}}\right)$ (4)
where, $\rho$ denotes the density of the blood, u, v, w represents the velocity in x, y, z direction, gi denotes the body force in the i-direction, and µ represents the blood dynamic viscosity.
Assumptions were made to simplify the fundamental equations to approximate the blood flow characteristic of the domain. For arterial blood flow, the assumptions were:
• The density of the blood remained constant and incompressible.
• The properties of the blood were estimated as non-Newtonian [11]. Most researchers modelled the blood as a Newtonian fluid and non-Newtonian when they numerically simulated the blood flow through the blood vessels. The assumption was justified due to the outstanding characteristics of the non-Newtonian flux effects in medical devices as previously reported [20-23].
• The body forces were negligible because the computational domain was short at 30 mm.
A set of supplementary conditions, known as boundary or initial conditions, are required to determine the arbitrary functions obtained from the integration of the governing equations for attaining a unique solution of the governing equations. Boundary conditions are requirements that the dependent variable or its derivative must fill concerning the boundaries of the domains of a problem.
Figure 2 shows the velocity profile in the systolic phase [24]. The results obtained showed the relation of the blood velocity with the pulsatile cyclic flow. The graphical representation of the pulsatile blood flow mathematical model was described according to Eq. (5). Additionally, the range of blood velocity in a human body when carrying out routine activities throughout the day are as follows:
$y=\left[\begin{array}{cc}9270.21 t^{5}-12618.9 t^{4}+6302.01 t^{3} \\ -1350.92 t^{2}-8.83 t & t<0 ; 0.36 s \\ 2.25 t-0.855 & t<0.36 ; 0.38 \mathrm{~s} \\ 0 & t<0.38 ; 0.8 s\end{array}\right.$ (5)
Figure 2. Relationship between the blood flow velocity in the ventricle and time [24]
From Eq. (5), the maximum velocity was recorded at 1 m/s, as shown in Figure 2. A number of varying time step sizes were investigated to simulate the unsteady flow for 0.8 s as the simulation was time-dependent [24]. The standard k $\omega$ model assumed a numerical simulation of turbulent blood flow. The blood was presumed incompressible, and the Carreau model was used to simulate the non-Newtonian blood flow. Furthermore, the Carreau model adhered to the following forms [20]:
$\mu(S)=\mu_{\infty}+\left(\mu_{0}-\mu_{\infty}\right)\left(1+(\lambda S)^{2}\right)^{\frac{(n-1)}{2}}$ (6)
where, μ∞=0.00345 Pa.s, and μo=0.056 Pa.s are the infinite shear viscosity and the viscosity of blood at zero shear rate respectively, λ represents the relaxation time constant (λ=3.313 s) and n=0.3568.
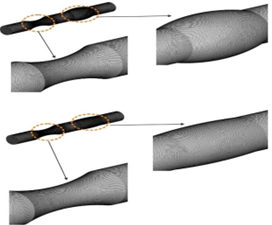
Figure 3. Finite volume model discretization for the damage blood vessels
The solution to the unsteady NS equations was obtained from a commercially licensed CFD software (ANSYS FLUENT 2019 R2) based on the finite volume method [25]. Figure 3 shows the discretised computational domain, which displayed 1,247,411 curvilinear tetrahedral cells in a grid system. Pressure-velocity coupling of the current 3-D Turbulent CFD model was attained by applying the SIMPLEC algorithm. Subsequently, spatial discretisation was second-order upwind, and the second-order implicit scheme was applied in time by employing the Green–Gauss cell-based scheme to reconstruct the gradients [26].
As previously mentioned, equation 5 represented the pulsed blood flow of the findings, which were utilised as mesh independence in determining the best mesh number for the simulation. A mesh independence study was carried out to select the ideal number of cells based on blood velocity values. Moreover, a mesh convergence study was carried out to determine the optimal number of mesh used in the simulation.
In the current study, by using ANSYS Mesh Workbench [25], five detach mesh was produced to recognize resolution of the spatial mesh as illustrated in Table 2.
Table 2. Information of mesh models
|
Mesh |
M1 |
M2 |
M3 |
|
Nu. of cell |
937,199 |
1,030,919 |
1,134,011 |
|
Mesh |
M4 |
M5 |
|
|
Nu. of cell |
1,247,411 |
1,372,153 |
|
When the model mesh M5=1,372,153 cells was employed, the maximum blood velocity obtained was 0.192 m/s. When the number of elements was decreased to M4=1,247,411 cells, the maximum difference in blood flow velocity with M1 was 0.194 m/s, and the difference between M4 and M5 was 1%. However, when the number of elements was decreased further, M3 = 1,134,011 cells, the maximum difference between M3 and M5 at maximum velocity was 14%. Subsequently, when M2 with 1,030,919 elements was used, the maximum difference between M2 and M5 was 22%. Finally, when the mesh M1 with 937,199 cells was employed, the maximum difference in blood flow velocity compared to M5 was 30%.
Figure 4. Mesh independence in this study
The results showed that the deviation between M5 and M4 was 1%, which was very small. Therefore, the study utilised 1,247,411 elements to simulate the damaged blood vessels (stenosis and aneurysm) and implement blood flow analysis, as shown in Figure 4.
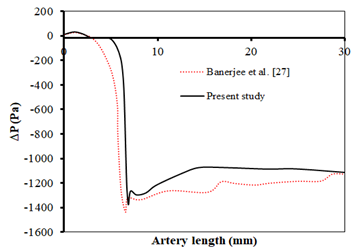
A numerical CFD model was developed for the blood flow domain. The model was validated against the experimental results conducted by Banerjee et al. [27]. Comparisons of pressure drops in the stenotic vessels were applied to validate the model, using the measured pressure drops reported by Banerjee et al. [27]. Consequently, Figure 5 compares the current CFD results with previous reports concerning the areas of stenosis in blood vessels during systolic phases.
A placid simulation of 5 mL/min was utilised to validate the current work. Furthermore, the numerical results acquired were compared to similar articles previously published [27]. Figure 5 shows the comparison between the results of axial pressure drop and the numerical values reported by Kadhim et al. [26]. The deviation of the current experimental results from the figures they were compared to was 4% at 6.4 mm from the stenosis. Therefore, the current experimental results reasonably agreed and supported the figures reported by Banerjee et al. [27].
Figure 5. Comparison of the present study result with previous published data of Banerjee et al. [27], pressure drop shown is through the area stenosis in damaged blood vessels
5.1 Wall shear stress from blood flow
Numerous studies have focused on the relationship between blood shear stress and the proliferation of arterial diseases [11]. It is for this reason that shear stress will be discussed for its clinical significance. In this study, two models of blood flow, one of them is Newtonian and the other is non-Newtonian blood flow, such as the Carreau model.
Figure 6 illustrates the distribution of wall shear stress during the four phases of the Carreau model's flow cycle. Based on these findings, four transition sites were observed, resulting from geometric changes in the stenosis aneurysm regions and from the singular effects of the solution. In comparison to the Newtonian model, the Carreau model showed considerably greater wall shear stress (4%-14%). The higher overall wall shear stress was because of more viscous blood near the walls, as wall shear stress corresponds to blood viscosity. Furthermore, the wall shear stress was more noticeable in the areas at a distance from the stenosis. The observations supported another investigation [28] that noted similar wall shear stress behaviours when the Carreau and the Newtonian models were compared. Additionally, the non-Newtonian effects were found to influence the difference in overall magnitude. The most significant change with the start acceleration flow was therefore found. The general form of the vessel during the flow cycle was nonetheless consistent.
(a) Start acceleration flow
(b) Peak flow
(c) Start deceleration flow
(d) Final times of the flow cycle
Figure 6. A walls shear stress distribution at start acceleration flow, peak flow, deceleration starts and final flow durations for the Carreau and Newtonian models along their axial distances
Figure 7 shows the distribution of blood flow shear stress within the radial, axial, and circumferential directions of the small arteries' stenosis and aneurysm areas at peak flow. The distributions of blood flow shear stresses were not notably varied for the entire time phase except for the magnitudes, which indicated that only stresses at one time (peak flow) are presented. Figure 7 shows significant blood shear stress aggregations around the centre of the stenosis and shoulder areas of the aneurysm. Consequently, the maximum axial shear stress was therefore somewhat greater than the maximum tangential shear stress. Solution singularity around the stenosis area due to the significant bending moment in the region and the shift from a thick wall to a thin wall had caused the phenomenon. The observations differed from previously reported results, mainly because of the types of elements employed in the solid models (blood vessels). However, similar trends were obtained when the results were compared to preceding investigations. The current study found that the aneurysm regions had the slightest blood shear stress concentrations in all directions due to wall thickness. Furthermore, a greater shear stress concentration has been found, mainly due to the considerable the stenosis of the blood vessels, approaching the vessel walls in the tangential direction. Undoubtedly, significant internal pressure on a cylinder would result in sizeable circumferential shear stress but relatively modest axial shear stress [29]. The singularity was caused by the more deformed nature of the stenosis areas than the other areas, which caused a visible 'stretching' effect that produced higher axial shear stresses. On the other hand, the regions around the aneurysm were not as deformed as the other regions compared with the stenosis areas. Therefore, radial shear stresses were relatively smaller than the other regions. However, the areas were prone to have higher shear stresses in the outer portions of the wall. All observations were consistent with the idea of the thick wall.
Figure 7. Wall shear stress contour distributions at the different area stenosis and aneurysm region at peak flow (t/$\tau$=0.13)
5.2 Blood Hydrodynamics Investigation
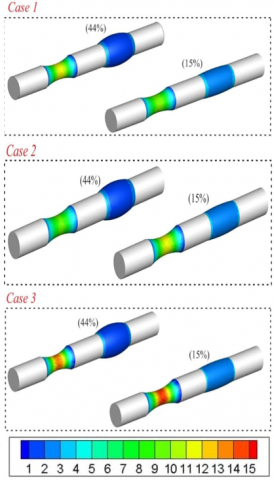
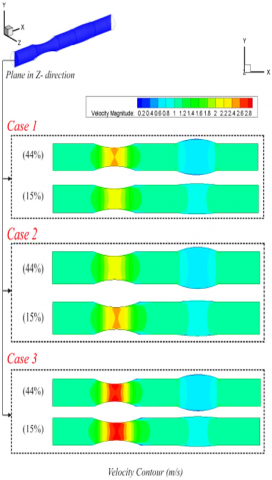
Figures 8 and 9 show the displacements that occurred at the stenosis and aneurysm points of the diseased blood vessels. Additionally, analysis of the influence of the types and degrees of pathologies on blood pressure and velocity was carried out for different stenosis and aneurysm cases. In case 1, the blood vessels had 70% stenosis and 44%, 15% aneurysm, while case 2 represented 80% stenosis and 44%, 15% aneurysm, and case 3 had 90% stenosis and 44%, 15% aneurysm.
5.2.1 Velocity profile
Figure 8. Velocity contour in different area stenosis and different arterial aneurysm
Primary parameters determining blood haemodynamics include velocity distribution within the domain and pressure drop caused by blood flow in the blood vessels. Figure 8 shows the velocity magnitudes, while Figure 9 presents the pressure drop figures. Moreover, Figure 8 shows the blood flow velocity of the damaged areas (stenosis and aneurysm). In case 1, the velocity approached 2.5 m/s and 0.65 m/s at 70% stenosis and 44% aneurysm ratios, respectively. However, the velocity in the 70% stenosed region and the 15% aneurysm area approached 2.1 m/s and 0.9 m/s, respectively. The blood velocity in case 2 peaked at 2.6 m/s at 80% stenosis ratio with 44% and 45% aneurysm ratios. Given that the blood flow observed included stenosis and aneurysm, the results displayed a recirculation region that occurred during the sudden expansion of the stenosis and outlet of the sharp aneurysm ratio. Therefore, the probability of blood clotting in the damaged areas was higher than in native arteries, as reported by earlier studies. However, the current study results illustrated that the recirculation at the sudden expansion shown in Figure 8 reduced the possibility of blood clotting in small arteries. In case 3 (90% stenosis ratio), the velocity magnitude for blood flow at the stenosis reached 2.8 m/s, while the blood velocity remained constant within the aneurysm areas. The blood flow recorded high velocity values in the 90% stenosed blood vessel because of the region's small size and the fast exit flow from the aneurysm areas. Additionally, a noticeable flow recirculation was observed at the sudden expansion of the arteries. Furthermore, increased velocity was recorded with increased stenosis area, which might lead to blood clotting within the arteries. Prior investigations reported that jet flow led to extreme blood cell damage that caused coagulation and hemolysis [26].
5.2.2 Pressure gradient
The pressure gradient distributions in the stenosis and aneurysm regions are shown in Figure 9, while the pressure distribution over time of the Carreau model is shown in Figure 8. Based on the results, the pressure gradient was maximum at the stenosis outlet regions and the beginning of the aneurysm inlets. Furthermore, a featured pressure gradient at the inlet and outlet blood vessels will provide the necessary momentum for the blood flow to accelerate in the corresponding phase. Subsequently, the blood encountered a slight unfavourable pressure gradient at the stenosis inlets and the inlet (sharper) of the aneurysm during the deceleration phase.
The pressure levels did not differ substantially from the outlet pressure indicated of 200 Pa, even though the pressure gradient was noticeable. Another distinguishable attribute was the sharp drop in pressure throughout the stenosis areas, where the pressure gradient was approximately 200 Pa. While it did not appear as significant as the peak in a wall stress distribution, in all cases it was examined that the highest pressure gradient via the stenosis outlets occurred within the range of 800–1000 Pa. Notably, the stenotic regions showed pressures higher than the outlet pressures. Therefore, under particular conditions, it might fairly be expected that stenosis collapses were quite likely, involving low outlet pressure or greater stenosis severity. However, only some typical cases that showed pathological blood vessel cracking risks were discussed in the current work.
According to the results, the significant increase in velocity, pressure, and blood shear stresses within the pathological areas was representative of all types and degrees of damages. Additionally, the velocity, pressure, and blood shear stresses depended on the pathology's type and degree of damaged blood vessel. For example, the maximal velocity within the damaged area (stenosis) was increased by the rate of stenosis, where the velocity was increased to up to 3.4 times (Figure 8), while the blood shear stresses increased up to 8.4 times, when start acceleration flow and peck flow were compared (Figure 6).
It was found that in both stenosed and aneurysm blood vessels, the blood pressure and shear stress were maximum within the damaged areas, which might contribute to cracks in the blood vessels. Furthermore, aneurysms significantly alter blood vessel structures and reduce their strength. Therefore, significantly lower blood pressure and stress could be more hazardous to the damaged blood vessels than in other cases.
Figure 9. Pressure gradient for the Carreau model in the complete flow cycle along the vessel wall
A numerical CFD (FLUENT) simulation model was developed for the blood flow domain in the damaged areas. The results were validated against the experimental figures reported by previous literature. Based on the results, a quantitative comparison between the present study and previous studies about blood pressure in stenosis showed reasonable agreement with a deviation of 10%. Furthermore, the stenosis areas recorded maximum blood velocity, blood pressure, and shear stress values except in the aneurysm cases. In the presence of the highest pathology degree (90%), the maximum blood velocity values increased by up to 3.4 times and the wall shear stresses by 8.4 times. In the aneurysm cases, blood velocity peaked in the middle regions of the pathology, and shear stresses were the highest in the exit areas, and their values depended on the aneurysm degree. The values were observed when the aneurysm was up to 144%. When pathology degree was at 70%, the CFD simulation enabled the determination of minimal variations in blood velocity, pressure, and shear stresses, and human employability did not decrease. Moreover, the degree of damage of the blood vessels showed the most considerable influence on local blood pressure and shear stresses. However, stenosis at 90% is likely to result in severe lesions, which in turn will block blood flow completely due to the resultant thrombus.
[1] Schulze-Bauer, C.A.J., Holzapfel, G.A. (2003). Determination of constitutive equations for human arteries from clinical data. Journal of Biomechanics, 36(2): 165-169. https://doi.org/10.1016/S0021-9290(02)00367-6
[2] Kleinstreuer, C., Li, Z., Farber, M.A. (2007). Fluid-structure interaction analyses of stented abdominal aortic aneurysms. Annual Review of Biomedical Engineering, 9(1): 169-204. https://doi.org/10.1146/annurev.bioeng.9.0609
[3] Pickering, T.G. (2002). Principles and techniques of blood pressure measurement. Cardiology Clinics, 20(2): 207-223. https://doi.org/10.1016/s0733-8651(01)00009-1
[4] Pannier, B.M., Avolio, A.P., Hoeks, A., Mancia, G., Takazawa, K. (2002). Methods and devices for measuring arterial compliance in humans. American Journal of Hypertension, 15(8): 743-753. https://doi.org/10.1016/s0895-7061(02)02962-x
[5] Biswas, D., Chakraborty, U.S. (2010). Two-layered pulsatile blood flow in a stenosed artery with body acceleration and slip at wall. Applications and Applied Mathematics: An International Journal (AAM), 5(2): 303-320.
[6] Singh, A.K., Singh, D.P. (2012). A computational study of Bingham plastic flow of blood through an artery by multiple stenosis and post dilatation. Advances in Applied Science Research, 3(5): 3285-3290.
[7] Shukla, J.B., Parihar, R.S., Rao, B.R.P. (1980). Effects of stenosis on non-Newtonian flow of the blood in an artery. Bulletin of Mathematical Biology, 42(3): 283-294. https://doi.org/10.1016/s0092-8240(80)80051-6
[8] Prakash, O., Makinde, O.D., Singh, S.P., Jain, N., Kumar, D. (2015). Effects of stenoses on non-Newtonian flow of blood in blood vessels. International Journal of Biomathematics, 8(01): 1550010. https://doi.org/10.1142/s1793524515500102
[9] Mallik, B.B., Nanda, S., Das, B., Saha, D., Das, D.S., Paul, K. (2013). A non-Newtonian fluid model for blood flow using power-law through an atherosclerotic arterial segment having slip velocity. International Journal of Pharmaceutical, Chemical & Biological Sciences, 3(3): 752-760.
[10] Sreenadh, S., Pallavi, A.R., Satyanarayana, B.H. (2011). Flow of a Casson fluid through an inclined tube of non-uniform cross section with multiple stenoses. Advances in Applied Science Research, 2(5): 340-349.
[11] Reddy, M.S., Reddy, M.S., Reddy, B.J., Ramakrishna, S. (2012). Effect of variable viscosity on the peristaltic flow of a Jeffrey fluid in a uniform tube. Advances in Applied Science Research, 3: 900-908.
[12] Kadhim, S.K., Al-Azawy, M.G., Ali, S.A.G., Kadhim, M.Q. (2021). The influence of non-Newtonian model on properties of blood flow through a left coronary artery with presence of different double stenosis. International Journal of Heat and Technology, 39(3): 895-905. https://doi.org/10.18280/ijht.390324
[13] Hayat, T., Ali, N., Asghar, S., Siddiqui, A.M. (2006). Exact peristaltic flow in tubes with an endoscope. Applied Mathematics and Computation, 182(1): 359-368. https://doi.org/10.1016/j.amc.2006.02.052
[14] Abd-Alla, A.M., Abo-Dahab, S.M., Albalawi, M.M. (2014). Magnetic field and gravity effects on peristaltic transport of a Jeffrey fluid in an asymmetric channel. In Abstract and Applied Analysis, 1-11. https://doi.org/10.1155/2014/896121
[15] Tombetti, E., Godi, C., Ambrosi, A., et al. (2018). Novel angiographic scores for evaluation of large vessel vasculitis. Scientific Reports, 8(1): 1-11. https://doi.org/10.1038/s41598-018-34395-7
[16] korotkikh, A.V., Nekrasov, D.A., Khilchuk, A.A., Scherbak, S.G., Sarana, A.M. (2020). Simultaneous internal carotid artery stenosis and ipsilateral anterior communicating artery saccular aneurysm treatment: A case report. Radiology Case Reports, 15(7): 1083-1086. https://doi.org/10.1016/j.radcr.2020.05.010
[17] Zaman, A., Ali, N., Anwar Bég, O. (2015). Numerical simulation of unsteady micropolar hemodynamics in a tapered catheterized artery with a combination of stenosis and aneurysm. Medical & Biological Engineering & Computing, 54(9): 1423-1436. https://doi.org/10.1007/s11517-015-1415-3
[18] Kamangar, S., Badruddin, I.A., Ahamad, N.A., Govindaraju, K., Nik-Ghazali, N., Ahmed, N.J., Badarudin, A., Khan, T.M. (2017). The influence of geometrical shapes of stenosis on the blood flow in stenosed artery. Sains Malaysiana, 46(10): 1923-1933. https://doi.org/10.17576/jsm-2017-4610-31
[19] Al-Azawy, M.G., Kadhim, S.K., Hameed, A.S. (2020). Newtonian and non-Newtonian blood rheology inside a model of stenosis. CFD Letters, 12(11): 27-36. https://doi.org/10.37934/cfdl.12.11.2736
[20] Al-Azawy, M.G., Turan, A., Revell, A. (2017). Investigating the impact of non-Newtonian blood models within a heart pump. International Journal for Numerical Methods in Biomedical Engineering, 33(1): e02780. https://doi.org/10.1002/cnm
[21] Molla, M.M., Paul, M.C. (2012). LES of non-Newtonian physiological blood flow in a model of arterial stenosis. Medical Engineering & Physics, 34: 1079-1087. https://doi.org/10.1016/j.medengphy.2011.11.013
[22] Johnston, B.M., Johnston, P.R., Corney, S., Kilpatrick, D. (2004). Non-Newtonian blood flow in human right coronary arteries: Steady state simulations. Journal of Biomechanics, 37(5): 709-720. https://doi.org/10.1016/j.jbiomech.2003.09.016
[23] Carreau, P.J. (1972). Rheological equations from molecular network theories. Transactions of the Society of Rheology, 16(1): 99-127. https://doi.org/10.1122/1.549276
[24] Wu, Q.Y., Liu, X.J., Pan, L.J., Tao, W.G., Qiu, C.Q. (2017). Simulation analysis of blood flow in arteries of the human arm. Biomedical Engineering: Applications, Basis and Communications, 29(4): 1-8. https://doi.org/10.4015/S1016237217500314
[25] Inc A. ANSYS FLUENT theory guide 2018:Release 19.1.
[26] Kadhim, S.K., Nasif, M.S., Al-Kayiem, H.H., Al-Waked, R. (2018). Computational fluid dynamics simulation of blood flow profile and shear stresses in bileaflet mechanical heart valve by using monolithic approach. Simulation, 94(2): 93-104. https://doi.org/10.1177/0037549717712603
[27] Banerjee, R.K., Back, L.H., Back, M.R., Cho, Y.I. (2003). Physiological flow analysis in significant human coronary artery stenoses. Biorheology, 40(4): 451-476
[28] Johnston, B.M., Johnston, P.R., Corney, S., Kilpatrick, D. (2004). Non-Newtonian blood flow in human right coronary arteries: steady state simulations. Journal of Biomechanics, 37(5): 709–720. https://doi.org/10.1016/j.jbiomech.2003.09.01
[29] Lee, K., Xu, X. (2002). Modelling of flow and wall behaviour in a mildly stenosed tube. Medical Engineering & Physics, 24(9): 575-586. https://doi.org/10.1016/s1350-4533(02)00048-6