Olga Grigoreva* | Elena Runova | Tamara Storodubtseva | Alina Urazova | Anna Voronova | Viktor Ivanov | Viktoria Shvetsova | Igor Grigorev
© 2022 IIETA. This article is published by IIETA and is licensed under the CC BY 4.0 license (http://creativecommons.org/licenses/by/4.0/).
OPEN ACCESS
Thinning treatment is a necessary and complex forestry activity. The experimental results from plantations established 20-30 years ago and explains some concepts of the theory, practice, methods, and regime of thinning on the permanent sample plots of pine stands in Gatchinsky forestry of the Leningrad region were shown in this article. Choosing the right thinning method allows to optimize the yield, productivity and mortality of the stand. On the other hand, we observed improved merchantability of the stand, reduced time for forestation, and simplified thinning programs. Crown thinning is a less preferred method than bottom thinning, as it leads to a deterioration in the quality of trees and an increase in their mortality. The inexpediency of preliminary thinning of trees has been established. Tree thinning results in an improvement in the quality of the remaining stand, as nutrient utilization is greatly increased. Tree thinning must necessarily be combined with fertilization. Thinning without fertilization and fertilization without thinning show the worst results. In general, findings of this article can be used to improve approach of thinning treatment in the Leningrad or other regions in the North of Russian Federation.
forest management practices, forest stand, selective thinning, silviculture
The thinning treatment has been the subject of many scientific studies in forestry for a long time [1]. It is known that its yield and quality depend on the proper care of the forest. One of the most effective methods of forest care, which has been known for several centuries, is its thinning [2]. Reducing plantation density causes an increase in plant biomass by increasing tree diameter. It is important to consider the number of cuttings, because exceeding the cutting limit can lead to a significant reduction in the yield [3].
Recently, especially in Europe, there has been a switch from the main function of forests as a source of timber to the conservation of forest areas in order to maintain environmental balance [4].
The works [5-7] present the results of experiments with different types of forest trees in Central Europe and other regions of the world. Research on tree thinning methods has focused primarily on wood yield and tree growth, as well as their yield and geometric dimensions. It should be noted that the impact of tree thinning on the environment has been studied very little [8, 9], although long-term experiments can fill the gaps in such aspects as carbon formation and climate change [9].
It is known that The Scots pine (Pinus sylvestris L.) is the most widespread species of coniferous plants in Northern Europe. Many researchers are still arguing about the methods of thinning this type of tree, in particular, the predominance of the upper or lower type of thinning [12, 13].
Sometimes in the scientific literature the results of works on the use of a mixed approach are presented. In addition, methodological recommendations are being developed for the practical use of thinning technology [14]. There is also a strong opinion that thinning does not significantly affect the yield of wood. [4]. On the other hand, there is an opinion that thinning trees can significantly increase their yield [15]. Moreover, this is influenced by the type of pine, the geographical area, the resistance of the pine to environmental changes [16], and differences in the experimental planning and thinning methods used [17].
Some scientists express the opinion about the possibility of stable growth of trees after they reach 20-30 years of age, while others argue that thinning should be carried out only on young trees [18]. Moreover, there are recommendations for thinning trees to improve their selection [19]. However, in our opinion, only long-term experiments can give a clear answer about the benefits of tree thinning.
Based on the foregoing, based on many years of research on thinning pine plantations, we will outline the positive and negative aspects of both methods.
The study purpose was to analyze the results of thinning established 20-30 years ago and specify some theories, practices, methods, and regimes of thinning in the pine stands of Gatchinsky forestry in the Leningrad region. In our opinion, the results obtained during the implementation of this study can be used to assess the impact of thinning and fertilization of pine plantations. The studying included the following tasks:
1. Investigations the influence of thinning treatment on the age dynamics of pine.
2. Investigations the processes of tree formation, change in tree diameter class during growth, and the effect of different thinning methods on these processes.
3. Economic efficiency of thinning and fertilizing the soil.
The above will allow the development of guidelines for the care of pine plantations in the Leningrad region of the Russian Federation.
2.1 FIM (forest inventory method)
Methods of partial forest inventory are used for large forest inventories. For this purpose, the inventory was used only on certain, typical part of it (site with consideration of age and species predominance of plants). During partial forest inventory scientists receive such data per 1 ha as: stock, the sum of the cross-sectional areas; number of trunks. The method of permanent sample plots (PSP) was used in this study.
The start of investigations was in 1971 on the plantations that were more 70 years old. We can say that we investigated the impact of thinning in details.
In this study, approximately every five years, a continuous forest assessment was carried out at PSPs. A hypsometer was used for measurements that were conducted in 5 years (because this is the minimum time to show stable differences between plants) with measurements of diameters of all accounting trees in the same places, in particularly North-South, West-East, and with measurements one of tenth trees.
In the course of the research, such indicators as: the growth rate of the forest stand, the dynamics of decline, the increase in diameter, height and stock were studied. It should be noted that the studied samples were characterized by a protective strip from 20 to 30 m.
The role of thinning in estimating wood yield was assessed by comparison with non-thinned plots.
We determined such parameters as species, age, average diameter, average height, total stock, and merchantability.
The age (average) was calculated according to the diameter class of the trees:
$A_{a v}=\frac{\left(A_{1} g_{1}+A_{2} g_{2}+\cdots+A_{n} g_{n}\right)}{g_{1}+g_{2}+\cdots+g_{n}}$ (1)
where, $A_{1}$, $A_{2}$, …, $A_{n}$– average age of trees, years; $g_{1}$, $g_{2}$, ..., $g_{n}$– cross-sectional areas of trees, m2. The average age in forest inventory is calculated with the accuracy of 1 year.
The diameter (average) was calculated as the trunk`s diameter, the area of which is equal to the average calculated from a sample of trees, and is calculated by the formula:
$D_{a v}=2 \sqrt{\frac{g_{a v}}{\pi}}$ (2)
$g_{a v}=\frac{\left(n_{1} g_{1}+n_{2} g_{2}+\cdots+n_{n} g_{n}\right)}{n_{1}+n_{2}+\cdots+n_{n}}$ (3)
where, $n_{1}$, $n_{2}$, ..., $n_{n}$– the number of trees.
Density (absolute) per 1 ha of forest is determined by, $m^{2} / h a$:
$G=\frac{\sum_{i=1}^{n} n_{i} g_{i}}{S}$ (4)
where, S – sample plot area, ha.
The exact value of the average height (up to 0.1 m) was determined by the formula:
$H_{a v}=\frac{\left(h_{1} g_{1}+h_{2} g_{2}+\cdots+h_{n} g_{n}\right)}{g_{1}+g_{2}+\cdots+g_{n}}$ (5)
where, $h_{1}$, $h_{2}$,…, $h_{n}$– heights of trees with different diameters, m.
The stock of the forest unit (M) was calculated by the formula:
$M=\frac{G \sum_{i=1}^{k} V_{i}}{\sum_{i=1}^{k} g_{i}}$ (6)
where, $V_{i}$– the volumes of the i-th accounting trees, m3; gi: cross-sectional areas of the i-th accounting trees, m2; k – the number accounting trees.
The yield dynamics of trees was estimated by the change in their diameter, in particular, the following formula was used:
Z=D-d (7)
where, D – diameter of tree trunk at 1.3 m height at the finish of the experiment; d – diameter of tree trunk at 1.3 m height, set at the start of the experiment.
Relative tree growth (P) rate and the relative diameter (R) were calculated according to formulas (8) and (9):
$P=\frac{200}{n} \frac{R^{y}-(R-1)^{y}}{R^{y}+(R-1)^{y}}$ (8)
$R=\frac{D}{Z}$ (9)
The diameter class (y) is defined as:
$y=2+\frac{\log H-\log h}{\log D-\log d}$ (10)
where, H and h: values of average height (m) at the current time and at the beginning of the observation period (n years ago), respectively.
In accordance with GOST 18264-72 [20] the current growth of stands was determined. On the basis of the age and height of the dominant species of the upper layer the bonitet class was determined. The average height $H_{a v}$ of the stands at the corresponding age was the classification attribute of the bonitet scale [21].
We used Excel 2013 for data processing and study of dependencies.
2.2 Research object features
We carried out a comprehensive study of pine plantations (series 5 and 6), which were planted in the conditions of the Gatchinsky forestry enterprise in 1971. The area of each plot was not less than 0.2 ha. During the experiment, the type of thinning (crown or bottom), quantity and quality of fertilizers varied. All results obtained were compared with the control plot. Reportedly, in the low thinning, a single-tier stand is formed with horizontally closed crowns [21]. In the method of crown thinning, much attention is paid to the best species with an even, more full-grown trunk. To improve the growth of healthy trees, trees with drooping crowns and large diameter trunks are cut down. To increase the growth of large and medium trees, they must be fertilized with mineral fertilizers. According to [22], at the first stage, it is necessary to apply nitrogen-phosphorus fertilizer in the amount of 100-200 kg/ha, after intermediate thinning - potash fertilizer in the amount of 100-150 kg/ha and after that only nitrogen fertilizer in the amount of 90-120 kg/ha with an interval of 10 years [22].
Series 5 was planted among a drained pine stand 43 years ago. The composition of the stand consists of a pure single-age pine plantation and less than 2% of the birch. Soil type in the forest: iron-illuvial sand podzol. The series 5 consists of 3 PSP: control (5-1), low-thinned (5-2), and for low-thinned and double-fertilized (5-3). The results of calculating taximetric parameters of these plots are presented in Table 1.
Series 6 trees were planted among the pines. Planting age - 36-45 years. It has been established that these trees consist almost entirely of pine and about 2% of birch. The soil in this area is predominantly humus-ferruginous-podzolic. Series 6 includes 7 plots, namely: slightly sparse (6-2), control (6-3), control + fertilized (6-4), slightly sparse with fertilizers (6-5), crown-sparse (6-7), crown-sparse (6-8), few ruby (6-9). Table 1 shows the characteristics of these areas.
2.3 Characteristics of Gatchinsky Forestry
The Gatchinsky forestry area is located 70 km south of St. Petersburg in the western region of the southern taiga subzone. On the territory of the Gatchinsky forestry, coniferous trees mainly grow.
In general, the climate of the district is characterized as moderate. The territory of the Gatchinsky forestry is characterized by a flat relief and windy weather, with the wind direction predominantly towards the southwest, west and south. The Gatchinsky forestry mainly grows such trees as pine, spruce and birch, which are characterized by the second (II) bonitet.
Table 1. Parameter values
|
PSP |
$A_{a v}$, years |
$V_{\text {total }}$ $m^{3} / h a$ |
Remaining part |
Thinned part |
||||||||||
|
$\mathrm{H}_{a v}$, m |
$\mathrm{H}_{\max }$, m |
Quality class |
$D_{a v}$, m |
N, pcs/ha |
G, $m^{2} / h a$ |
V, $m^{3} / h a$ |
Year of thinning |
Volume fraction of thinning, % |
G, $m^{2} / h a$ |
V, $m^{3} / h a$ |
Incl. dry |
|||
|
5-1 |
43 |
202 |
15.5 |
17.1 |
I |
0.139 |
1555 |
23.8 |
190 |
1971 |
6 |
2.1 |
12 |
|
|
5-2 |
43 |
202 |
16.2 |
17.3 |
I |
0.145 |
885 |
14.7 |
119 |
1971 1981 |
41 15 |
10.6 |
83 |
|
|
5-3 |
43 |
200 |
16.7 |
17.4 |
I |
0.163 |
775 |
16.2 |
132 |
1971 1981 |
34 14 |
8.5 |
68 |
|
|
6-2 |
36 |
179 |
14.1 |
15 |
II |
0.15 |
835 |
14.7 |
108 |
1971 1981 |
36 6 |
9.7 |
71 |
10 |
|
6-3 |
36 |
189 |
12 |
15.5 |
II |
0.112 |
2685 |
26.5 |
176 |
- |
- |
2.0 |
13 |
13 |
|
6-4 |
40 |
182 |
12.4 |
15.6 |
II |
0.119 |
2350 |
26.2 |
179 |
- |
- |
0.6 |
3 |
3 |
|
6-5 |
40 |
197 |
13.9 |
15.6 |
II |
0.154 |
925 |
17.3 |
126 |
1971 |
32 |
11.4 |
71 |
13 |
|
6-7 |
45 |
234 |
14.6 |
16.5 |
II |
0.143 |
1225 |
19.5 |
150 |
1971 |
41 |
12 |
84 |
22 |
|
6-8 |
45 |
198 |
15.5 |
17.5 |
II |
0.167 |
750 |
16.4 |
132 |
1971 |
28 |
10.1 |
66 |
11 |
|
6-9 |
45 |
246 |
16.4 |
17.7 |
II |
0.188 |
505 |
14 |
114 |
1971 |
49 |
18.6 |
132 |
21 |
3.1 Age dynamics of trees
The characteristics of permanent inventory areas at the time of their sampling and research are presented in Table 2.
Analyzing the data given in Tables 1 and 2, we can conclude that in almost all areas there is an increase in the quality class of samples. In particular, trees in plots 5-2 and 5-3 upgraded their class to Ia, plots 6-2, 6-3, 6-4 and 6-8 to I, and samples in plots 6-5, 6-7 and 6-9 to Ia. Consequently, reducing the number of trees and fertilization positively affect the forest inventory indicators. They lead to an increase in stand biomass and plant height, which is associated with greater accessibility to resources (water, trace elements, sunlight).
Analyzing the data given in Table. 2, it can be stated that such an indicator as the average diameter of trees is closely correlated with their thinning. The less densely the trees are, the larger their trunks. On the example of samples (5-2) and (5-3), as well as (6-5) and (6-9), it can be argued that thinning leads to a significant increase in the trunk diameter compared to the control (6-3) and (5-1) sections. It can be noted that mixed tillage (6-5) gives much better results than simple fertilization without thinning (6-4).
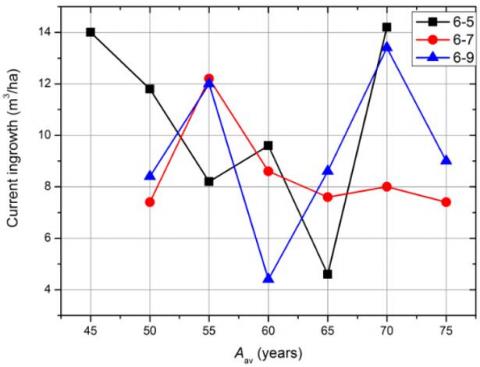
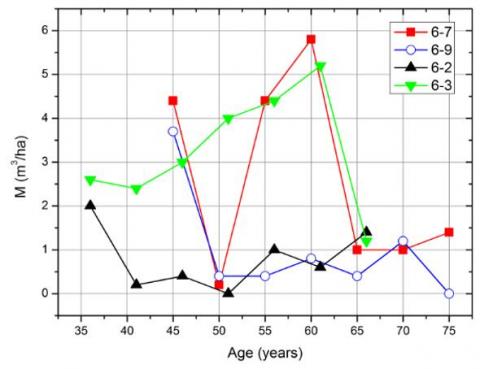
Figure 1. Change of the current ingrowth rate by years
Comparing the data of Tables 1 and 2, it can be seen that sections (5-3) and (6-8) are characterized by the best results in terms of average and upper height. The absolute planting density G increased to 0.9 and 0.7 in plots (5-3), (6-9) and (5-2) due to double thinning, respectively. Table 3 shows the results of changing the value of G in sections (6-7) and (6-9).
Analyzing the data given in Table. 3, it can be stated that for 30 years the indicator G for sections (6-7) and (6-9) has practically approached and amounted to 28.8-29.7 $m^{2} / h a$.
The current ingrowth speed in sections (6-5), (6-7) and (6-9) is shown in Figure 1. Based on the above data, we can conclude that during the first 5 years there is an increase in samples with upper and lower thinning. After that, a sharp increase in the number of ingrowths is observed.
3.2 The effect of thinning on changes in pine tree diameter class
Table 4 shows the changes in tree diameter class in low-thinned and crown-thinned PSPs.
The data given in Table 4 show that at the end of the experiment, the trees are characterized by a large diameter, but their quality is significantly reduced. Despite this, it can be argued that crown thinning leads to a decrease in the number of large trees. Table 5 shows the results of determining tree mortality.
Based on the Table 5 data, it can be argued that tree samples with a size of 12 mm are characterized by the maximum mortality. It should also be noted that in thin plots, dead wood has developed among trees of the 16th diameter class, amounting to 20-46% of the total forest stand. Trees larger than 20 mm rarely die. The greatest death is observed in plots (5-1), (6-4) and (6-7), respectively 159, 145 and 108 tree samples.
Table 2. Final characteristics of sample plots (at the moment of experiment)
|
PSP |
$A_{a v}$, years |
$H_{a v}$, m |
$H_{m a x}$, m |
Quality class |
$D_{a v}$, m |
N, $p c s / h a$ |
G, $m^{2} / h a$ |
V, $m^{3} / h a$ |
Total yield, $m^{3} / h a$ |
|
5-1 |
74 |
26.5 |
28.1 |
I |
0.228 |
775 |
31.6 |
373 |
463 |
|
5-2 |
74 |
27 |
28.2 |
Iа |
0.258 |
600 |
26.5 |
311 |
461 |
|
5-3 |
74 |
27.4 |
29.2 |
Iа |
0.26 |
590 |
313 |
386 |
516 |
|
6-2 |
61 |
23.5 |
24.6 |
I |
0.221 |
675 |
26 |
288 |
382 |
|
6-3 |
66 |
23 |
24.8 |
I |
0.205 |
870 |
28.8 |
319 |
433 |
|
6-4 |
70 |
25 |
26 |
I |
0.224 |
795 |
31.4 |
355 |
475 |
|
6-5 |
70 |
27 |
28.9 |
Iа |
0.244 |
660 |
31 |
390 |
509 |
|
6-7 |
75 |
26.3 |
27.4 |
Iа |
0.238 |
665 |
29.7 |
337 |
490 |
|
6-8 |
75 |
28.6 |
30.5 |
I |
0.256 |
485 |
25 |
319 |
432 |
|
6-9 |
75 |
28.5 |
29.7 |
Iа |
0.28 |
465 |
28.8 |
377 |
525 |
Table 3. Dynamics of growth of the absolute density of stand G by years (every 5 years)
|
PSP |
Quality class |
$G$, $m^{2} / h a$ |
||||||
|
45 years |
50 years |
55 years |
60 years |
65 years |
70 years |
75 years |
||
|
6-7 |
II-Iа |
19.5 |
20.7 |
23.3 |
23.2 |
24.6 |
26.7 |
29.7 |
|
6-9 |
II-Iа |
14.0 |
16.7 |
20.5 |
21.9 |
23.7 |
26.0 |
28.8 |
Table 4. Quality assessment of pine samples
|
PSP |
Diameter class |
Number of trees at the beginning |
Eventual distribution of trees by diameter classes |
Remaining trees, pcs. |
Remaining trees, % |
|||||||
|
12 |
16 |
20 |
24 |
28 |
32 |
36 |
40 |
|||||
|
6-7 |
8 |
24 |
2 |
|
|
|
|
|
|
|
2 |
100 |
|
12 |
97 |
2 |
11 |
9 |
1 |
|
|
|
|
23 |
23 |
|
|
16 |
94 |
|
2 |
23 |
36 |
22 |
1 |
|
|
84 |
89 |
|
|
20 |
23 |
|
|
|
3 |
15 |
4 |
|
|
22 |
96 |
|
|
24 |
1 |
|
|
|
|
|
|
1 |
|
1 |
100 |
|
|
Total |
239 |
4 |
13 |
32 |
40 |
37 |
5 |
|
|
132 |
55 |
|
|
6-9 |
8 |
|
|
|
|
|
|
|
|
|
|
|
|
12 |
2 |
|
1 |
|
|
|
|
|
|
1 |
100 |
|
|
16 |
45 |
|
|
7 |
21 |
12 |
2 |
|
|
42 |
93 |
|
|
20 |
36 |
|
|
|
2 |
19 |
11 |
2 |
|
34 |
94 |
|
|
24 |
11 |
|
|
|
|
|
6 |
4 |
|
10 |
91 |
|
|
28 |
1 |
|
|
|
|
|
|
1 |
|
1 |
100 |
|
|
Total |
95 |
|
1 |
7 |
23 |
31 |
19 |
7 |
|
88 |
91 |
|
Table 5. Mortality distribution among diameter classes
|
PSP |
Diameter class, cm |
||||||
|
8 |
12 |
16 |
20 |
24 |
28 |
Total |
|
|
5-1 |
69/43 |
70/44 |
18/11 |
2/1 |
|
|
159 |
|
5-2 |
3/6 |
15/29 |
24/46 |
7/13 |
3/6 |
|
52 |
|
5-3 |
3/10 |
8/26 |
8/26 |
5/16 |
4/12 |
3/10 |
31 |
|
6-3 |
14/18 |
59/75 |
6/7 |
|
|
|
79 |
|
6-4 |
26/18 |
104/72 |
12/8 |
3/2 |
|
|
145 |
|
6-5 |
5/12 |
26/60 |
9/20 |
2/4 |
2/4 |
|
44 |
|
6-7 |
22/25 |
74/62 |
10/12 |
1/1 |
|
|
108 |
|
6-8 |
8/26 |
16/52 |
7/22 |
|
|
|
31 |
|
6-9 |
1/13 |
3/37 |
2/37 |
1/13 |
|
|
8 |
*numerator stands for the number of trees, and the denominator stands for % of the total number of trees.
3.3 Influence of the thinning on the quantity of pine samples
It is known that the total yield is the total amount of forest stand and felled trees. Productivity is the total yield minus mortality. Table 6 shows yield data depending on the age of the trees. It can be added that despite the different initial conditions (soil, thinning, amount of fertilizers), by a certain age, the yield of the samples we studied became almost the same.
Due to the small difference in the initial stock on the experimental plots at the beginning of planting, the leveling of yields is observed much faster.
Analyzing the data on plots (5-1), (5-2) and (5-3), it can be noted that with initial yields equal to 201-208 m3/ha, by the end of the reporting period, the yield increased to 461-464 m3/ha in plots (5-1) and (5-2). On the thinned and fertilized plot (5-3) there was a sharp increase in yield up to 516 m3/ha.
When comparing the yield of plots (6-1), (6-2) and (6-3), it can be noted that with an initial yield of 169-191 m3/ha at the end of the experiment, samples from a slightly sparse plot (6-2), namely, 448 m3/ha.
Comparing plots (6-4), (6-5) and (6-6) it can be noted that at the initial level of productivity at the level of 188-202 m3/ha, namely up to 509 m3/ha.
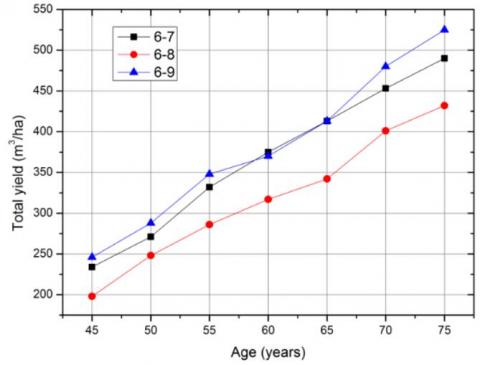
Comparing the data (Figure 2) on wood yield in plots (6-7), (6-8) and (6-9), it can also be noted that at the initial yield level of 207-247 m3/ha, at the end of the experiment, the wood yield increased to the maximum 525 m3/ha in case of several cuttings.
Figure 2. Age-related changes in total yield at low-thinned and crown-thinned sample plots
The yield of wood in a plot with a slight thinning of the crown is lower than in a plot with increased thinning.
Table 7 shows the results of yield and productivity of various experimental plots. Given in Table 7, the results of the experiment confirm the fact that intensive low thinning leads to higher yields and productivity compared to plots characterized by thinning only the upper part. Integrated treatment (6-5) is more effective than fertilization without thinning (6-4). The data obtained show that complex tillage leads to a significant increase in yield (by 7%) and productivity (by 30%) compared to the fertilized plot.
As for series 5, the experimental section with complex processing showed the highest productivity. Despite this, the productivity in the experimental plot after double thinning was lower than in the control. Based on this, we can conclude that the intensity of the first thinning is increased and the second is excluded.
There is no doubt that intensive thinning leads to a better use of nutrient resources [23-26].
Table 6. Age-yield dynamics on sample plots
|
Age, years |
Total yield of sample plots by sections |
|||||
|
5-1 |
5-2 |
5-3 |
||||
|
$m^{3} / h a$ |
% |
$m^{3} / h a$ |
% |
$m^{3} / h a$ |
% |
|
|
43 |
204 |
100 |
208 |
102 |
201 |
98 |
|
48 |
254 |
100 |
246 |
97 |
263 |
103 |
|
53 |
312 |
100 |
292 |
93 |
324 |
104 |
|
58 |
350 |
100 |
338 |
96 |
358 |
102 |
|
63 |
383 |
100 |
382 |
100 |
405 |
106 |
|
68 |
420 |
100 |
414 |
98 |
452 |
108 |
|
74 |
464 |
100 |
461 |
99 |
516 |
111 |
|
|
6-1 |
6-2 |
6-3 |
|||
|
36 |
169 |
88 |
188 |
98 |
191 |
100 |
|
41 |
208 |
82 |
227 |
90 |
252 |
100 |
|
46 |
239 |
86 |
266 |
95 |
279 |
100 |
|
51 |
275 |
86 |
290 |
91 |
318 |
100 |
|
56 |
304 |
83 |
341 |
93 |
368 |
100 |
|
61 |
359 |
88 |
391 |
96 |
408 |
100 |
|
66 |
|
|
448 |
104 |
433 |
100 |
|
|
6-4 |
6-5 |
6-6 |
|||
|
40 |
188 |
100 |
198 |
105 |
202 |
107 |
|
45 |
279 |
100 |
268 |
96 |
267 |
96 |
|
50 |
322 |
100 |
327 |
102 |
312 |
97 |
|
55 |
353 |
100 |
368 |
104 |
360 |
102 |
|
60 |
399 |
100 |
416 |
104 |
390 |
98 |
|
65 |
442 |
100 |
438 |
99 |
414 |
94 |
|
70 |
475 |
100 |
509 |
107 |
|
|
|
|
6-7 |
6-8 |
6-9 |
|||
|
45 |
247 |
88 |
207 |
74 |
246 |
88 |
|
50 |
284 |
88 |
257 |
80 |
288 |
89 |
|
55 |
332 |
94 |
295 |
84 |
348 |
98 |
|
60 |
388 |
97 |
329 |
82 |
370 |
93 |
|
65 |
426 |
96 |
351 |
79 |
413 |
93 |
|
70 |
466 |
98 |
410 |
86 |
480 |
101 |
|
75 |
490 |
|
432 |
|
525 |
|
Table 7. Yield and productivity of trees
|
PSP |
Initial stock $m^{3} / h a$ |
Eventual stock $m^{3} / h a$ |
Stock development $m^{3} / h a$ |
Total felled stock $m^{3} / h a$ |
Yield $m^{3} / h a$ |
Final yield, |
Growth of total yield from initial |
|
|
$m^{3} / h a$ |
% |
|||||||
|
5-1 |
190 |
373 |
183 |
11 |
373 |
463 |
262 |
129 |
|
5-2 |
119 |
311 |
192 |
114 |
425 |
456 |
241 |
119 |
|
5-3 |
132 |
386 |
254 |
105 |
491 |
496 |
296 |
148 |
|
6-2 |
108 |
338 |
230 |
85 |
423 |
439 |
260 |
145 |
|
6-3 |
176 |
319 |
143 |
0 |
319 |
433 |
244 |
129 |
|
6-4 |
179 |
355 |
176 |
0 |
355 |
475 |
293 |
62 |
|
6-5 |
126 |
390 |
264 |
71 |
461 |
509 |
312 |
158 |
|
6-7 |
150 |
337 |
187 |
84 |
421 |
490 |
256 |
109 |
|
6-8 |
132 |
319 |
187 |
66 |
385 |
432 |
234 |
118 |
|
6-9 |
114 |
377 |
263 |
132 |
509 |
525 |
279 |
113 |
3.4 Stock recovery after thinning
It is known that intensive thinning can lead to a decrease in the stock of forest stands and, as a result, to a decrease in the profitability of final use.
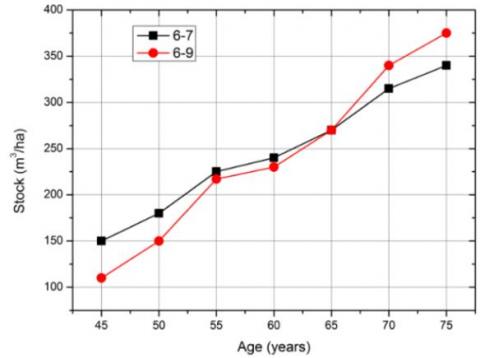
Figure 3 shows graphs of wood yield depending on age when thinning the crown (6-7) and bottom (6-9) of trees. With a lower initial level of wood yield after 65 years, a comparison of the yield is observed, and after 75 years, the wood yield in the plot (6-9) exceeds the wood yield in the plot (6-7) by 12%.
Figure 3. Age-related stock development in samples (6-7) and (6-9)
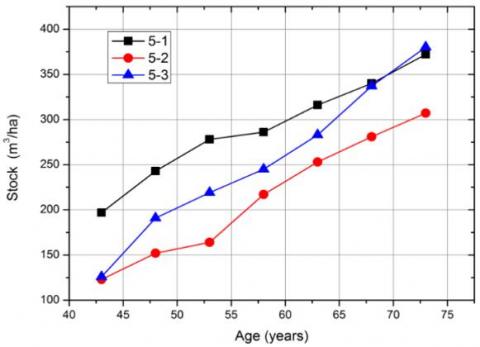
Figure 4. Age-related stock development in samples (5-1), (5-2) and (5-3)
Plot (5-2) was characterized by the smallest reserve, which could not be replenished before the end of the experiment (Figure 4).
According to the data, in the first cutting was made approximately 41% of the stock. Although the stock volume and productivity were not restored, at the age of 53, the second thinning session was held at an intensity of 15%. At the 5-3 mixed treated sample plot, the first thinning treatment was 34%. The following year, it was decided to apply the necessary fertilizers, after which (53 years) the increase in productivity recovered to the level of the control plot. After that, it was decided to carry out a second thinning and fertilization. The data show that the yield was almost the same in all plots. However, according to the results of the experiment, the yield in the control plot was minimal. The following year, it was decided to apply the necessary fertilizers, after which (53 years) the increase in productivity recovered to the level of the control plot. After that, it was decided to carry out a second thinning and fertilization. The data show that the yield was almost the same in all plots. However, according to the results of the experiment, the yield in the control plot was minimal. The plot (5-3) was characterized by the maximum yield, the plants on which were thinned out and fertilized twice.
We assessed mortality to determine the need for different types of thinning. Changes in mortality rates on differently sample plots presented in Figure 5.
It can be argued that intensive thinning immediately after treatment has a strong effect on mortality. After that, the mortality rate levels off.
Shown in Figure 5 data show that mortality in slightly thinned areas is almost zero. In sparse areas, mortality is much higher (~3 times). On slightly thinned plots (6-2) with two-fold thinning, the mortality rate is significantly lower (~4 times) than on the non-thinned (control) plot.
Figure 5. Changes in mortality M rates on differently sample plots
3.5 Economic calculations
Method of thinning has a significant effect on size distribution of pine trees, as can be evident from data in Table 8.
Based on the data given in Table. 8, we can conclude that the highest commercial value is characterized by wood obtained in the area (5-3). It has been established that the type of thinning significantly affects the economic efficiency of growing pine trees.
The second place in terms of inventory value after complex treatment is occupied by the 6-9 low-thinned sample plot and 6-5 mixed-treatment plot. It can be explained by a large stand stock in general, and a large stock in particular for large and medium wood. The 6-3 control plantation has the lowest inventory cost.
Table 8. Economic calculations
|
Size of wood |
Section 5-1 |
Section 5-2 |
Section 5-3 |
|||
|
Stock, $m^{3} / h a$ |
Inventory cost, \$ |
Stock, $m^{3} / h a$ |
Inventory cost, \$ |
Stock, $m^{3} / h a$ |
Inventory, cost, \$ |
|
|
L |
37.0 |
293.4 |
38.0 |
301.3 |
41.0 |
325.0 |
|
M |
227.0 |
1284.3 |
196.0 |
1109.0 |
248.0 |
1403.0 |
|
S |
45.0 |
128.0 |
28.0 |
79.7 |
49.0 |
139.5 |
|
FW |
22.0 |
4.9 |
19.0 |
4.3 |
24.0 |
5.4 |
|
T |
331.0 |
1710.7 |
281.0 |
1494.0 |
362.0 |
1873.0 |
|
|
Section 6-3 |
Section 6-4 |
Section 6-5 |
|||
|
L |
22.0 |
174.4 |
35.0 |
277.5 |
39.0 |
309.0 |
|
M |
150.0 |
849.0 |
217.0 |
1227.0 |
237.0 |
1341.0 |
|
S |
86.0 |
245.0 |
43.0 |
245.0 |
47.0 |
134.0 |
|
FW |
23.0 |
65.5 |
21.0 |
4.7 |
24.0 |
5.4 |
|
T |
281.0 |
1333.0 |
316.0 |
1755.0 |
347.0 |
1789.0 |
|
|
Section 6-7 |
Section 6-8 |
Section 6-9 |
|||
|
L |
34.0 |
270.0 |
32.0 |
254.0 |
45.0 |
357.0 |
|
M |
206.0 |
1165.0 |
195.0 |
1103.0 |
237.0 |
1341.0 |
|
S |
40.0 |
114.0 |
38.0 |
108.0 |
34.0 |
97.0 |
|
FW |
20.0 |
4.5 |
19.0 |
4.4 |
23.0 |
5.2 |
|
T |
300.0 |
1553.0 |
284.0 |
1470.0 |
339.0 |
1799.0 |
It is known that improving the quality characteristics of grown wood significantly increases its attractiveness to timber processing enterprises [27-29].
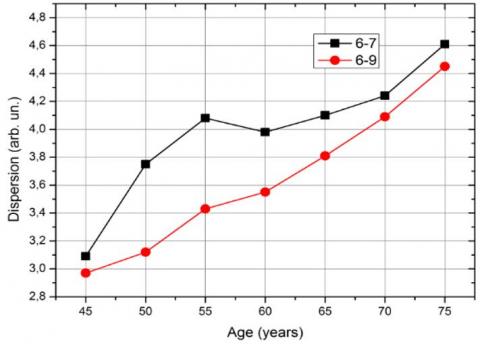
As part of our study, we set ourselves the goal of determining the impact of various types of thinning and tree processing on the yield and productivity of growing wood. It should be noted that one of the most important indicators evaluated by us was the diameter of the trunk. Figure 6 shows data on the dispersion of the diameter of the trunks in different areas. Reducing the dispersion allows us to conclude that the procurement campaign will be held with less difficulty.
Figure 6. Dispersion by years
The following main conclusions and recommendations can be made on the basis of research results:
(1) Choosing the right thinning method allows you to optimize the yield, productivity and mortality of the stand. On the other hand, we observed improved merchantability of the stand, reduced time for forestation, and simplified thinning programs.
(2) Crown thinning is a less preferred method than bottom thinning, as it leads to a deterioration in the quality of trees and an increase in their mortality.
(3) The inexpediency of preliminary thinning of trees has been established.
(4) Tree thinning results in an improvement in the quality of the remaining stand, as nutrient utilization is greatly increased.
(5) Tree thinning must necessarily be combined with fertilization. Thinning without fertilization and fertilization without thinning show the worst results.
(6) In general, findings of this article can be used to improve approach of thinning treatment in the Leningrad or other regions in the North of Russian Federation.
The work was carried out within the confines of the scientific school “Advances in lumber industry and forestry”. The underlying content of this paper was supported by the grant of the Russian Science Foundation № 22-26-00009, https://rscf.ru/project/22-26-00009/.
|
L |
large |
|
M |
Medium |
|
FW |
Firewood |
|
T |
Total |
[1] Zeide, B. (2001). Thinning and growth: a full turnaround. Journal of Forestry, 99: 20-25. https://doi.org/10.1093/jof/99.1.20
[2] Powers, M.D., Palik, B.J., Bradford, J.B., Fraver, S., Webster, C.R. (2010). Thinning method and intensity influence long-term mortality trends in a red pine forest. Forest Ecology and Management, 260(7): 1138-1148. https://doi.org/10.1016/j.foreco.2010.07.002
[3] Pretzsch, H. (2020). Density and growth of forest stands revisited. Effect of the temporal scale of observation, site quality, and thinning. Forest Ecology and Management, 460: 117879. https://doi.org/10.1016/j.foreco.2020.117879
[4] Schulze, E.D., Sierra, C.A., Egenolf, V., Woerdehoff, R., Irslinger, R., Baldamus, C., Stupak, I., Spellmann, H. (2020). The climate change mitigation effect of bioenergy from sustainably managed forests in Central Europe. GCB Bioenergy, 12: 186-197. https://doi.org/10.1111/gcbb.12672
[5] Pommerening, A., Murphy, S.T. (2004). A review of the history, definitions and methods of continuous cover forestry with special attention to afforestation and restocking. Forestry, 77: 27-44. https://doi.org/10.1093/forestry/77.1.27
[6] Hosius, B., Leinemann, L., Konnert, M., Bergmann, F. (2006). Genetic aspects of forestry in the Central Europe. European Journal of Forest Research, 125: 407-417. https://doi.org/10.1007/s10342-006-0136-4
[7] del Río Gaztelurrutia, M., Oviedo, A.B., Pretzsch, H., Löf, M., Ruiz-Peinado, R. (2017). A review of thinning effects on Scots pine stands: from growth and yield to new challenges under global change. Forest Systems, 26(2): eR03S. https://doi.org/10.5424/fs/2017262-11325
[8] Pretzsch, H., Biber, P., Schütze, G., Uhl, E., Rötzer, T. (2014). Forest stand growth dynamics in Central Europe have accelerated since 1870. Nature Communications, 5: 4967. https://doi.org/10.1038/ncomms5967
[9] Sohn, J.A., Hartig, F., Kohler, M., Huss, J., Bauhus, J. (2016). Heavy and frequent thinning promotes drought adaptation in Pinus sylvestris forests. Ecological Applications, 26: 2190-2205. https://doi.org/10.1002/eap.1373
[10] Alvarez, S., Ortiz, C., Díaz-Pinés, E., Rubio, A. (2016). Influence of tree species composition, thinning intensity and climate change on carbon sequestration in Mediterranean mountain forests: A case study using the CO2Fix model. Mitigation and Adaptation Strategies for Global Change, 21: 1045-1058. https://doi.org/10.1007/s11027-014-9565-4
[11] Ruiz-Peinado, R., Bravo-Oviedo, A., Montero, G., Del Río, M. (2016). Carbon stocks in a Scots pine afforestation under different thinning intensities management. Mitigation and Adaptation Strategies for Global Change, 21: 1059-1072. https://doi.org/10.1007/s11027-014-9585-0
[12] Lindroth, A., Holst, J., Heliasz, M., Vestin, P., Lagergren, F., Biermann, T., Cai, Z., Mölder, M. (2018). Effects of low thinning on carbon dioxide fluxes in a mixed hemiboreal forest. Agricultural and Forest Meteorology, 262: 59-70. https://doi.org/10.1016/j.agrformet.2018.06.021
[13] Marchi, M., Paletto, A., Cantiani, P., Bianchetto, E., De Meo, I. (2018). Comparing thinning system effects on ecosystem services provision in artificial black pine (Pinus nigra JF Arnold) forests. Forests, 9(4): 188. https://doi.org/10.3390/f9040188
[14] Tahvonen, O. (2016). Economics of rotation and thinning revisited: the optimality of clearcuts versus continuous cover forestry. Forest Policy and Economics, 62: 88-94. https://doi.org/10.1016/j.forpol.2015.08.013
[15] Yoshimoto, A., Asante, P., Konoshima, M. (2016). Stand-level forest management planning approaches. Current Forestry Reports, 2: 163-176. https://doi.org/10.1007/s40725-016-0041-0
[16] Kremer, A., Ronce, O., Robledo‐Arnuncio, J.J., Guillaume, F., Bohrer, G., Nathan, R., Bridle, J.R., Gomulkiewicz, R., Klein, E.K., Ritland, K., Kuparinen, A., Gerber, S., Schueler, S. (2012). Long‐distance gene flow and adaptation of forest trees to rapid climate change. Ecology Letters, 15(4): 378-392. https://doi.org/10.1111/j.1461-0248.2012.01746.x
[17] Primicia, I., Colomo, R.A., Rodríguez, J.B.I., Puertas, F., Traver, C., Martínez, F.J.C. (2016). Influence of thinning intensity and canopy type on Scots pine stand and growth dynamics in a mixed managed forest. Forestry Systems, 25(2): e057. https://doi.org/10.5424/fs/2016252-07317
[18] Karlsson, L. (2013). Silvicultural regimes and early biomass thinning in young, dense pine stands. Doctoral thesis, Swedish University of Agricultural Sciences.
[19] Ministry of Natural Resources and Environment of the Russian Federation. (2020). Order of the Ministry of Natural Resources and Environment of the Russian Federation as of 27.03.2020 N 173 "On Amendments to the Rules of Forest care, approved by order of the Ministry of Natural Resources and Environment of the Russian Federation as of November 22, 2017. N 626. https://rulaws.ru/acts/Prikaz-Minprirody-Rossii-ot-27.03.2020-N-173/, accessed on 17 Dec. 2020.
[20] Gosstandart. (1972). GOST 18264-72. Forest valuation and forest organization. Classification of increment and change in the stock of the stand. https://www.russiangost.com/p-234598-gost-18264-72.aspx, accessed on 17 Dec. 2020.
[21] Rogozin, M., Razin, G. (2015). Development of Forest Stands. Models, Laws, Hypotheses. Lulu Press.
[22] Gosstandart. (1984). GOST 12.3.037-84. Occupational safety standards system. Use of fertilizers in agriculture and forestry. General Safety Requirements. https://gostexpert.ru/data/files/12.3.037-84/a01d202764c7a4db452bf4e82eac9662.pdf, accessed on 17 Dec. 2020.
[23] Ivanova, A.V., Morkovina, S.S., Kolesnichenko, E.A., Matveev, S.M. (2018). Management of reforestation processes using innovative technologies. In: Proceedings of the 32nd International Business Information Management Association Conference, IBIMA 2018 - Vision 2020: Sustainable Economic Development and Application of Innovation Management from Regional expansion to Global Growth. Seville, Spain, pp. 1817-1823.
[24] Kunickaya, O.A., Burmistrova, O.N., Hertz, E.O., Ivanov, V., Nazarova, I., Tanyukevich, V., Semenyutina, A., Sidorov, M., Fedorova, P., Ohlopkova, M. (2020). Using machine vision to improve the efficiency of lumber mills. Journal of Physics: Conference Series International Conference on Future of Engineering Systems and Technologies, 1478: 012020. https://doi.org/10.1088/1742-6596/1478/1/012020
[25] Kunickaya, O.A., Tanyukevich, V.V., Khmeleva, D.V., Kulik, A., Runova, E.M., Savchenkova, V., Voronova, A.M., Lavrov, M.M. (2020). Cultivation of the targeted forest plantations. Journal of Environmental Treatment Techniques, 4: 1385-1393. https://doi.org/10.47277/JETT/8(4)1393
[26] Ushanov, S.V., Shevelev, S.L., Kulakova, N.N., Vais, A.A., Nemitch, V.N. (2020). Simulation of forest ecosystems dynamic processes message. In: IOP Conference Series: Materials Science and Engineering. IOP Publishing, Bristol. 822: 012019. https://doi.org/10.1088/1757-899X/822/1/012019
[27] Grigorev, I., Frolov, I., Kunickaya, O., Burmistrova, O., Manukovsky, A.Y., Hertz, E., Mueller, O., Kremleva, L., Protasova, S., Mikhaylenko, E. (2019). Non-destructive testing of internal structure of the low-quality wood. International Journal of Civil Engineering and Technology, 10(1): 2104-2123.
[28] Kunickaya, O.A., Shadrin, A.A., Burmistrova, O.N., Markov, O.B., Gasparyan, G.D., Davtyan, A.B., Lapshina, M.L., Sleptsova, N.A., Ustinova, V.V., Kruzhilin, S.N. (2019). Wood treatment with hydro impact: A theoretical and experimental study. Bulgarian Journal of Agricultural Science, 25: 158-166.
[29] Kunickaya, O.A., Shadrin, A.A., Kremleva, L.V., Mueller, O.D., Ivanov, V.A., Bederdinova, O.I., Kruchinin, I.N., Burgonutdinov, A.M., Zakharova, O.I., Struchkov, N.A. (2019). Modeling of the processes of the modification of the current volume warming by drainage and pressing. Bulgarian Journal of Agricultural Science, 25: 167-177.