Mohammed Gollapalli* | Maissa A. AlMetrik | Batool S. AlNajrani | Amal A. AlOmari | Safa H. AlDawoud | Yousof Z. AlMunsour | Mamoun M. Abdulqader | Khalid M. Aloup
© 2022 IIETA. This article is published by IIETA and is licensed under the CC BY 4.0 license (http://creativecommons.org/licenses/by/4.0/).
OPEN ACCESS
Cloud computing has grown into a critical technology by enabling ground-breaking capabilities for Internet-dependent computer platforms and software applications. As cloud computing systems continue to expand and develop, the need for a more guaranteed, reliant service, and an early task execution status from Cloud Service Providers (CSP) is vital. Additionally, efficient prediction of task failure significantly improves the running time as well as resource utilization in cloud computing. Task failure forecasting in the cloud is regarded as a challenging task based on the literature review conducted in this study. To address these issues, the goal of this study aimed to create fast machine learning approaches for reliably predicting task failure in cloud computing and analyzing their performance using multiple assessment criteria. The Google cluster dataset was used in this study, coupled with Artificial Neural Network (ANN), Support Vector Machine (SVM), and a stacking ensemble method, to forecast job failure in a cloud computing context. The results show that the proposed models can predict the failed tasks both effectively and efficiently. The stacking ensemble outperformed the experimented models, reaching a 99.8%. The suggested paradigm could greatly benefit cloud service providers by decreasing wasted resources and costs associated with task failures.
artificial neural networks, cloud computing, support vector machine, machine learning, cluster tracing
Cloud computing has become a prevalent method of managing and providing software, platform, and infrastructure services through the internet [1-4]. However, due to its commodity infrastructure and various scheduling issues, task failure occurring is inevitable [1]. Task failure can be defined as the point at which the system is no longer able to meet the task execution demand [2]. When task failure occurs, complete workflow performance is affected due to the dependency nature of tasks. Subsequently, to provide satisfactory results to businesses and customers, task failures transpiring in data centers must be detected and predicted so that cloud service providers (CSPs) can prepare proper contingency plans in the event of service failure. Task failure prediction on cloud computing has been considered as a challenging task [3]. This is due to the increasing revolution on technology and the continual growth of cloud computing complexity. Many research works have been addressed the problem of task failure prediction on cloud computing. However, due to the cloud’s exponential growth and heterogeneous nature, the achieved results still demand for greater improvements. As a result, there is a pressing need to design a reliable model that can forecast task failure and produce better results.
The main objective of this study is to create and apply various machine learning methods that use mathematical models to properly forecast task failure in cloud computing. Furthermore, based on the review of literature conducted as part of this study, we compared and measured the performance efficiency of the proposed task failure prediction techniques using an accuracy, precision, and confusion matrix against most frequently employed models. The experiment methodology consists of dataset preparation, dataset cleaning, prediction model development, and performance evaluation. In this work, the Google cluster dataset is used, which is a massive cloud system available publicly. The size of this dataset is 2.4 TB and consists of five tables, which are as follows: Collection_events, Instance_events, Instance_usage, Machine_arttributes, and Machine_events [4].
Google cloud is considered one of the leading companies in cloud computing infrastructure and it consists of huge amount of compute clusters where each cluster consists of machines that has hundreds of massive numbers of tasks. These tasks cloud is used daily for searching through the web, making video calls or web hosting by millions of users worldwide. The dataset used in this paper is Google Cluster Workload Traces that has been released by Google in 2019. The dataset consists of the jobs/tasks that have been submitted from May 1st until May 31st which is represented in 96,400 machines. Google Cluster Workload Traces consists of run-time task resource usage for CPU, memory, and disk [5]. After extracting targeted data using SQL, Artificial Neural Network (ANN) and Support Vector Machine (SVM) machine learning techniques are applied to the dataset to predict task failure. Stacking is an ensemble method used to improve the prediction by combining two algorithms. Thus, stacking will be used by combining both SVM and ANN.
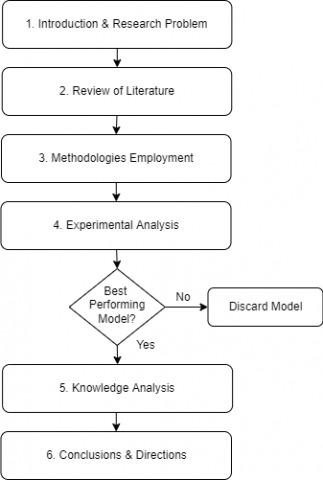
This study aims to help the IT managers in cloud data centers to predict task failure earlier and provide the opportunity to respond effectively to the predicted failures adequately. Moreover, it could immensely benefit cloud computing service providers including Amazon and Microsoft in enhancing performance and quality of service. The remainder of this paper is structured as shown in Figure 1. Section 2 investigates the most recent advances in task failure prediction literature. Section 3 describes the methodology used to conduct this research. Our experimental design is described in Section 4. Section 5 contains knowledge analysis and discussion of our research. Finally, section 6 summarizes our findings and future research.
Figure 1. Research contributions flow diagram
Liu et al. [1] conducted extensive research in which the authors attempted to predict task failure by focusing on the early stages. This experiment made use of three days’ worth of data from the Google cluster workload traces dataset. The data was preprocessed and thoroughly cleaned until it was reduced to almost a fifth of the original data size. Additionally, since the study’s goal was time-critical, the authors chose to conduct the experiments on the 1/3 stage of the tasks. Moreover, various clustering methods were examined and analyzed including, k-Mean clustering, Hierarchical clustering, and Job clustering; eventually, the job clustering method outperformed all other methods and was chosen as the primary clustering method. For the prediction model, the authors used a Robust Multi-Task Learning (RMTL) model. The results for the proposed model regarding the accuracy, F1, FNR, and execution time were 98.46, 0.48, 28.34, and 97.06 seconds, respectively.
In Ref. [6], a deep learning algorithm called Bidirectional Long Short-Term Memory (Bi-LSTM) was presented for forecasting task failure in cloud data centers. The prediction model was deployed over a 29-day period using a Google cluster of 12.5k workstations, 672,075 jobs, and more than 48 million processes. The advantages of this model included featuring task priority, performing task resubmissions, and handling scheduling delays. Also, unlike other models, this model handles multiple input features for performing higher accuracy. To improve task failure prediction, the authors enlarged the input set dimensions by adding selected features to the inputs such as examining the priority of each work, calculating the number of task resubmissions, and counting the scheduling delay. For the evaluation of the introduced prediction model, authors have used three types of metrics such as counting the percentage of F1 score and accuracy, calculating the Receiver Operating Characteristic (ROC), and finally measuring the Time Cost Overhead to determine the best outcomes. The proposed task prediction algorithm showed that Bi-LSTM has achieved 93% of accuracy and 87% for predicting both job and task failures.
Another attempt at task failure prediction was made by Shetty et al. [7]. The experiment was conducted using two of the Google cluster workload trace datasets. The tables were combined in the pre-processing stage, creating a massive dataset of 40 GB when compressed. Moreover, after analyzing the new dataset, it was evident that it was imbalanced; therefore, three balancing methods were used to mitigate this issue. The balancing techniques were Synthetic Minority Oversampling Technique (SMOTE), Random Undersampling (RUS), and Random Oversampling (ROS). The prediction model used the XGBoost algorithm on each of the balancing techniques. Furthermore, the outcomes were compared and analyzed. Results showed that using the SMOTE balancing method with XGBoost produced the best results of 92% and 94.8% for precision and recall.
Failure detection and prediction were investigated in the study [8], where the authors researched, analyzed, and compared past detection and prediction models in the cloud. The outcomes of this study showed the significance of accurately predicting failures in the cloud and creating a strategy for handling these failures. Additionally, it was evident from the research that Big data models, Recurring Neural Networks, and Bayesian Interface, are all effective approaches when dealing with failure prediction. Moreover, the paper sheds light on the importance of parameter evaluation and selection, which can cause significant differences in the models’ performance.
Jassas and Mahmoud [9] compared six different prediction models for task failure forecasting. The tested models in this study were: Naive Bayes (NB), Decision Trees (DTs), Random Forests (RF), Logistic Regression (LR), Quadratic Discriminant Analysis (QDA) and K-Nearest Neighbors (KNN). The experiment was centered towards the Google cluster workload trace, and the data was stored in a pickle format due to its massive size. Preprocessing methods for this study were based on an earlier study [6]. Additionally, the authors investigated the effects of various feature selection techniques that included Recursive Feature Elimination (RFE), SelectKBest on feature importance, in which the RFE concluded to be the chosen technique. For the evaluation, after examining numerous k-folds options, the study finally sets on 5-fold cross-validation. Ultimately, the RF classifier outperformed the other machine learning algorithms, resulting in a 97% precision, 93% recall, and 95% F1-score.
For task failure prediction in cloud workflows, Padmakumari and Umamakeswari [10] presented a new classification technique termed as mixed bagging ensemble. They have also employed Naïve Bayes, Random Forest, Rule-based, and Multilayer Feed-Forward Neural Networks as machine learning classifiers to predict task failure. The dataset was taken from the implementation of scientific workflow of tasks for an interval period of 3 seconds. Also, the authors used Principal Component Analysis and feature selection techniques to extract relevant metrics. Additionally, the Weka software tool was used to assess the efficacy of the employed categorization algorithms. WorkflowSim and CloudSim classes were used to collect the expected task failure during data preparation. The results revealed that Naïve Bayes had the highest accuracy rate of 94.4%. The given combined bagging ensemble, on the other hand, achieved an overall accuracy of 95.8%.
Mohammed et al. [2] proposed an advanced failure prediction system employing Auto-Regressive Moving Average (ARMA) and the R programming language with data acquired from the National Energy Research Scientific Computing Centre (NERSC). The authors have used computing system that was consisting of 574 computing nodes with RAM of 10 Gbyte and local disk space of 430. Login and administrative nodes have also been implemented within the system. Moreover, autocorrelation and partial autocorrelation functions were used in the identification step for building the time series model. The presented model proved its capabilities in predicting monthly failure rates of components and gained an overall accuracy of 95%.
Liu et al. [11] introduced an online job failure prediction model using extreme incremental learning strategy. The dataset contained the first 12 hours of the Google cluster trace and was thoroughly cleaned and preprocessed to remove any records that are irrelevant to the experiment, which lead to the disposal of 12,961 jobs from the dataset. The four prediction models, Online Sequential Extreme Learning Machine (OS-ELM), Support Vector Machine (SVM), ELM, as well as OS-SVM, were used with a 1:3 ratio split for testing. Additionally, various parameter selection methods depending on hidden layer nodes were tested. The results illustrated the validity of using 10-100 hidden layer nodes with the OS-ELM model in predicting online job failures, where it achieved an accuracy of 93%.
Islam and Manivannan [12] identified the key characteristics of the observed failures in the cloud environment with the aim of conducting better reliability and scalability to cloud systems. The analysis on the Google cluster workload trace proved that killed and failed jobs have a direct correlation to the increased consumption of resources in the cloud. Furthermore, the study investigated the potential to early predict the termination state of both job and task weaken to be finished, failed, or killed to minimize resource consumption by adopting better job and task scheduling algorithms. To achieve this goal, model Long Short-Term Memory Network (LSTM) built on Recurrent Neural Network (RNN) was created for forecasting application failure in the cloud. A prototype of the prediction system was implemented on a Google cluster dataset that contained hundreds of thousands of jobs, while a single job could reach to tens of thousands of tasks collected form 12,500 machines. The experiment was carried out using python and the performance was evaluated in terms of accuracy, F1 Score, precision, True Positive Rate (TPR), False Positive Rate (FPR), and True Negative Rate (TNR). The results demonstrated that the LSTM model successfully achieved 87% and 81% accuracy of predicted task failures and job failures, respectively. Furthermore, when compared to FNN and SVM, LSTM outperformed the others in terms of accuracy, precision, and recall. LSTM predicted task failures with a TPR of 85% and an FPR of only 11%. Furthermore, a set of failed predicted jobs was simulated on the GloudSim simulator, and the results revealed that the prediction model was capable of saving from 12% to 20% of the resources involving service time, memory, and CPU.
An automated job status prediction model was introduced in Ref. [13]. To solve the classification problem, the authors compared five classifiers: Naïve Bayes, SVM, Random forest (RF), Decision tree, and Logistic regression. The experiments were tested on a Genepool cluster from National Energy Research Scientific Computing (NERSC), consisting of over five million records and 13 features using 5-fold cross-validation. Furthermore, the study aimed to predict failed jobs while the jobs are currently ongoing. The experimental results showed that the RF achieved better results with 99.8% accuracy, 94.8% precision, and 83.6% recall. However, the dataset was highly imbalanced with many failed jobs and consisted of less than an eighth of the successful jobs.
Soualhia et al. [14] examined task scheduling in cloud computing and discovered that 40% of tasks along with 45% of jobs were not completed correctly. Jobs failed based on the study because some of its tasks failed before they could be finished, and the tasks failed due to the failure to perform dependent tasks. As a result, they used 10-fold cross-validation to test several machine learning algorithms in R to anticipate task failures earlier. On Google clusters data, the General Linear Model (GLM), Random Forest, Boost, Neural Network, Tree, and Conditional Tree (CTree) were tested for accuracy, recall, and precision. Due to processing resource constraints and high execution times, only 10 files containing 2,594 jobs and 6,3234 tasks with a total processing duration of 100 minutes were utilized. Random Forest outperformed other methods in the experiments, with an accuracy of 95.8%, a recall of 96.2%, and a precision of 97.4%. At the same time, GloudSim was deployed and integrated with the Random Forest prediction model using 8 virtual machines (VMs). The results revealed an improvement in maximizing finished tasks as well as jobs up to 40%, and 20%, respectively, and minimizing the failed tasks and jobs’ numbers. Moreover, this extended model effectively improved the execution time optimization as an effect of the decreased amount of rescheduled failed jobs which lead to reducing the overall execution time. Besides, the study implemented the prediction models with the Hadoop framework on Amazon EC2. These extensive schedulers’ outputs were tested by gene expression association applications which are related to breast cancer. This new technique managed to decrease job failures by 70%.
In Ref. [3], the Recurrent Neural Network (RNN) model was applied for the prediction of job and task failures in the Google cluster traces to limit the wasted resources in the cloud computing environment. The experiment was implemented for 29 days on Google cluster workload traced dataset containing 670,000 jobs and 26 million tasks. MySQL database was used to process data, then the predictive model was developed using python. The study identified features: Task Priority, Task Re-submission, Resource Usage, and User Profile having a direct relation to job failures. Furthermore, the proposed model correctly predicted the failed and finished jobs with an at most True Positive Rate (TPR) of 40% and a 6% False Positive Rate (FPR). The study efficiently utilized the computational resources with a 6% up to 10% improvement on average.
The evaluated literature on analyzing tasks and job failures is summarized in Appendix 1. There is still a lot of opportunity for improvement in terms of mitigating the negative effects of failed tasks. Furthermore, a model that can accurately forecast task failures must be implemented. To circumvent these restrictions, we introduced ANN and SVM prediction algorithms, as well as an ensemble of both, that have never been utilized on Google clusters previously to help accurately predict failed tasks in this study. The study achieved satisfactory results in early prediction of task failures providing an opportunity to respond effectively by preparing proper contingency plans. The methodology, experimental results are detailed in the below sections.
3.1 Dataset description
Google cluster dataset is a massive cloud system publicly available. The dataset is initialized and stored by capturing the tasks and jobs that have been submitted during May 2019 [4]. Thus, the size of the dataset adds up to approximately 2.4 TB. Each cell in the dataset is representing a collection of machines stored in a single cluster that assigns work for the machines. Each cluster in the dataset is a collection of machines that have been combined into racks connected through a cluster network. The dataset consists of multiple tables, which are the Machine Event table, Machine Attribute table, Collection Events table, Instance Events table, and Instance Usage table [15]. As this research deals with task failure predictions, the Instance Events tables are used as part of this study. The InstanceEvents table contains the following attributes: Time, Type, Collection_id, Scheduling_class, Missing_type, Collection_type, Priority, Alloc_collection_id, Instance_index, Machine_id, Alloc_instance_index, Resource_request, and Constraint.
3.2 Artificial neural networks
The fundamental concept of ANNs is based on how the human brain connects neurons and dendrites. The same idea applies to ANNs, but with silicon and wires instead. The human brain is made up of 86 billion nerve cells called neurons, which are linked to thousands of cells in the human body via Axons [16]. Dendrites accept input from the surrounding environment. These inputs’ job is to generate electric impulses that can travel to a neural network. Furthermore, any neuron within the neural network can send a message to another neuron to handle any problem that arises in the network system.
ANNs are made up of many nodes that are linked together by a network of links. The nodes can then take any input data and perform some operations on it. The result of the process operations is then passed to other nodes via an output called node value. Each link in the neural network is assigned a weight that can change the weight values. There are two artificial neural network types, Feedforward and Feedback. In Feedforward ANNs, the information follows unidirectionally with no feedback loops, and they mainly are used in classification problems. While in Feedback ANNs, the feedback loops are possible to attend, and they can be used in content addressable memory [17].
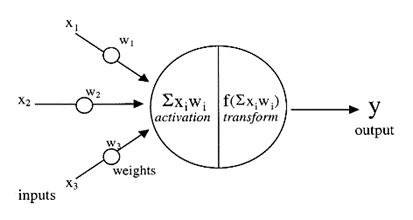
The work of an ANN, as shown in Figure 2, is that the arrow represents a connection between two nodes and record the pathway for the following information. For each connection, it gains a weight, which is an integer number that can control a signal between two nodes. Altering weights is unnecessary if the neural network generates satisfactory results. However, in cases where the network produces low-quality results, the ANN applies the change of weights to enhance output results.
Figure 2. Model of artificial neuron [16]
ANNs are adaptive systems that can change the weights of inputs, or the structure of the network based on the data that flows through it during the learning or training stages. ANNs have also been shown to be capable of modeling both linear and non-linear relationships in datasets. Furthermore, ANNs are employed in a variety of settings to forecast real-time task scheduling and cloud failure jobs.
3.3 Support vector machine
The Support Vector Machine (SVM) is a supervised learning model that can tackle regression and classification problems adequately. SVM is a powerful strategy for dealing with the dimensionality curve, which can degrade machine learning model performance. Moreover, it has strength in solving non-separable cases using the kernel function. According to the study [18], this is done through mapping a non-separable problem to a new space with a higher dimensionality such that the cases can be distinguished and separated easily. SVM is considered a linear classifier that works on finding the best hyperplane based on the maximum margin to categorize the data samples to the correct classes. The optimal hyperplane is the one that obtains the maximum margin linear discriminates from both classes, which is the most considerable distance to the nearest element of each class. It has also been commonly used for fault identification in many applications due to its strong non-linear discrimination capability.
To find the hyperplane, let’s suppose attributes A1 and A2, training instances are 2-D for instance €=(e1,e2), where attributes’ values of A1 and A2 are represented as e1 and e2. The hyperplane can be found by a dot product of the weight vector ¥={y1,y2,..,yn} where n represent attributes count; and € plus s which is a bias. The hyperplane is calculated as:
$¥ . €+s=0$ (1)
The maximal margin size [19] is defined as:
$\frac{\mathbf{2}}{\|¥\|}$ (2)
$\|¥\|$ is the Euclidean norm of ¥, which is $\sqrt{¥ . ¥ 2}$ if:
$¥=\{y 1, y 2, \ldots, y n\}$, then
$\sqrt{¥ . ¥}=\sqrt{y_{1}^{2}+y_{2}^{2}+\ldots+y_{n}^{2}}$ (3)
When the SVM is trained, the maximal margin equation is converged to below equation:
$d\left(€^{T}\right)=\sum_{i=1}^{v} o_{i} \alpha_{i} €_{i} €^{T}+s_{0}$ (4)
where, $€^{T}$ is the test instance; v is the support vectors count; $O_{i}$ is the class output of support vector $€_{i}$; $\alpha_{i}$ and $s_{0}$ are numeric parameters that obtained during the optimization automatically. For the kernel function $k\left(€_{i}, €_{j}\right)$ there are different functions that could be used. However, the used function in this work is polynomial kernel function with d degree that is defined as:
$k\left(€_{i}, €_{j}\right)=\left(€_{i}, €_{j}+1\right)^{d}$ (5)
Furthermore, SVM has proved itself as a powerful technique that shows an excellent performance in various fields such as spam email detection [20], chronic kidney disease diagnosing [21], and failure prediction in cloud computing [22, 11].
3.4 Stacking
Stacking is an effective ensemble technique that uses meta-level classifiers as inputs which are retrieved by the outputs of several base or weak level classifier predictions. Stacked ensemble methods have developed to become a well-established technique of enhancing prediction accuracy [23]. Stacking has a framework of two levels: classifiers at level-0 (also called base-level or weak) and classifiers at level-1 (called meta). Using the training set, the base-level classifiers are trained to produce their predictions. Afterwards, the meta-classifier is used to map the level-0 classifiers’ outputs to the actual target class, with assistance of the meta-data. An example of the meta-data may be defined by $\left(\left(x_{i}^{1}, x_{i}^{2}, \ldots, x_{i}^{m}\right) x_{i}\right)$ where $x_{i}^{m}$ refers to the prediction provided on the $i^{t h}$ instances by the $x^{t h}$ base-level classifier, and $x_{i}$ defines the target class. After the base-level classifiers are trained, each classifier will produce an individual prediction during the process of classifying a new case. Finally, the predictions are considered as the meta-classifier’s input to produce the final classification decision [24]. To create a stacking ensemble with $\mathcal{X}$ number of weak predictors, the training data is split into two separate folds.
In the preceding steps, only the data in the first fold is used as input for the final meta classifier, while the data in the second fold is not used for the learning process. Therefore, an apparent weakness from the stacking method is that information contained in the second half that might be of great use to the weak learners is overlooked and vice versa for the first half and the meta classifier. To address this limitation, a “k-fold cross-training” approach (such as the k-fold cross-validation approach) should be implemented, so that for every observation or prediction made by the weak learners that may be used as an input to the meta-mode, the predictions and observations are made with iterations of base-level learners trained with k-1 folds approach as well as does not include considered prediction. Through this approach, it is ensured that a valid prediction is generated for each observation of the dataset made by the weak learners, allowing the meta-final model’s training stage to fully utilize the potential of the base-predictions model. In this research, the stacking method will be constructed with ANN and SVM, also with the SVM implemented as the meta-classifier.
The study was officially carried out using Weka data mining software [25].
4.1 Cleaning and pre-processing
Table 1. Tasks types description
|
Event type |
Value |
Event description |
|
SUBMIT |
0 |
The task was submitted |
|
QUEUE |
1 |
The task is in queue for the scheduler |
|
ENABLE |
2 |
The task is ready for scheduling |
|
SCHEDULE |
3 |
The task is scheduled |
|
EVICT |
4 |
The task was de-scheduled |
|
FAIL |
5 |
The task was unable to be executed |
|
FINISH |
6 |
The task was executed successfully |
|
KILL |
7 |
The task was cancelled |
|
LOST |
8 |
The task is ended but the final state wasn’t recorded |
|
UP-DATE_PENDING |
9 |
Attributes of a task is awaiting an update |
|
UPDATE_RUNNING |
10 |
Attributes of a task is currently updating |
The size of the Google trace cluster dataset used in this study is 2.4 TB. Therefore, to extract the required data, experimental dataset was uploaded within the Google Cloud Platform. The data pre-processing steps included data uploading and extraction stages. The dataset was uploaded through the Google Cloud Platform using the BigQuery tool. SQL query was then applied to extract the required part of the dataset from the Instance Events table. Several attributes in the InstanceEvents table were of no relevance to the prediction model. Therefore, among all the attributes in the InstanceEvents table, the feature selection of attributes included time, scheduling class, priority, alloc collection id, alloc instance index, CPUs, memory, and type, which is the targeted class. There are nine types for the event types as listed in Table 1. Since our study aimed to predict the final state of a task with being either failed or successful, the event types “fail”, and “finish” are considered as the target class. Hence, only samples that either contained the event type value of 5 (which represent the failed tasks) and 6 (which represents the successful tasks) were extracted using SQL from the Google cloud computing BigQuery environment.
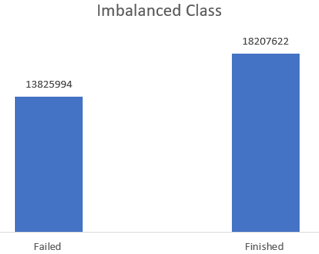
When the percentages of failed tasks are compared to the percentages of successful tasks, it was evident that the dataset was unbalanced. Figure 3 depicts the unbalanced dataset class. However, as this study only takes a fraction of the dataset and not the entirety of the 400 GB worth of data, equal parts of both the failed tasks and successful tasks were chosen and included with 16,000 samples per class.
Figure 3. Imbalanced class
For the proposed models, two primary stages are implemented. First, because this study deals with classification and not regression, the target class (failed or success) is converted from a numeric state to a nominal state; this ensures that the chosen models would classify the testing set. Second, all numeric attributes are normalized so that the inputs are transposed. The following is how the data was divided: 70% of the data was utilized to train the model, with the remaining 30% being used to test it.
4.2 Performance of the models
This section depicts the implementation results of the ANN, SVM, and the ensemble method. The parameters for the models are detailed in Table 2.
Table 2. Models parameters
|
|
Parameter |
Value |
|
ANN |
HiddenLayers |
2 |
|
LearningRate |
0.3 |
|
|
Seed |
0 |
|
|
SVM |
C |
2 |
|
Kernel |
PolyKernal |
|
|
RandoomSeed |
1 |
|
|
SVM and ANN stacking |
Base classifier |
SVM and ANN |
|
Meta classifier |
SVM |
|
|
NumFolds |
10 |
|
|
Seed |
1 |
The model’s precision, accuracy, False Negative Rate (FNR), and Area Under the Receiver Operating Characteristics (AUC) are used to assess their performance (AUC ROC). The following equations were used to determine FNR for accuracy, precision, and unsuccessful tasks:
Accuracy $=\frac{T P+T N}{T P+F N+F P+T N}$ (6)
Precision $=\frac{T P}{T P+F P}$ (7)
$F N R=\frac{F N}{T P+F N}$ (8)
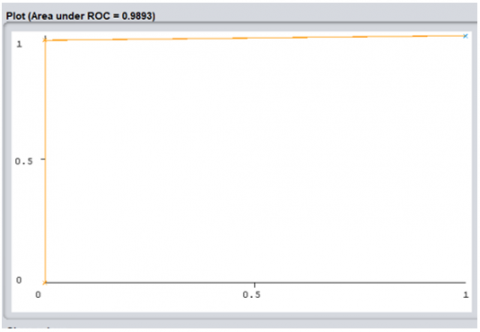
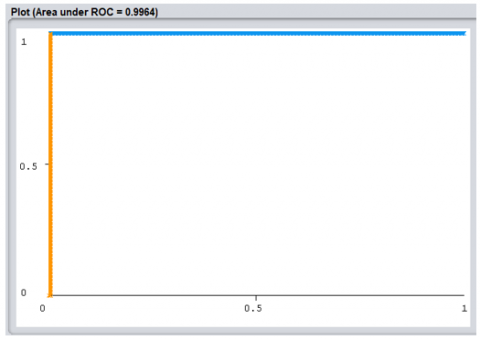
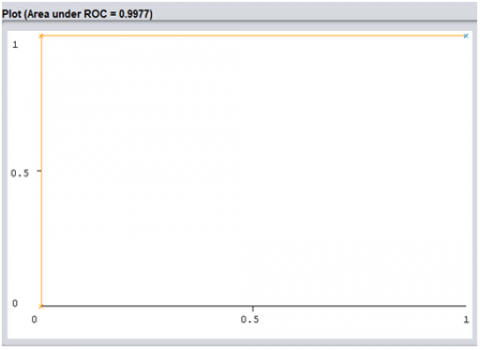
Figures 4, 5, and 6 depicts the AUC ROC of each of the proposed models. AUC is used to compare the performance of two classifiers and evaluate the performance based on the given threshold (of 0.5) [19]. ROC illustrates and plots the tradeoff between the False Positive Rate (FPR) and the True Positive Rate (TPR), also known as recall or sensitivity. Table 3 shows the outcomes of putting the trained models to work on the dataset.
Figure 4. SVM AUC ROC Plot
Figure 5. ANN AUC ROC plot
Figure 6. Imbalanced Class
Table 3. Result of the trained models
|
|
ANN |
SVM |
Stacking |
|
Accuracy |
99.7% |
98.9% |
99.8% |
|
Precision |
0.998 |
0.990 |
0.998 |
|
FNR |
0.001% |
0.011% |
0.001% |
|
AUC ROC |
0.996 |
0.989 |
0.997 |
Considering that a perfect AUC score would be 1.0, the best AUC was achieved by using the stacked ensemble technique (Figure 6) where it obtained a value of 0.997. The ANN also produced a value of 0.996 (Figure 5) which is an ideal outcome when considering the high computational complexity of the stacked ensemble. The lowest AUC was obtained from SVM with a value of 0.989 (Figure 4).
The performance of SVM, ANN, and stacking classifiers for predicting task failure on the Google cluster trace dataset were comprehensively investigated in this research. As evidenced by the results in Table 3, all of the proposed techniques performed admirably and successfully predicted the task’s status. All the classification models rigorously experimented in this study were analyzed based on their optimal parameter measurements. The highest accuracy of all the models was obtained by using the stacking ensemble followed by the ANN with only a 0.1% difference. Although the SVM achieved a good result, it is outperformed by the stacking ensemble and ANN. Furthermore, the stacking ensemble and the ANN outperform the SVM in precision, FNR, and AUC ROC. An extremely low FNR was achieved equally by ANN and the stacking ensemble. Although the stacking ensemble outperforms the ANN in terms of accuracy, precision, and AUC ROC, it should be noted that the stacking ensemble has the disadvantage of taking an inordinate amount of time to train and predict the data. Therefore, in cases where the implementation speed is critical, trading a fraction of the accuracy for a faster model would be advised. Hence, using the ANN model is a better choice.
Table 4. Comparison of experimental results
|
|
RMTL [1] |
SVM * |
ANN * |
Stacking* |
|
Accuracy |
98.5% |
98.9% |
99.7% |
99.8% |
|
Precision |
- |
0.990 |
0.998 |
0.998 |
|
FNR |
28.3 |
0.011 |
0.001 |
0.001 |
|
AUC ROC |
- |
0.998 |
0.996 |
0.997 |
Notes: *Result of the proposed algorithms in this study
To further evaluate the proposed models, we measured performance with studies conducted experiments using the same dataset. Since the dataset used in this research is recent, only one study investigated similar issue of predicting failed tasks [1] using same dataset used in this research but applied different algorithms. Table 4 compares our experimental results with the optimal result achieved in [1]. As can be seen, it is evident all the three of the proposed algorithms in this study achieved higher results in terms of predicting the failure tasks correctly. Moreover, in terms of the failed tasks that were incorrectly classified, the proposed algorithms achieved the lowest result.
Computational and memory resources are significantly consumed by failed tasks. Consequentially, cloud resources that include storage space, memory, and CPU will become depleted as the amount of failed tasks increases. The rates of failure tasks have dramatically increased as a result of the expanding sizes of software and hardware operations, as well as the lack of changes in their efficiency on a similar scale. To address the issues of providing reliability against emerging trends in cloud computing infrastructures, it is critical to provide credible failure forecasts for cloud computing clusters, and by facilitating accurate predictions that aids in taking action for potential task failures. Therefore, our proposed model could successfully help minimize wasted resources and costs against failures. Furthermore, the proposed models are able to provide satisfactory results to businesses and customers, so that the IT managers and potential CSPs could predict task failure earlier and provide the opportunity to respond effectively by preparing proper contingency plans. Moreover, it could benefit cloud computing service providers like Amazon and Microsoft in tremendously enhancing their performance and overall service quality.
In the past few years, cloud computing services have been rapidly increasing. However, there could be a moment where the services are no longer able to successfully execute the task. In this paper, an experiment was conducted by applying ANN, SVM, and a stacking ensemble on the Google trace cluster dataset. The models performances were evaluated in terms of accuracy, precision, FNR, and AUC ROC. From the experimental results, it was evident that using a stacking classifier gave a higher accuracy of 99.8% and an overall average of AUC ROC 0.997. However, it requires a high running time when compared with the ANN and SVM. Furthermore, using ANN and stacking, we were able to obtain excellent precision and a low false-negative rate. In addition, the results were compared to previous studies, and it was determined that all our proposed models performed better. In conclusion, this study could help CSPs forecast early task failures and adopt a better contingency plan to take the required actions in a timely and effective manner while enhancing performance and service quality.
For future work, we aspire to explore the performance of applying stacking of different machine learning algorithms with less run time speed to detect failures in cloud environments efficiently in terms of speed and accuracy, both of which should be further improved. Furthermore, we are also looking at predicting the task failures in cloud-based applications in real-time through providing instantaneous response and assisting in higher level of service availability.
|
ANN |
Artificial Neural Network |
|
ARMA |
Auto-Regressive Moving Average |
|
AUC |
Area Under the Receiver |
|
Bi-LSTM |
Bidirectional Long Short-Term Memory |
|
Ctree |
Conditional Tree |
|
CSP |
Cloud service providers |
|
DTs |
Decision Trees |
|
FNR |
False Negative Rate |
|
FPR |
False Positive Rate |
|
GLM |
General Linear Model |
|
KNN |
K-Nearest Neighbors |
|
LR |
Logistic Regression |
|
LSTM |
Long Short-Term Memory Network |
|
NB |
Naive Bayes |
|
OS-ELM |
Sequential Extreme Learning Machine |
|
QDA |
Quadratic Discriminant Analysis |
|
RF |
Random Forests |
|
RFE |
Recursive Feature Elimination |
|
RNN |
Recurrent Neural Network |
|
ROC |
Receiver Operating Characteristic |
|
ROS |
Random Oversampling |
|
RUS |
Random Undersampling |
|
SMOTE |
Synthetic Minority Oversampling Technique |
|
SVM |
Support Vector Machine |
|
TCO |
Time Cost Overhead |
|
TNR |
True Negative Rate |
|
TPR |
True Positive Rate |
|
VMs |
Virtual Machines |
[1] Liu, C., Dai, L., Lai, Y., Lai, G., Mao, W. (2020). Failure prediction of tasks in the cloud at an earlier stage: A solution based on domain information mining. Computing, 102(9): 2001-2023. https://doi.org/10.1007/s00607-020-00800-1
[2] Mohammed, B., Modu, B., Maiyama, K.M., Ugail, H., Awan, I., Kiran, M. (2018). Failure analysis modelling in an infrastructure as a service (Iaas) environment. Electronic Notes in Theoretical Computer Science, 340: 41-54. https://doi.org/10.1016/j.entcs.2018.09.004
[3] Chen, X., Lu, C.D., Pattabiraman, K. (2014). Failure analysis of jobs in compute clouds: A google cluster case study. IEEE 25th International Symposium on Software Reliability Engineering, pp. 167-177. https://doi.org/10.1109/issre.2014.34
[4] Wilkes, J. (2020). Google cluster-usage traces v3. Google Inc., Mountain View, CA, USA. https://research.google/tools/datasets/google-cluster-workload-traces-2019/, accessed on 04 Mar 2021.
[5] Tirmazi, M., Barker, A., Deng, N., Haque, M. E., Qin, Z. G., Hand, S., Wilkes, J. (2020). Borg: The next generation. In Proceedings of the Fifteenth European Conference on Computer Systems, 1-14. https://doi.org/10.1145/3342195.3387517
[6] Gao, J., Wang, H., Shen, H. (2020). Task failure prediction in cloud data centers using deep learning. IEEE Transactions on Services Computing. https://doi.org/10.1109/tsc.2020.2993728
[7] Shetty, J., Sajjan, R., Shobha, G. (2019). Task resource usage analysis and failure prediction in cloud. The 9th International Conference on Cloud Computing, Data Science & Engineering (Confluence), pp. 342-348. https://doi.org/10.1109/confluence.2019.8776612
[8] Kumar, K., Sai Sushmitha, K.K.S., Reddy, R.R. (2019). An exploration of failure prediction and failure detection in a cloud based environment. International Journal of Applied Engineering Research, 14(10): 2303-2309.
[9] Jassas, M., Mahmoud, Q.H. (2018). Failure analysis and characterization of scheduling jobs in google cluster trace. In IECON 2018-44th Annual Conference of the IEEE Industrial Electronics Society, pp. 3102-3107. https://doi.org/10.1109/iecon.2018.8592822
[10] Padmakumari, P., Umamakeswari, A. (2019). Task failure prediction using combine bagging ensemble (CBE) classification in cloud workflow. Wireless Personal Communications, 107(1): 23-40. https://dx.doi.org/10.1007/s11277-019-06238-9
[11] Liu, C., Han, J., Shang, Y., Liu, C., Cheng, B., Chen, J. (2017). Predicting of job failure in compute cloud based on online extreme learning machine: A comparative study. IEEE Access, 5: 9359-9368. https://dx.doi.org/10.1109/access.2017.2706740
[12] Islam, T., Manivannan, D. (2017). Predicting application failure in cloud: A machine learning approach. International Conference on Cognitive Computing (ICCC), pp. 24-31. https://dx.doi.org/10.1109/ieee.iccc.2017.11
[13] Yoo, W., Sim, A., Wu, K. (2016). Machine learning based job status prediction in scientific clusters. SAI Computing Conference (SAI), pp. 44-53. https://dx.doi.org/10.1109/sai.2016.7555961
[14] Soualhia, M., Khomh, F., Tahar, S. (2015). Predicting scheduling failures in the cloud: A case study with google clusters and hadoop on amazon EMR. IEEE 17th International Conference on High Performance Computing and Communications, 2015 IEEE 7th International Symposium on Cyberspace Safety and Security, and 2015 IEEE 12th International Conference on Embedded Software and Systems, pp. 58-65. https://dx.doi.org/10.1109/hpcc-css-icess.2015.170
[15] Lin, Y. Barker, A., Ceesay, S. (2020). Exploring characteristics of inter-cluster machines and cloud applications on google clusters. 2020 IEEE International Conference on Big Data (Big Data), pp. 2785-2794. https://doi.org/10.1109/BigData50022.2020.9377802
[16] Staub, S., Karaman, E., Kaya, S., Karapınar, H., Güven, E. (2015). Artificial neural network and agility. Procedia-Social and Behavioral Sciences, 195: 1477-1485. https://doi.org/10.1016/j.sbspro.2015.06.448
[17] Li, E.Y. (1994). Artificial neural networks and their business applications. Information & Management, 27(5): 303-313. https://doi.org/10.1016/0378-7206(94)90024-8
[18] Mao, W., Mu, X., Zheng, Y., Yan, G. (2014). Leave-one-out cross-validation-based model selection for multi-input multi-output support vector machine. Neural Computing and Applications, 24(2): 441-451. https://doi.org/10.1007/s00521-012-1234-5
[19] Han, J., Kamber, M., Pei, J. (2012). Outlier detection. Data Meichuangining: Concepts and Techniques, 543-584.
[20] Olatunji, S.O. (2019). Improved email spam detection model based on support vector machines. Neural Computing and Applications, 31(3): 691-699. https://doi.org/10.1007/s00521-017-3100-y
[21] Alassaf, R.A., Alsulaim, K.A., Alroomi, N.Y., Alsharif, N.S., Aljubeir, M.F., Olatunji, S.O., Alturayeif, N.S. (2018). Preemptive diagnosis of chronic kidney disease using machine learning techniques. International Conference on Innovations in Information Technology (IIT), pp. 99-104. https://doi.org/10.1109/INNOVATIONS.2018.8606040
[22] Adamu, H., Mohammed, B., Maina, A.B., Cullen, A., Ugail, H., Awan, I. (2017). An approach to failure prediction in a cloud based environment. IEEE 5th International Conference on Future Internet of Things and Cloud (FiCloud), pp. 191-197. https://doi.org/10.1109/FiCloud.2017.56
[23] Xia, Y., Chen, K., Yang, Y. (2021). Multi-label classification with weighted classifier selection and stacked ensemble. Information Sciences, 557: 421-442. https://doi.org/10.1016/j.ins.2020.06.017
[24] Wolpert, D.H. (1992). Stacked generalization. Neural Networks, 5(2): 241-259. https://doi.org/10.1016/S0893-6080(05)80023-1
[25] “Weka 3: Machine Learning Software in Java.” [Online]. Available: https://www.cs.waikato.ac.nz/ml/weka/, accessed on 05-Aug-2021.