Elisa Kusrini* | Indro Prakoso | Syarif Hidayatuloh
© 2022 IIETA. This article is published by IIETA and is licensed under the CC BY 4.0 license (http://creativecommons.org/licenses/by/4.0/).
OPEN ACCESS
Warehouse has an important role in supply chain management and has many complex activities that require special attention. This study aims to improve warehouse efficiency performance. Data Envelopment Analysis (DEA) method is employed to obtain the level of efficiency and benchmarking on five indicators, namely financial, productivity, utilization, quality, and cycle time along with five business processes in warehousing, i.e. receiving, put away, storage, order picking, and shipping. The decision making unit is a warehouse in four retailers in Yogyakarta province, in Indonesia. The input and output variables are selected based on the highest priority weight using the Analytical Hierarchy Process (AHP). The most important variable for receiving is productivity (receipt per man-hour), variable for put away is cycle time (put away cycle time), variable for storage is utilization (% location and cube occupied), variable for order picking is cycle time (order picking cycle time) and variable for shipping is productivity (order prepared for shipment per man-hour). The research results show that the benchmarking model with DEA can be used to increase warehouse efficiency performance by up to 22% by increasing receiving and shipping productivity, increasing storage utilization and reducing cycle time at put away and order picking.
Data Envelopment Analysis (DEA), warehouse, efficiency, benchmarking, Analytical Hierarchy Process (AHP)
In recent years, the global corporate climate has evolved and changed rapidly. The market's complexity necessitates those businesses become more competitive [1]. The market has had a big impact on the company's production, causing them to treble their production value in the last five years to fulfill rising client demand [2]. Nowadays, retail businesses have become a social trend and one of the most visible. Retailers are increasingly playing a strategic and operational role in supply chain performance [3]. Retail offers simple transactions and excellent customer service. The display of goods and the availability of goods, which is supported by the role of the warehouse in retailers, are two factors that attract consumers when purchasing goods in stores [4]. Warehousing, as a location for storing intermediate products stages in the supply chain, plays a critical role in the supply chain [5]. Warehousing activities have a direct impact on all supply chain processes and improvements [1]. The goal of warehouse management is to keep items or products moving as efficiently as possible while also providing resources in a more flexible manner. If the warehouse is well-managed, the company can regulate the quality of its service to clients as well as the quality of its products [2]. Even if present supply chains take the initiative to embrace e-commerce and integrated technology, the supply chain from the manufacturer to the end customer will be ineffective unless storage is adequately organized [6]. It is vital to monitor performance and efficiency levels such as employee productivity, warehouse area utilization, and great quality of goods in the warehouse that will bring positive values to the organization. The retail industry's sustainability is dependent on supply chain performance and the balance of warehouse responsiveness and efficiency [7]. A thorough review of comprehensive warehousing activities can assist organizations in monitoring and obtaining fundamental warehouse information, as well as assisting managers in making decisions and enhancing the effectiveness of ongoing operations [8]. Efficiency is a performance characteristic that has the best input-output ratio, which includes optimizing the use of limited resources. The expected performance is the ability to provide the greatest amount of output with the least amount of input. It is possible to discover the sources of inefficiency by examining input and output allocations [9]. There is a method to obtain the amount of efficiency required to organize the benchmarking strategy using Data Envelopment Analysis (DEA). Data Envelopment Analysis (DEA) is a well-known method for determining a company's efficiency level by benchmarking the input and output data used by each organizational activity or Decision Unit Making (DMU) - in this case, warehousing activities - to determine the adjustment of differences in increasing efficiency levels [10]. The allocation of inputs and outputs in an organization's or company's process can be used to identify and assess the sources of inefficiencies [9]. On actions that occur in the warehouse, the input and output variables are employed based on the Frazelle model. These tasks are receiving, putting away, storage, order picking, and shipping, and they will reveal whether or not the company's warehouse is efficient [6]. According to Korpela [11], the DEA model may be used to solve multi-criteria problems by constructing a DEA model to quantify warehouse operator efficiency using AHP analysis and integrating it with input process data that is applied to all warehouse activities. Finally, the purpose of this research is to determine the warehouse's performance and efficiency level, as well as to make recommendations for improvement to retail managers and stakeholders in order to increase warehouse performance and efficiency.
2.1 Warehouse
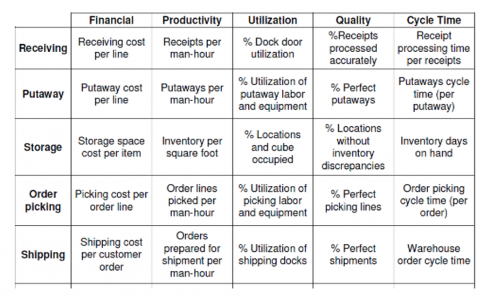
A warehouse is a structure used to store goods and supplies until production or other departments require them on a regular basis [6]. Receiving items or materials from suppliers, keeping products or materials properly until they are needed by other departments or for delivery, and retrieving products are the three basic responsibilities of a warehouse [12]. These tasks are associated with product standards, customer needs, and the degree of service provided. Because of the numerous operations that take place in the warehouse, it is separated into several sorts. Retail Warehouse is a warehouse in the retail industry with a high storage capacity. This warehouse keeps many different types of products and sells them directly to customers. Activities in the warehouse vary depending on I the quantity and type of items to be handled; (ii) the daily workload; and (iii) the quantity, qualities, and variety of procedures required to meet customer and supplier demand [12]. As a result, the warehouse has 25 KPI variables to measure, as shown in Figure 1.
Receiving, put-away, storage, order selection, and shipping are the five activities in warehousing, according to Figure 1. Finance, productivity, utility, quality, and cycle time are the five Key Performance Indicators (KPI) that can be used to measure each activity [6]. This indicator has been employed to measure warehouse performance of material construction [13]. Based on literature reviews in warehouse performance measurement, there are numerous methods and indicators to measure present warehousing performance, which differ in time, cost, quality, and productivity dimensions [14]. There is no consensus on the most effective and efficient technique to measure warehouse performance [15]. Furthermore, research on measuring retail warehouse performance is still in its early stages.
2.2 Data Envelopment Analysis (DEA)
DEA is a linear programming study that measures the efficiency of an organization's performance using a Decision Making Unit (DMU). DEA is used to carefully assess the relative efficiency of an institution or DMU that is similar and utilized as a benchmark in operations management [16, 17]. Using the DEA model, the DMU is directly compared to the same type in terms of the process that runs inside it (homogeneous). One of the benefits of DEA is that the measurement units for input and output might be different. Assuming there are n DMUs, each with m input and s output, the relative efficiency of DMU p can be calculated using the following model:
$\max =\frac{\sum\nolimits_{k=1}^{s}{{{v}_{k}}}.\text{ }{{y}_{k\text{ }p}}}{\sum\nolimits_{\text{j}=\text{1}}^{\text{m}}{{{u}_{j}}.\text{ }{{x}_{j\text{ }p}}}}$ (1)
Subject to:
$\frac{\sum\nolimits_{k=1}^{s}{{{v}_{k}}.}\text{ }{{y}_{k\text{ }i}}}{\sum\nolimits_{j=i}^{m}{{{u}_{j}}.\text{ }{{x}_{j\text{ }i}}}}\le 1\forall i$ (2)
${{v}_{k}},\text{ }{{u}_{j}}\ge 0\forall k,\text{ }j$ (3)
The DEA model contains multiple terms. Constant return scale (CRS) is a linear relationship between input and output, with each increment in input increasing proportionally and consistently. Variable return to scale (VRS) is the inverse of CRS in that there is no linear link between input and output, and every increment in input does not create proportional output, allowing efficiency to fluctuate. The ability of a unit to create the most possible output from a certain number of inputs is referred to as technical efficiency. Scale efficiency is an efficiency metric that takes into account the fact that the DMU does not operate ideally on a production scale and can reduce technical efficiency predictions from the CRS and VRS models.
Figure 1. Warehouse key performance indicators [6]
2.3 The Analytic Hierarchy Process (AHP)
The Analytic Hierarchy Process (AHP) is a multi-criteria decision making (MCDM) system developed by Saaty [18] in 1971. This method is a decision-making strategy meant to aid in the formulation of complex solutions including various problem criteria for a variety of applications [19]. AHP can be particularly beneficial in bringing together several decision-makers with opposing goals in order to create consensus [20]. AHP is a decision-making tool that can solve complicated decision issues by employing a multi-level hierarchical structure of objectives, criteria, sub-criteria, and alternatives. This method is a practical decision-making framework that simplifies and accelerates the decision-making process by breaking the problem down into sections and then organizing them in a hierarchical order. Then assign a numerical number to subjective judgments about the relevance of each variable that has the highest priority and has the most influence on the outcome in that situation.
3.1 Research objects
The efficiency of warehouse activities was examined in four retail warehouses in the Indonesian provinces of Yogyakarta and Central Java. Household, school, and workplace supplies are sold at retail stores or supermarkets. These warehouses range in size from 175 m2 to 200 m2 and employ a warehouse staff of less than ten persons. Receiving goods, checking items, transferring products to the warehouse, and putting things into storage stacks are all examples of warehouse activities. According to the display order, goods are picked up and delivered to the supermarket or minimart.
3.2 Research stages
The following are the stages in this research: (1) establishing the warehouse key performance indicators (KPIs) based on the Frazelle model (2) determining input and output variables based on the importance weight of KPI using the Analytical Hierarchy Process (AHP), (3) developing DEA linear programming model, (4) analyzing efficiency based on the DEA model, (6) performing a sensitivity analysis to see how much improvement can be achieved, and (7) proposing improvement strategies to increase efficiency.
Based on the Frazelle model, surveys and interviews were conducted in four retail warehouses to generate warehouse performance characteristics for each warehouse activity. Four companies' warehousing business practices were investigated. Receiving products, putting away - placing goods in the warehouse, Storage - storing goods in the warehouse, order picking - taking things in the warehouse, and delivery - delivering goods are the actions that take place in the company's four warehouses. Goods from the warehouse are sent to the display section in the case of supermarkets and minimarkets. There are five indicators in it as a reference for measuring performance among the five activities, including finance, productivity, utilization, quality, and cycle time. The variables are then weighted using AHP analysis to determine the input and output variables in the DEA model. In the DEA model, the variable with the highest importance weight for each activity will be chosen as an important variable for input-output. Using AHP, an inter-indicator pairwise comparison questionnaire was created, and four retail warehouse managers were invited to fill out the questionnaire with their preferences. To assess expert preferences, a scale of 1 to 9 is used (1 = equal, 3 = moderate, 5 = strong, 7 = very strong, and 9 = extreme). To assess comparison consistency, the Consistency Ratio (CR) is calculated [14]. The CR in this study is less than 0.1, indicating that the comparison is consistent.
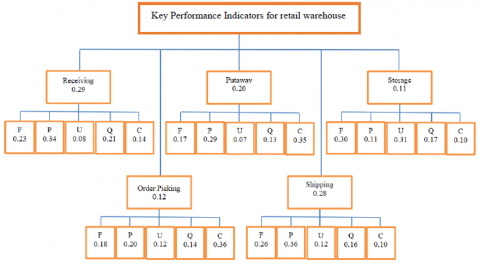
Figure 2 depicts the important weighting values obtained using the AHP approach. As input and output variables, the variables from each action on the KPI with the highest weighted value are chosen. Table 1 shows the input and output variables.
*F= Financial, P = productivity, U = Utilization, Q =Quality, C= Cycle time
Figure 2. The importance weight for KPI
Table 1. Input and output variable
|
Activities |
Variable |
AHP Weighted |
Input / Output |
|
Receiving |
Productivity |
0.34 |
Input |
|
Put away |
Cycle Time |
0.35 |
Input |
|
Storage |
Utilization |
0.31 |
Input |
|
Order Picking |
Cycle Time |
0.36 |
Output |
|
Shipping |
Productivity |
0.36 |
Output |
Table 2. Performance for each DMU
|
Variable |
DMU 1 |
DMU2 |
DMU 3 |
DMU4 |
|
X1 |
U11 |
U12 |
U13 |
U14 |
|
receipt per man-hour |
106.67 |
216 |
108.4 |
100 |
|
X2 |
U21 |
U22 |
U23 |
U24 |
|
put away cycle time |
5.25 |
5 |
3.3 |
3.6 |
|
X3 |
U31 |
U32 |
U33 |
U34 |
|
%location and cube occupied |
70 |
90 |
95 |
50 |
|
Y1 |
Y11 |
Y12 |
Y13 |
Y14 |
|
order picking cycle time |
0.5 |
0.3 |
0.75 |
0.5 |
|
Y2 |
Y21 |
Y22 |
Y23 |
Y24 |
|
order prepared for shipment per man-hour |
20 |
112 |
10 |
60 |
Receiving, putting away, and storage are the five actions of the Frazelle model that belong to the input variables, whereas order picking and shipping are the activities that belong to the output variables. This finding is consistent with the warehouse KPI obtained by Kusrini et al. [13]. The variable for receiving activity is productivity, as shown in Table 1. (Receipt per man-hour). The average operator ability to receive items per hour is defined as receipt per man-hour (unit/hour). Cycle time is the variable for put away activity (put away cycle time). The total number of objects moved each hour is referred to as the put away cycle time (unit/hour). Utilization is a storage variable (percent location and cube occupied). The total area used for storing items in the warehouse is expressed as a percentage of location and cube occupied (%). Cycle time is a variable in order picking (order picking cycle time). The overall time required to gather goods per order is referred to as the order picking cycle time (unit/order). Productivity is a shipping variable (order prepared for shipment per man-hour). The total item required to deliver goods per hour is the order prepared for shipment per man-hour (unit/hour). Table 2 displays the performance statistics for each DMU.
The DMU stands for retail warehouse understudy, X stands for input variables, and Y stands for output variables. The nth input in the research is designated by Xj, where j is one of one, two, or three. X1 (reception per man-hour), X2 (put away cycle time), and X3 are the input variables (percent location and cube occupied). In the study, the nth output is designated by Yk, where k is between 1 and 2. Y1 (order picking cycle time) and Y2 are the output variables (order prepared for shipment per man-hour). The CRS Primal model was utilized as the DEA model to determine the relative efficiency of each DMU [21, 22]. The variable calculation for each DMU is illustrated in the mathematical models below:
Relative efficiency $M a x Z p=v 1 p \cdot y 1+v 2 p \cdot y 2$ (4)
Subject to
$u1p.\text{ }x1+u2p.\text{ }x2+u3p.\text{ }x3=1$ (5)
$v1i.y1+v2i.y2-u1i.\text{ }x1-u2i.\text{ }x2-u3i.\text{ }x3\le 0\text{ }(\text{DMU }1)$ (6)
$\begin{align} & v1i.y1+v2i.y2-u1i.\text{ }x1-u2i.\text{ }x2-u3i.\text{ } \\ & x3\le 0\text{ }(\text{DMU }2) \\\end{align}$ (7)
$\begin{align} & v1i.y1+v2i.y2-u1i.\text{ }x1-u2i.\text{ }x2-u3i.\text{ } \\ & x3\le 0\text{ }(\text{DMU }3) \\\end{align}$ (8)
$\begin{align} & v1i.y1+v2i.y2-u1i.\text{ }x1-u2i.\text{ }x2-u3i.\text{ } \\ & x3\le 0\text{ }(\text{DMU }4) \\\end{align}$ (9)
$y1,\text{ }y2\ge 0$ (10)
$x1,\text{ }x2,\text{ }x3\ge 0$ (11)
CRS Dual is used to determine the variable slack value's target improvement. The CRS Dual computation yields the optimal variable value and slack variable value, which may be utilized as a reference for boosting efficiency for effective DMU. The CRS Dual mathematical model is as follows:
$\operatorname{Min} Z-0.000901-0.000902-0.0009 I 1$ $-0.0009 I 2-0.0009 I 3$ (12)
Subject to
V11P1+V12P2+V13P3+V14P4+V15P5-O1=V1p (13)
V21P1+V22P2+V23P3+V24P4+V25P5-O2=V2p (14)
U11P1+U12P2+U13P3+U14P4+U15P5-U1pZ+I1=0 (15)
U21P1+U22P2+U23P3+U24P4+U25P5-U2pZ+I2=0 (16)
U31P1+U32P2+U33P3+U34P4+U35P5-U3pZ+I3=0 (17)
P1 ≥0, P2 ≥0, P3 ≥0, P4 ≥0, P5 ≥0, O1 ≥0, O2 >=0, I1 ≥0, I2 ≥0, I3 ≥0 (18)
Along with the VRS mathematical model below, VRS evaluate whether the efficiency of DMU is driven by a pure technicality or whether there are additional influencing elements beyond the DMU.
$Maximize\text{ }Z=\theta -\varepsilon \text{ }s_{1}^{+}-\varepsilon \text{ }s_{1}^{+}-\varepsilon \text{ }s_{1}^{-}-\varepsilon \text{ }s_{2}^{-}-\varepsilon \text{ }s_{3}^{-}$ (19)
Subject to
${{v}_{11}}{{\lambda }_{1}}+{{v}_{12}}{{\lambda }_{2}}+{{v}_{13}}{{\lambda }_{3}}+{{v}_{14}}{{\lambda }_{4}}+{{v}_{15}}{{\lambda }_{5}}-s_{1}^{+}={{v}_{1p}}$ (20)
${{v}_{21}}{{\lambda }_{1}}+{{v}_{22}}{{\lambda }_{2}}+{{v}_{23}}{{\lambda }_{3}}+{{v}_{24}}{{\lambda }_{4}}+{{v}_{25}}{{\lambda }_{5}}-s_{2}^{+}={{v}_{2p}}$ (21)
$\begin{align} & {{u}_{11}}{{\lambda }_{1}}+{{u}_{12}}{{\lambda }_{2}}+{{u}_{13}}{{\lambda }_{3}}+{{u}_{14}}{{\lambda }_{4}} \\ & +{{u}_{15}}{{\lambda }_{5}}-{{u}_{1p}}\theta +s_{1}^{-}=0 \\\end{align}$ (22)
$\begin{align}& {{u}_{21}}{{\lambda }_{1}}+{{u}_{22}}{{\lambda }_{2}}+{{u}_{23}}{{\lambda }_{3}}+{{u}_{24}}{{\lambda }_{4}} \\ & +{{u}_{25}}{{\lambda }_{5}}-{{u}_{2p}}\theta +s_{2}^{-}=0 \\\end{align}$ (23)
$\begin{align} & {{u}_{31}}{{\lambda }_{1}}+{{u}_{32}}{{\lambda }_{2}}+{{u}_{33}}{{\lambda }_{3}}+{{u}_{34}}{{\lambda }_{4}} \\ & +{{u}_{35}}{{\lambda }_{5}}-{{u}_{3p}}\theta +s_{3}^{-}=0 \\\end{align}$ (24)
${{\lambda }_{1}}+{{\lambda }_{2}}+{{\lambda }_{3}}+{{\lambda }_{4}}+{{\lambda }_{5}}=1$ (25)
${{\lambda }_{1}},{{\lambda }_{2}},{{\lambda }_{3}},{{\lambda }_{4}},{{\lambda }_{5}}\ge 0$ (26)
$s_{1}^{+},s_{2}^{+}\ge 0$ (27)
$s_{1}^{-},s_{2}^{-},s_{3}^{-},s_{4}^{-},s_{5}^{-}\ge 0$ (28)
DMU1 is inefficient, according to CRS primal, with an efficient value of 0.8086574. DMUs 2, 3, and 4 are efficient, with an efficient value of 1. The CRS basic model then calculates the TE (technically efficient) value and the slack variable value, as shown in Table 3.
The amount of effectiveness The TE achieved by decreasing the input level will be used to generate or maximize the output level [23]. The TE value of DMU1 is 1.257491. Meanwhile, DMU2, DMU3, and DMU4 have TE = 1 and are considered efficient since Z = 1. DMU1 has slack in the O1 (1.553568), I1 (0.004017985), and I3 (0.004017985). (0.005823908). The TE value and the slack variable value are the outcomes of VRS. CRS allows for global efficiency measurement, but in reality, ideal behavior may be hampered by a number of circumstances, therefore VRS must distinguish between pure technological efficiency and scale efficiency [23]. Table 4 displays the VRS model's output.
The VRS model result in Table 4 indicates the value of TE (1.128387) in DMU1, while TE = 1 in DMU2, DMU3, and DMU4 because Z = 1 and are considered efficient. On the I1, DMU1 has slack (0.007839805). The value of TE acquired as a consequence of the CRS and VRS calculations is utilized to compute the value of Scale Efficiency (SE). SE also provides information on whether the DMU is at a low or high efficiency [24, 25].
DMU1 has a TEVRS value greater than SE, as seen in Table 5. Because the efficiency change in DMU1 is driven by pure technical efficiency, the target improvement corresponds to the CRS dual target. The percentage of improvement in Table 6 pertains to the CRS dual in DMU1.
Sensitivity analysis was used in this study to determine changes in efficiency. The goal of sensitivity analysis is to identify the impact of changes in efficiency values on DMUs that are not yet efficient when modifications are anticipated. Because the limiting function will bind the objective function, the dual price value obtained from the CRS calculation is used as a reference. The sensitivity analysis of CRS dual in DMU1 is shown in Table 7.
Table 3. Value, TE & slack variable CRS dual
|
DMU |
Ø |
TE |
Slack Variable |
|
DMU1 |
0.7952339 |
1.257491 |
O1: 1.553568 I1: 0.004017985 I3: 0.005823908 |
|
DMU2 |
1 |
1 |
- |
|
DMU3 |
1 |
1 |
- |
|
DMU4 |
1 |
1 |
- |
Table 4. Value, TE & slack variable VRS
|
DMU |
Ø |
TE |
Slack Variable |
|
DMU1 |
0.8862205 |
1.128.387 |
I1 :0.007839805 |
|
DMU2 |
1 |
1 |
- |
|
DMU3 |
1 |
1 |
- |
|
DMU4 |
1 |
1 |
- |
Table 5. Technical efficiency CRS dual, technical efficiency VRS, and SE
|
DMU |
TECRS Dual |
TEVRS |
SE |
Explanation |
|
DMU1 |
1.257491 |
1.128387 |
1.114414 |
TEVRS > SE Influenced by pure technical efficiency (TEVRS) |
|
DMU2 |
1 |
1 |
1 |
TEVRS=SE |
|
DMU3 |
1 |
1 |
1 |
TEVRS=SE |
|
DMU4 |
1 |
1 |
1 |
TEVRS=SE |
Table 6. Percentage improvements CRS dual DMU 1
|
Variable |
Actual Value |
CRS Dual Target |
Difference |
Percentage |
|
Receiving, Receipt per man-hour (unit/hour) |
106.67 |
8.327.403 |
2.339.597 |
21.93% |
|
Putaways cycle time (unit/hour) |
5.25 |
5.25 |
0 |
0 |
|
Storage, %Location and Cube occupied (%) |
70 |
5.526.457 |
1.473.543 |
21.05% |
|
Order picking cycle time (unit/order) |
0.5 |
2.05 |
1.55 |
310% |
|
Shipment per man-hour (unit/hour) |
20 |
20 |
0 |
0 |
Table 7. Dual price and contribute to Ø CRS dual
|
DMU |
Variable |
Dual Price |
Improvement |
Contribute to Ø |
Enhancement Ø |
|
DMU1 CRS Dual |
Y1 (Order Picking) |
-1.554468 |
0.5 |
-0.777234 |
0.0179999 |
|
X1 (Receiving) |
0.004917985 |
21.84641787 |
0.107440355 |
0.902674255 |
|
|
X3 (Storage) |
0.006723908 |
14.33945091 |
0.096417149 |
15.13468481 |
|
|
Ø CCR dual DMU1 = |
0.7952339 |
∑ Contribute to Ø = |
-0.573376496 |
Efficiency Improvement = |
0.221857404 |
The total contribution of goal improvements to efficiency is 0.221857404 or 22.18 percent, calculated by adding Y1, X1, and X3. This efficiency boost will be realized if DMU improves its performance in order picking, receiving, and storing. A DEA sensitivity study was performed to see how the efficiency of the DMU changed when one of the input variables was added or removed from the DEA computation [26]. Benchmarking with other efficient DMUs could help improve inefficient DMU. Hierarchy cluster analysis is used to determine the distance between the inefficient DMU1 and the resulting DMU 3 as the benchmarking goal. DMU1 must take several activities to meet the efficiency target outlined in Table 6, including reducing cycle time at order picking, increasing productivity in receiving, and increasing storage utilization. Increasing warehouse worker capability is critical since people play a critical role in achieving warehouse efficiency. This method is consistent with prior study [27], which discovered that employee performance influences the number of employees and their work arrangements. Productivity gains are realized by reducing the effort on receiving items, enhancing accuracy, and anticipating the risk of worker injuries. Employee workload analysis has a significant impact on the escalation of efficiency and productivity [27]. Increasing Utilization can be accomplished by relaying out and lowering the utilization of storage space so that it can be used for other reasons. Because the warehouse is modest, increased efficiency in this study still necessitates human services for loading and unloading goods. The usage of a more current technology, such as an autonomous robot system, has been implemented, resulting in higher productivity and job quality [28-30]. However, for small warehouses, the deployment of automated equipment necessitates a more thorough financial feasibility examination. DMUs in ideal and efficient settings, notably DMU2, DMU3, and DMU4, must continue to improve in order to remain competitive. This is also done since efficiency levels might fluctuate fast [23].
The warehouse is critical to increasing corporate performance and the supply chain. Warehouse performance can be improved by boosting efficiency with the DEA approach. Input-output variables are chosen based on the performance metrics with the highest importance weight in each warehouse operation. The DEA study results reveal that benchmarking to DMUs with closeness or similarity can enhance the level of efficiency for inefficient DMUs. Sensitivity analysis suggests that the proposed enhancements could contribute up to 22.18 percent to the efficiency improvement targets. An effective DMU must nevertheless maintain its efficiency and strive for ongoing improvement. The next research opportunity is the study of increasing efficiency by considering the opportunities for the use of automation (autonomous robots) and its financial feasibility analysis.
The authors would like to express their gratitude to the Postgraduate Program in Industrial Engineering at the Islamic University of Indonesia for their assistance and appreciation during this research. We also welcome and value collaborative efforts from firms that are the subjects of this research, as well as collaboration and positive attitudes from all individuals who assist and contribute to this research.
[1] More, S.V. (2016). The study of efficiency and effectiveness of warehouse management in the context of supply chain management. International Journal of Engineering Technology, Management and Applied Sciences, 4(8): 160-169.
[2] Ackah, M.R., Erick, E.G. (2016). Assessing inventory management on performance of the production sector in Ghana. Dama International Journal of Research, 1(7): 17-27. https://doi.org/10.15373/22501991
[3] Sparks, L. (2010). Supply chain management and retailing. Supply Chain Forum: An International Journal, 11(4): 4-12. https://doi.org/10.1080/16258312.2010.11517242
[4] Minahan, S.M., Huddleston, P., Behe, B., Fernandez, R.T. (2013). Conducting field research in retail stores: A meandering path to a successful research project, The International Review of Retail, Distribution and Consumer Research, 23(2): 159-203. https://doi.org/10.1080/09593969.2012.743106
[5] Boysen, N., Koster, R., Fubler, D. (2021). The forgotten sons: Warehousing systems for brick-and-mortar retail chains. European Journal of Operational Research, 288(2): 361. https://doi.org/10.1016/j.ejor.2020.04.058
[6] Frazelle, E. H. (2002). World-Class Warehousing and Material Handling. McGraw-Hill Book Company.
[7] Saleheen, F., Mahadi, H.M., Mamun, H., Zurina, H. (2014). Challenges of warehouse operations: A case study in retail supermarket. UK. International Journal of Supply Chain Management, 3(4): 63-67.
[8] Tang, L., Huang, X., Peng, Y., Xiao, Z. (2015). Analysis and evaluation of relative efficiency of warehousing and distribution operation based on mixed DEA model. Chemical Engineering Transaction, The Italian Association of Chemical Engineering, 46: 583-588. https://doi.org/10.3303/CET1546098
[9] Reiner, G., Hofmann, P. (2006). Efficiency analysis of supply chain processes. International Journal of Production Research, 44(23): 5065-5087. https://doi.org/10.1080/00207540500515123
[10] Balk, B.M., De Koster, M.B.M., Kaps, C., Zofío, J.L. (2021). An evaluation of cross-efficiency methods: With an application to warehouse performance. Applied Mathematics and Computation, 406: 126261. https://doi.org/10.1016/j.amc.2021.126261
[11] Korpela, J., Antti, L., Jukka, N. (2007). Warehouse operator selection by combining AHP dan DEA methodologies. International Journal Production Economics, 108(1-2): 135-142. https://doi.org/10.1016/j.ijpe.2006.12.046
[12] De Koster, M.B.M., Warffemius, P.M.J. (2005). American, Asian, and third-party international warehouse operations in Europe: A comparison. International Journal of Operations and Production Management, 25(8): 762-780. https://doi.org/10.1108/01443570510608592
[13] Kusrini, E., Fadrizal, N., Vembri, N.H. (2018). Determining key performance indicators for warehouse performance measurement – A case study in construction materials warehouse. Matec Web Conf. The 2nd International Conference on Engineering and Technology for Sustainable Development, 154: 01058. https://doi.org/10.1051/matecconf/201815401058
[14] Staudt, F.H., Alpan, G., Mascolo, M.D., Rodriguez, C.M.T. (2015). Warehouse performance measurement: A literature review. International Journal of Production Research, 53(18): 5524-5544. https://doi.org/10.1080/00207543.2015.1030466
[15] Kusrini, E., Ahmad, A., Murniati, W. (2019). Design key performance indicator for sustainable warehouse: A case study in a leather manufacturer. IOP Conf. Series: Materials Science and Engineering, 598: 012042. https://doi.org/10.1088/1757-899X/598/1/012042
[16] El-Demerdash, B.E., El-Khodary, I.A., Tharwat, A.A. (2016). A stochastic data envelopment analysis model considering variation in input and output variable. International Journal of Data Envelopment Analysis and Operations Research, 2(1): 1-6. https://doi.org/10.12691/ijdeaor-2-1-1
[17] Saati, S., Adel, H.M., Majid, T. (2011). Data envelopment analysis: An efficient duo linear programming approach. International Journal Productivity and Quality Management, 7(1): 90-103. https://doi.org/10.1504/IJPQM.2011.037733
[18] Saaty, T. (2008). Decision making with the analytic hierarchy process. Int. J. Services Sciences, 1(1): 83-98. https://doi.org/10.1504/IJSSCI.2008.017590
[19] Elhuni, R.M., Ahmad, M.M. (2017). Key performance indicators for sustainable production evaluation in oil and gas sector. Procedia Manufacturing, 11: 718-724. https://doi.org/10.1016/j.promfg.2017.07.172
[20] Mandal, S., Mandal, S.S. (2016). Analytical Hierarchy Process (AHP) approach for selection of open cast coal mine project. International Journal of Industrial Engineering Research and Development (IJIERD), 7(2). https://doi.org/10.34218/IJIERD.7.2.2016.001
[21] Banker, R.D., Charness, A., Cooper, W.W. (1984). Some models for estimating technical and scale inefficiencies in data envelopment analysis. Management Science, 30(6): 1078-1092. https://doi.org/10.1287/mnsc.30.9.1078
[22] Dar, F.Q., Tirupathi, R.P., Arif, M.T. (2016). Mixed input and output orientations of data envelopment analysis with linear fractional programming and least distance measures. Statistic, Optimization, and Information Computing, International Academic Press, 4(4): 326-341. https://doi.org/10.19139/soic.v4i4.225
[23] Coelli, T. (1996). A Guide to DEAP version 2.1. A Data Envelopment Analysis (Computer) Program. CEPA working paper No. 8/96. Center for Efficiency and Productivity Analysis, University of New England.
[24] Chueni, N., Eves, C. (2016). Technical, allocative and scale efficiency of Malaysian REITS: The preliminary finding. 22nd Annual Pacific-Rim Real Estate Society Conference, Australia, pp. 1-15.
[25] Azadeh, A., Haghighi, S.M., Zarrin, M., Khaefi, S. (2015). Performance evaluation of Iranian electricity distribution unit by using stochastic data envelopment analysis. Electrical Power and Energy System, 73: 919-931. https://doi.org/10.1016/j.ijepes.2015.06.002
[26] Lau, K.H. (2013). Measuring distribution efficiency of a retail network through data envelopment analysis. International Journal Production Economics, 146(2): 598-611. https://doi.org/10.1016/j.ijpe.2013.08.008
[27] Budiman, Y., Putranto, N.A.R. (2015). Workload analysis for planning needs of employee in PT. Batuwangi Putera Sejahtera. Journal of Business and Management, 4(4): 494-500.
[28] Guzel, M.S., Erwin, J., Wan Zakaria, W.N. (2014). Vision based object recognition of e-puck mobile robot for warehouse application. International Journal of Integrated Engineering, 6(3). https://penerbit.uthm.edu.my/ojs/index.php/ijie/article/view/1043.
[29] Bertolini, M., Esposito, G., Mezzogori, D., Neroni, M. (2019). Optimizing retrieving performance of an automated warehouse for unconventional stock keeping units. Procedia Manufacturing, 39: 1681-1690. https://doi.org/10.1016/j.promfg.2020.01.272
[30] Popovic, G., Cvišić, I., Écorchard, G., Marković, I., Přeučil, L., Petrović, I. (2022). Human localization in robotized warehouses based on stereo odometry and ground-marker fusion. Robotics and Computer–Integrated Manufacturing, 73: 102241. https://doi.org/10.1016/j.rcim.2021.102241