Atheer Saleem Almawla* | Assim Mohammed Lateef | Ammar Hatem Kamel
© 2022 IIETA. This article is published by IIETA and is licensed under the CC BY 4.0 license (http://creativecommons.org/licenses/by/4.0/).
OPEN ACCESS
The strain on any structure is a critical issue worldwide, resulting from loads on the structure. An exact prediction at all the expected strains ranges on the dam will pave the way for better dam management under different discharges. The main aims of the present paper are to study the behaviour of strains on the dam and create a model based on ANN techniques that can be used to predict the strain on the model of the Haditha dam. The ANN is a computational model that simulates the method neurons work in the human brain. The research includes a study of the strains on the dam body and the gate. The input of the present model includes gate opening, discharge, depth of upstream water, and force on the dam body and gate. The model has been applied by using 150 actual testes of strain in the hydraulic laboratory. The model has been achieved by using a MATLAB software with hyperbolic sigmoid transfer function and three nodes. The accuracy of the model was achieved by using some statistical indicators. The results show the ANN is capable of predicting the strain on the Haditha dam with high accuracy. The regression for both strains on the dam body and the gate was more than 89% for all training, validation, testing, and all samples.
artificial neural network, ANN, Haditha dam, hydraulic structures, prediction model, strain modelling
The need to provide a tool for reliable water control and supply and electrical power generation is the vested force for the construction of dams' worldwide [1]. In dam engineering, the risk analysis must be performed for evaluations of the structure's safety. Based on safety, dams are considered critical structures which mean accuracy during design, construction, and operation are needed with careful consideration. From an economical viewpoint, the consideration of all safety issues is impossible. Therefore, the risk analysis must be achieved to satisfy the economic and safety considerations simultaneously, which can help engineers to select a better or more accurate design. The behavior of hydraulic structures like dams and their accessories spillways and gates) under dynamic loading is one of the most critical cases of safety. Any structure has different dynamic behavior when it is in contact with water from it in contact with air. The selection of the appropriate model for analysis to predict or evaluate the dynamic behavior of dams is the most significant issue.
Understanding the relationships among discharge, forces, and strain has a significant role in managing the dam. One of the valuable techniques for predicting strain on the dam and gate is Artificial Neural Network techniques (ANN). The ANN is increasingly applied to solve various civil engineering problems. The artificial neural network (ANN) is a computing system component that simulates how the human brain analyses and processes information. It is a foundation of artificial intelligence (AI); it can solve problems impossible or difficult to solve by human or statistical standards [2]. The artificial neural network has the ability and approved to solve a number of complex problems in different applications which have nonlinear behaviour; in addition, the (AI) models provide an accurate prediction, less cost, and time-efficient solution [3-5].
In the last years, many civil engineers have attempted to study different applications using ANN techniques. Mahmood et al. [6], examined the Release of Water from Haditha Dam by using ANN. They used seven inputs factors: monthly Inflow rainfall, evaporation, reservoir storage, total monthly demand, and released water at the previous time to predict water release for Haditha dam. The authors used a sigmoid and hyperbolic tangent transfer function with two neurons. They found that ANN has accepted accuracy to forecast the release of water from the Hadith dam.
Al-Suhail et al. [7], studied a dynamic analysis of a dam-reservoir-foundation system using an Artificial Neural Network. They built the ANN model by used SPSS software for estimating hydrodynamic pressures and maximum stress, strains on the section of gravity dam under seismic excitation. Their results show the model capable of predicting stress and hydrodynamic pressures with high accuracy. The application of Artificial Neural Network (ANN) for Reservoir Water Level Forecasting has been studied by Rani and Parekh [8]. They used data of 16 years to train ANN and seven years of data to validate the water level model for their case study. Authors show that the ANN appropriate predictor for real-time Water Level forecasting of the study area.
The daily reservoir level of Millers Ferry dam in the USA was Predicted using Artificial Neural Network by Üneş et al. [9]. Their network was built according to the Levenberg-Marquardt optimisation technique to updates the weights and bias values. They have compared the result of the optimal ANN with conventional auto-regressive models (AR), auto-regressive moving average (ARMA), and multi-linear regression (MLR) models. Authors reached to results that the ANN models perform better than the conventional models to predict of daily reservoir level of Millers Ferry dam. The ANN models are used also to predict the daily evaporation, evaporation from subsurface reservoirs, and infiltration in the Iraqi western desert that included the region of the present study (Haditha Dam). Almawla [10] and Muneer et al. [11] and Kamel et al. [12] with very good accuracy for predicting.
In the present study, the high force comes from huge water mass collision on the dam body and gate can be caused high stress and strain because of the significant hydrodynamic pressure that is developed as well as the hydrostatic pressure on the dam upstream face. The dam and water in reservoir interact dynamically when the high stress and strain may be caused severe damage to the dam. Hydrodynamic water force affects the dam strain (deformation) and leads influence the pressure. The operation frequency of dams and intensity of water entered the reservoir because of flow rate increasing during the flood, depth of water in the reservoir (high level in fill and low level when it empty), stiffness of dams are the factors affecting the hydrodynamic behavior of dams and their response. Although there is a significant problem of the effect of strain and stress on the dam body and the gate, the studies are limited; therefore, the present study will highlight the effect of stress on the dam and radial gates.
The first contribution of the present study is to introduce a new artificial intelligence model to understand the effects of discharge, hydraulic forces on the gate and the body of the dam and predicting the strain on them; the second contribution is known as the most influential parameter on it.
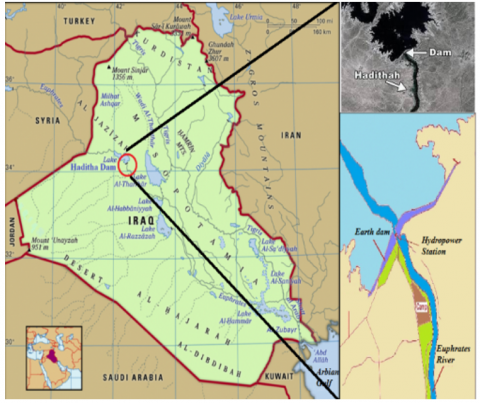
The modelling of the present study was built in the Hydraulic Laboratory of the University of Anbar, inside an open channel at a laboratory located in the Anbar governorate. The model was constructed to simulate strain on the gate and dam body of the Haditha dam. It was made from iron with a scale of 1:110. It was designed and constructed per the principles of hydraulic modelling and similarity. Haditha dam is an earthfall dam is located at 34°120 latitudes and 42°210 longitudes on the Euphrates River, about 270 km northwest of Baghdad (Figure 1). Haditha dam was constructed for multi-functional purposes and is used for hydroelectricity generation, regulation of the flow of the Euphrates River and irrigation of field water. The maximum water storage capacity of the dam is about 8.3 billion cubic meters with a maximum surface area of 500 km2. The spillway of dam is a controlled type with six radial gates divided by piers (5.0 m and 7.0 m thick). The dimension of radial gates is 13.5 m high, 16m width and 16.6 m radius [13]. The dam power station is an integral part of the dam, containing six vertical Kaplan turbines capable of producing 660 MW of power [14, 15].
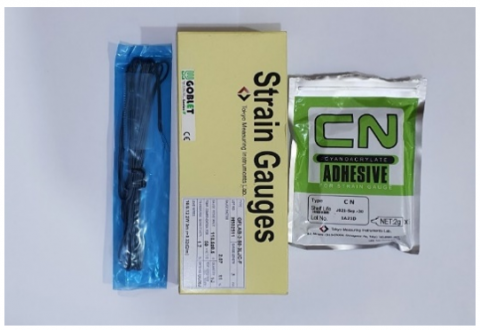
The relation between discharge and strain has been examined in the present study by using a strain gauge. To the sense of water forces on the model, some parts of the model were changed with plastic (gates and dam body) type Polyethylene Terephthalate Polyester (PETP) with (20 – 80) * 10-6 k-1 coefficient of thermal expansion (Figure 2). The Japanese strain gauge type GF series (GOBIET) (GFLA-3-50-3LJC-F) was used to determine of a strain on the model of the Haditha Dam spillway (see Figure 3). These strain gauges are suited to the measurement on materials such as plastics, which have low elastic modulus compared to metal. It was connecting to handheld data logger type S-2770 (TC-32k) used for data collection. Figure 2 illustrates the model through working.
Four strain gauges were fixed on the gate to simulate the maximum strain as possible. In addition, one strain gauge on the centre of the body dam. The strain gauges were fixed using glue (CN) after cleaning and sharpen the places. TML strain gauge coating material was used to waterproof the strain gauge, as shown in Figure 4. the average strain on the gate was used in ANN analysis.
Figure 1. Map of location and layout of Haditha dam on the Euphrates River [14]
Figure 2. The model with data logger and strain gauge
Figure 3. Strain gauge type GFLA
Figure 4. Strain gauge on gate and dam body dam
4.1 The analysis of forces on the model
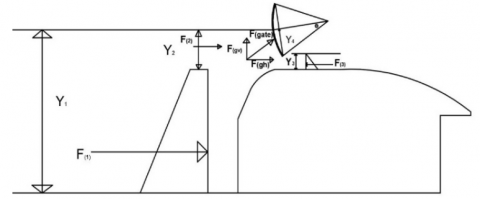
The forces on the model are analyzed to determine the relationship between discharge and strain. Figure 5 illustrates the analysis of forces on the model.
Figure 5. Force acting on the model
The average force on the dam body can be calculated by using Eq. (1) [16]:
$\mathrm{F} 1=\frac{y 1 \gamma+y 2 \gamma}{2}(0.3041) * w=237.15(\mathrm{y} 1+\mathrm{y} 2)$ (1)
where:
F1= average force on the body of the dam (N)
y1= depth of upstream water (m)
w = width of dam (m) = 0.159 m
y2= depth before the gate (m)
The average force on the gate with a partial opening is calculated from the vertical and horizontal force. The vertical gate force can be calculated from Eq. (2) [17]:
$\mathrm{F}_{\mathbf{g v}}=\gamma * V=\gamma\left(A_{s e c}-A_{t r a .}\right) * w=\gamma\left(\frac{\theta}{360} * \pi *\right.$
$\left.r^{2}-\frac{1}{2}(0.15 * \cos \theta * y 4)\right) * 0.145$ (2)
where:
y4 = (y2 – gate opening)
$\theta=\operatorname{Sin}^{-1}\left(\frac{y 4}{0.15}\right)$
$\gamma$ water density $=9810 \frac{N}{m^{3}}, \mathrm{r}$ (radius) $=0.15 \mathrm{~m}$
$A_{s e c}=$ area of sector, and $A_{\text {triangle }}=$ area of a triangle
Eqns. (3) and (4) determines the forces (F3, F4) [16] on the model.
$F_{2}=\frac{1}{2} \gamma * y_{2}^{2} * w=780.4 *\left(y_{2}^{2}\right)$ (3)
$F 3=\frac{1}{2} \gamma * y_{3}^{2} * w=711.22 *\left(y_{3}^{2}\right)$ (4)
After calculating all horizontal and vertical forces, the result of horizontal force has been calculated using the summation of forces in X-direction equal to the rate change of momentum.
$\sum F_{x}=0$ (5)
$\mathrm{Fgh}+\mathrm{F} 2-\mathrm{F} 3=$ Rate change of momentum $=\rho *$ $Q\left(V_{2}-V_{1}\right)$ (6)
According to USBR, Design of Small Dams, 1987, the (v2) can be found by using Eq. (7) [18].
$V_{2}=C \cdot \sqrt{2 g y}$ (7)
where: Y= vertical distance between the total upstream head and the centre of the gate opening.
C is a coefficient of discharge determined according to ( $\theta$ ) by using Figure 6.
Figure 6. Discharge coefficient Cg as a function of the angle ( $\theta$ ) [18]
4.2 The relation between strain and discharge
The relation between strain and discharge has been studied to understanding the behaviours of strain with different discharges. These relations were examined for the body of the spillway and on the gates as below.
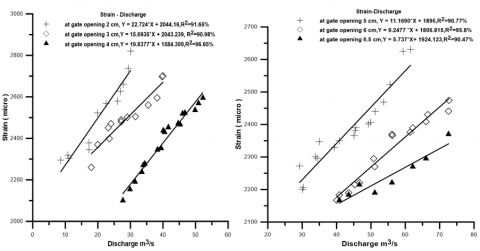
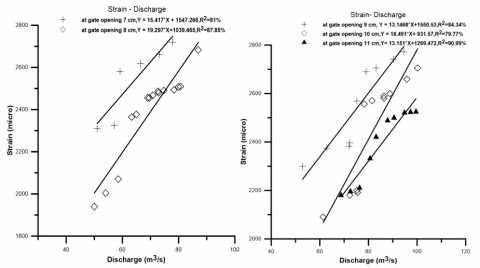
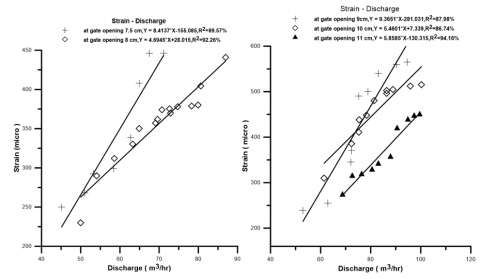
Figures 7 and 8 illustrate the relationship between discharge and strain on the gate and spillway at different gate openings.
The direct relationship between the discharge and strain can be shown in Figures 7 and 8. The increase of discharge leads to an increase of strain at the same gate opening. These direction relations result from an increase of discharge, leading to the rise of forces on the dam. The increase of forces leads to an increase in strain. On the other hand, the increase in gate opening leads to an increase in the flow cross-section area, reducing the pressure on the gate and dam body.
Figure 7. The relation between discharge and strain on the dam body at different gate openings
Figure 8. The relation between discharge and strain on the gate at different gate openings
4.3 ANN analysis of flow on the model
In hydrological modeling when modeling of non-linear connections of input and output is required, the ANN can be used [19]. A direct relation could be obtained using an ANN model, which needs a database of the set of output parameters related to input parameters. To obtain a direct relation by applying ANN, output variables database set related to the respective input variables are needed [8].
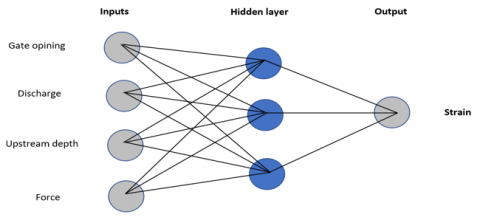
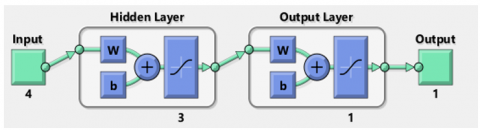
MATLAB 2020 Ra has been used to analysis of data from the model. Four inputs (gate opening, discharge, upstream depth, and force) have been considered as the input layer, and one output (strain) with three hidden neurons was used in the present study see Figure 9.
Figure 9. ANN network diagram
The data of input and target vectors were sets as three sets as follows:
The transfer functions used in the present network was (Hyperbolic Tangent) for both hidden and output layer as shown in Figure 10. The transfer function was chosen by try and error. Training a network and adjusting its weights can be accomplished using many different algorithms. Levenberg–Marquardt backpropagation (trainlm) technique was used in this study because it is recommended for most cases [21].
Figure 10. The transfer functions of the network
The hypotheses of model analysis by ANN are:
4.4 Validation of the accuracy of the ANN model
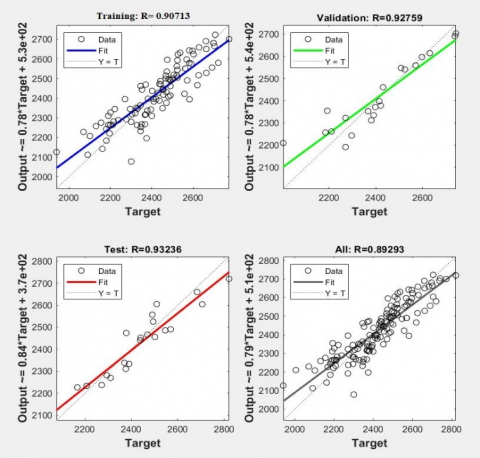
It is possible to measure the accuracy of the ANN application in several ways. Regression (R) is one of the most commonly used methods for this purpose. It is a statistical measure of the degree to which estimated values and actual measurements correlate. The network was training to achieve the best results according to regression and performance of the network. Figures 11 and 12 illustrated the regression for both dam and gate network training.
Figure 11. The scatter plot between observed and predicted strain on the dam
Figure 12. The scatter plot between observed and predicted strain on the gate
In Figures 10 and 11, there is a good regression between observed and predicted data for both models; all regression was more than 89% for validation, training, testing and all data. This is an indication of the accuracy of the model for determining the strain on the dam and gate.
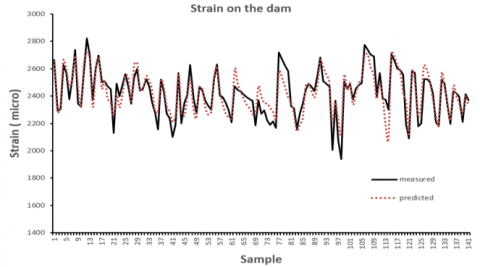
Figures 13 and 14 portray the measured value versus each model's predicted value. It is illustrating the measured and predicted value for the strain on the dam and the gate. In these figures, the comparison between the measured and predicted values shows a high agreement between them.
Figure 13. The measured and predicted strain for dam
Figure 14. The measured and predicted strain for gate
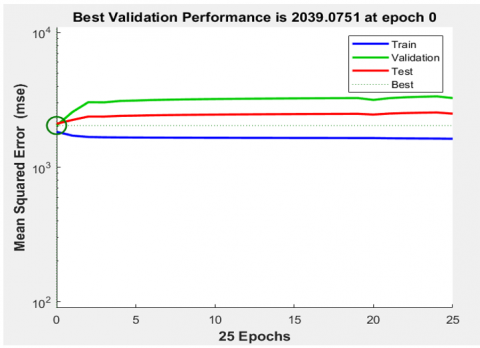
Another indicator for examining the accuracy of the relationship between observed and predicted is the best validation performance. The training stopped when the validation error increased for several iterations, as shown in Figures 15 and 16.
Figure 15. Best validation performance for the strain on the dam
Figures 15 and 16 show the results are reasonable because of both validations set error and test set error to have a similar characteristic, and there is no overfitting occurred by iteration zero. on the other hand, the root mean square error (RMSE) and main absolute error (MAE) have been calculated according to the Eq. (8) and (9) to achieve the accuracy of the model [22]. Table 1 illustrated the statistical parameter. The value of RMSE and MAE certain the high accuracy achieved between measured and predicted values.
Figure 16. Best validation performance for the strain on the gate
$R M S E=\sqrt{\frac{1}{N}} \sum_{i=1}^{N}\left(M_{i}-P_{i}\right)^{2}$ (8)
$M A E=\frac{1}{N} \sum_{i=1}^{N}\left|M_{i}-P_{i}\right|$ (9)
where:
$\mathrm{M}_{\mathrm{i}}=$ the measured value.
$\mathrm{P}_{\mathrm{i}}=$ the predicted value.
Table 1. The estimation results based on statistical parameter
|
Model |
RMSE (micro) |
MAE (micro) |
Regression % |
|
Dam body |
75.395 |
58.36 |
89.29 |
|
Gate |
43.56 |
34.219 |
89.1 |
4.4.1 Predicting the equation between input and output
The mathematical formulas for output depending on the transfer function types. It is generated by simple regression neural network. The input and output data must be scaled before training to remove their dimension and ensure that all variables receive equal attention during training. As part of the scaling process, the input and output are normalized to have the zero mean and unity standard deviation [23]. According to the output transfer function, which was Hyperbolic Tangent, the Eq. 10 has been used to scale the data [23].
$\mathrm{Xn}=\frac{2\left(X-X_{\min }\right)}{\left(X_{\max }-X_{\min }\right)}-1$ (10)
where:
$X_{\min }$ is a min value and $X_{\max }$ is a max value.
In the present study, the (TANH – TANH) transfer function was used, and the following equation was used to predicting the equation between input and target.
$\mathrm{Ij}=\sum I_{i} W_{j i}+\theta$ (11)
$\mathrm{X}=\sum W_{k j} * T A N H(I j)$ (12)
$\mathrm{O}=\mathrm{TANH}(\mathrm{X})$ (13)
where, i= 1,2,3..,9 ,10 (nodes in the input layers),j=1, 2, 3, 4, …12, 13 (nodes in the output layers), k=1 (output layer node), wji and wkj are training Weights given in Tables 2 and 3. Ii= Inputs, $\theta$ = bias. O= predicted outputs.
Table 2. Weights and bias for gate from the network training
|
Strain on the gate |
||||||
|
Weights and bias from input (I) to Hidden (H) layer |
Weights and bias from Hidden (H) to Output (O) layer |
|||||
|
Input |
H1-i |
H2-i |
H3-i |
H1-O |
H2-O |
H3-O |
|
I1 |
-10.786 |
-0.5612 |
3.7048 |
-0.6267 |
3.7755 |
-1.0365 |
|
I2 |
-1.8538 |
0.72298 |
-0.6312 |
|
|
|
|
I3 |
0.66693 |
0.02049 |
-0.5158 |
|
|
|
|
I4 |
4.2773 |
-0.0261 |
0.03097 |
|
|
|
|
Bias |
-0.7893 |
0.80326 |
2.0671 |
Bias |
-2.4134 |
|
Table 3. Weights and bias for dam body from the network training
|
Strain on the dam |
||||||
|
Weights and bias from input (I) to Hidden (H) layer |
Weights and bias from Hidden (H) to Output (O) layer |
|||||
|
Input |
H1-i |
H2-i |
H3-i |
H1-O |
H2-O |
H3-O |
|
I1 |
2.0767 |
1.2269 |
6.3014 |
0.50632 |
-4.0927 |
0.84582 |
|
I2 |
1.4264 |
-0.9071 |
-5.1591 |
|
|
|
|
I3 |
-2.1579 |
0.34321 |
0.53438 |
|
|
|
|
I4 |
2.5817 |
-0.2605 |
0.76923 |
|
|
|
|
Bias |
-1.3442 |
0.60358 |
0.84205 |
Bias |
2.0041 |
|
According to weights and bias in the Tables 2 and 3, the equation of predict strain on the dam body and gate has been writing as follow.
For dam body the Eqns. (14) to (18) can be used to determine the strain.
strain = 440.5*(TANH (X)) + 2380.5 (14)
X= 0.50632 * TANH (H1) - 4.0927 * TANH (H2) + 0.84582 *TANH (H3) + 2.0041 (15)
H1= 0.4072 d + 0.0303 Q – 0.3294 y + 0.0885 f - 3.3961 (16)
H2= 0.241 d – 0.0193 Q + 0.0524 y - 0.0089 f -1.071 (17)
H3= 1.235 d - 0.1098 Q + 0.0816 y + 0.02637f - 8.458 (18)
And the Eqns. (19) to (23) can be used to predict strain on the gate: -
The strain on the gate = 213*(TANH (X)) + 423 (19)
X= -0.62679 * TANH (H1) +3.7755 * TANH (H2) -1.0365 *TANH (H3) -2.4134 (20)
H1= - 2.115 d – 0.0394 Q + 0.1018 y + 0.3844 fg + 7.676 (21)
H2= - 0.11 d + 0.0154 Q +0.0031 y - 0.00235 fg + 0.6217 (22)
H3= 0.7264 d - 0.0134 Q – 0.0787 y + 0.00278 fg + 0.8851 (23)
where, d= open gate (cm), Q = discharge (m3/h), y= depth of upstream(cm), f = force on the dam body and (N) fg= force on the gate (n).
4.4.2 Analysis sensitivity of ANN model
A modified Garson algorithm has been used to analyse the model's sensitivity to determine which input factor has the greatest influence over strain. The Garson algorithm is used to determine the importance of input parameters in a neural network. By dividing the neural network connection output weights, this method estimates the relative importance of each input variable within a network. The details of the Garson algorithm show in Eq. (24) [24].
$Q_{i k}=\frac{\sum_{j=1}^{L}\left|w_{i j} v_{j k}\right| / \sum_{r=1}^{N}\left|w_{r j}\right|}{\sum_{i=1}^{N} \sum_{j=1}^{L}\left(\left|w_{i j} v_{j k}\right| / \sum_{r=1}^{N}\left|w_{r j}\right|\right)}$ (24)
where:
Figure 17. The importance of input factors for the strain on the dam
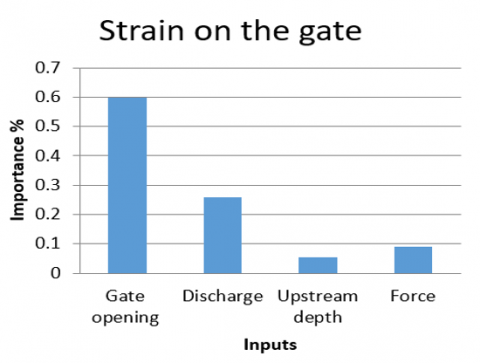
Figures 17 and 18 show the input factors' importance on the strain to gate and dam.
As illustrated in Figures 16 and 17, the gate opening, and the discharge are the most important variables for determining the strain on the gate and the dam body. The importance of gate opening reached about 60% and 40% on the gate model and dam model, respectively. The influence of discharge on the strain for each model is significant, and it reaches about 30% and 26% for the gate and dam models, respectively. The sensitivity results clearly illustrate the correlation between gate opening and discharge, and the strain, where logically, a slight decrement in gate opening and high discharge, can lead to higher strain. In terms of strain, force is the least influential, followed by upstream depth.
Figure 18. The importance of input factors for the strain on the gate
The Backpropagation neural network has the capacity to predict the strain on the Hadith dam. For both strain models on the dam body and the gate, the most influential input variable is the gate opening, followed by discharge, force, and depth of upstream water. The influents of a gate opening reached about 60%, 40% for the strain on the gate and dam body dam, respectively. The ANN model delivered a good estimation with acceptable regression of more than 89% for both models, indicating that the ANN is reliable for modelling strain on the Haditha dam. The mathematical equation has been predicating to estimate the strain on the dam body and the gate (Eqns. (12) and (17)). The predicted equation is beneficial to calculate the rating curve between discharge and strain at different gate openings; it is essential in the design of dams. Finally, the direct relation between discharge and strain has been noted.
The present study was limited by the dimensions of open channel in the hydraulic laboratory, which limited the scale of the model, and the discharge of the open channel was also limited between 10 m3/h to 140 m3/h, which restricted the study the effect of higher discharge. The future research can involve adding the effect of other dam's accessories such as turbine vibration and study their effect on the dam and gates. On the other hand, studying the special materials of the gate and concrete can carry high vibration and high loads.
Thanks to the civil engineering department/ college of Engineering/ Tikrit university and Dams and water resources engineering department/ college of engineering/University of Anbar for their support in achieving this work.
|
ANN |
Artificial Neuroal Network |
|
MSE |
Mean Square errors |
|
MAE |
Mean Absolute Relative Error |
|
RMSE |
Root Mean Square errors |
|
GRNN |
Generalized Regression Neural Network |
|
RBFNN |
Radial Basis Function Neural Network |
|
Subscripts |
|
|
Asec |
Area of Sector |
|
d |
open gate (cm) |
|
Q |
Discharge (m3/h |
|
y |
depth of upstream (cm |
|
f |
force on the dam body (N) |
|
fg |
force on the gate (N). |
|
$Q_{i k}$ |
the percentage of influence of input variable on the output |
|
$w_{i j}$ |
the connection weight between the input neuron i and the hidden neuron j |
|
$v_{j k}$ |
the connection weight between the hidden neuron j and the output neuron k |
[1] Rajaaa, A.I., Kamel, A.H. (2014). Performance study of fluent-2D and flow-3D platforms in the CFD modeling of a flow pattern over ogee spillway. Anbar Journal of Engineering Science, 8(4): 317-328.
[2] Farizawani, A.G., Puteh, M., Marina, Y., Rivaie, A. (2020). A review of artificial neural network learning rule based on multiple variant of conjugate gradient approaches. In Journal of Physics: Conference Series, 1529(2): 022040. http://dx.doi.org/10.1088/1742-6596/1529/2/022040
[3] Nikolić, V., Mitić, V.V., Kocić, L., Petković, D. (2017). Wind speed parameters sensitivity analysis based on fractals and neuro-fuzzy selection technique. Knowledge and Information Systems, 52(1): 255-265. http://dx.doi.org/10.1007/s10115-016-1006-0
[4] Petković, D., Nikolić, V., Mitić, V.V., Kocić, L. (2017). Estimation of fractal representation of wind speed fluctuation by artificial neural network with different training algorothms. Flow Measurement and Instrumentation, 54: 172-176. http://dx.doi.org/10.1016/j.flowmeasinst.2017.01.007
[5] Petković, D., Gocic, M., Trajkovic, S., Milovančević, M., Šević, D. (2017). Precipitation concentration index management by adaptive neuro-fuzzy methodology. Climatic Change, 141(4): 655-669. http://dx.doi.org/10.1007/s10584-017-1907-2
[6] Mahmood, K.R., Mustafa, A.S., Muhammed, A.S. (2012). Application of artificial neural networks to forecast the release water from Haditha dam. In Engineering Conference comprehensive research theses, Al-Mustansiriya University, 7(8): 974-986.
[7] Al-Suhaili, R.H.S., Ali, A.A.M., Behaya, S.A. (2014). Artificial neural network modeling for dynamic analysis of a dam-reservoir-foundation system. Journal of Engineering Research and Applications, 4(1): 121-143.
[8] Rani, S., Parekh, F. (2014). Application of artificial neural network (ANN) for reservoir water level forecasting. International Journal of Science and Research, 3(7): 1077-1082.
[9] Üneş, F., Demirci, M., Kişi, Ö. (2015). Prediction of millers ferry dam reservoir level in USA using artificial neural network. Periodica Polytechnica Civil Engineering, 59(3): 309-318. http://dx.doi.org/10.3311/PPci.7379
[10] Almawla, A.S. (2017). Predicting the daily evaporation in Ramadi city by using artificial neural network. Anbar Journal of Engineering Sciences, 7(2): 134-139.
[11] Muneer, A.S., Sayl, K.N., Kamal, A.H. (2021). Modeling of spatially distributed infiltration in the Iraqi Western Desert. Applied Geomatics, 13(3): 467-479. https://doi.org/10.1007/s12518-021-00363-6
[12] Kamel, A.H., Afan, H.A., Sherif, M., Ahmed, A.N., El-Shafie, A. (2021). RBFNN versus GRNN modeling approach for sub-surface evaporation rate prediction in arid region. Sustainable Computing: Informatics and Systems, 30: 100514. http://dx.doi.org/10.1016/j.suscom.2021.100514
[13] Almawla, A.S., Kamel, A.H., Lateef, A.M. (2021). Modelling of flow patterns over spillway with CFD (Case study: Haditha Dam in Iraq). International Journal of Design and Nature and Ecodynamics, 16(4): 373-385. http://dx.doi.org/10.18280/ijdne.160404
[14] Li, J., Ameen, A.M.S., Mohammad, T.A., Al-Ansari, N., Yaseen, Z.M. (2018). A systematic operation program of a hydropower plant based on minimizing the principal stress: Haditha Dam case study. Water, 10(9): 1270. http://dx.doi.org/10.3390/w10091270
[15] Sissakian, V.K., Adamo, N., Al-Ansari, N., Knutsson, S., Laue, J., Elagely, M. (2018). A comparative study of mosul and haditha dams, Iraq: Geological conditions. Journal of Earth Sciences and Geotechnical Engineering, 8(2): 35-52.
[16] Sharma, S.K. (2017). Irrigation engineering and hydraulic structures. S. Chand Publishing, pp. 923-931.
[17] Munson, B.R., Young, D.F., Okiishi, T., Huebsch, W.W. (2009). Fundamentals of Fluid Mechanics, sixth Edition. Morgantown, West Virginia, USA: John Wiley & Sons, Inc.
[18] Reclamation, U.S.B.O. (1987). Design of small dams. US Department of the Interior, Bureau of Reclamation.
[19] Muneer, A.S., Sayl, K.N., Kamel, A.H. (2020). Modeling of runoff in the arid regions using remote sensing and geographic information system (GIS). International Journal of Design & Nature and Ecodynamics, 15(5): 691-700. https://doi.org/10.18280/ijdne.150511
[20] Shahin, M.A. (2003). Use of artificial neural networks for predicting settlement of shallow foundations on cohesionless soils/Mohamed A. Shahin (Doctoral dissertation). https://hdl.handle.net/2440/21900.
[21] Bui, X.N., Muazu, M.A., Nguyen, H. (2020). Optimizing Levenberg–Marquardt backpropagation technique in predicting factor of safety of slopes after two-dimensional OptumG2 analysis. Engineering with Computers, 36(3): 941-952. http://dx.doi.org/10.1007/s00366-019-00741-0
[22] Chai, T., Draxler, R.R. (2014). Root mean square error (RMSE) or mean absolute error (MAE)?–Arguments against avoiding RMSE in the literature. Geoscientific Model Development, 7(3): 1247-1250. http://dx.doi.org/10.5194/gmd-7-1247-2014
[23] Mahmood, K.R., Aziz, J. (2010). Using artificial neural networks for evaluation of collapse potential of some Iraqi gypseous soils. In Information Technology in Geo-Engineering: Proceedings of the 1st International Conference (ICITG) Shanghai, p. 134.
[24] Zhou, B., Vogt, R.D., Lu, X., Xu, C., Zhu, L., Shao, X., Liu, H.L., Xing, M. (2015). Relative importance analysis of a refined multi-parameter phosphorus index employed in a strongly agriculturally influenced watershed. Water, Air, & Soil Pollution, 226(3): 1-13. http://dx.doi.org/10.1007/s11270-014-2218-0