Hussein Abad Gazi Jaaz | Ali Fadhil Naser* | Hussam Ali Mohammed | Ayad Ali Mohammed
© 2021 IIETA. This article is published by IIETA and is licensed under the CC BY 4.0 license (http://creativecommons.org/licenses/by/4.0/).
OPEN ACCESS
The evaluation of structural safety must be taken after each earthquake. The importance losses of life and materials carries the significance of the works in the field of earthquake engineering. The purpose of this study was to optimize and evaluate the earthquake resistance of bridge piers by adopting different cross-section forms and dimensions for bridge supports under earthquake action. Two methods of seismic design were used in the optimization and evaluation process. These methods were demand to capacity ratio (DCR) and yielding point. The results of demand to capacity ratio shown that the values of DCR for all piers forms models were increased when the dimension of pier cross section were increased and the values of DCR became less than 1.0, indicating that the increasing in dimensions leading to rise the capacity of bridge supports to carry the earthquake loads in transverse and longitudinal direction. Comparing with models, solid wall pier form had the lower value of DCR, indicating that solid wall piers were suitable in the design of bridge supports to resist the lateral loads of earthquake and it has enough stiffness and capacity under earthquake action. The results of performance points shown that the yielding points were increased when the dimensions of piers were increased for all piers form in transverse and longitudinal direction. The maximum values were appeared within support No. 1 and support No. 4. Solid wall form of pier had the higher values of yielding points, meaning that this type of piers form had higher seismic capacity and it will resist the earthquake action more than others piers form. This study recommended that to use third model for each pier form in the design of bridges structures to resist the earthquake load. Also this study was recommended to use solid wall piers as supports in construction of bridge structure within areas had earthquake action.
optimization, evaluation, safety, pier form, earthquake, demand, capacity, yielding point
Structural component of bridges structure consists of three parts. Firstly, it is known superstructure which contains deck, beams or girders, pavement surface, expansion joints, security barriers, drainage system, and bearings. Secondly, it is called substructure which is the structural part used to support the superstructure of the bridge and transport self-weight of superstructure and external loads such as traffic load to the foundation of bridge and it includes piers, pier cap and abutment. Thirdly, it is known foundation which is represented the portion transmitted the loads to the soil, and it includes piles and piles cap. All parts of bridge structure were made by using concrete which is quasi-brittle material that shows altered behavior in compression and tension action [1-8].
Piers offer perpendicular supports for spans of bridge structure which is located at intermediary points and make two main purposes. The first purpose is transporting the superstructure vertical loads to the foundations and also they are resisting horizontal loads acting on the bridge such as earthquake load wind load, water pressure. There are many piers types which are used in construction of bridge depending on constructed materials and piers form (pier cross-section shape). In general, piers are constructed by using reinforced concrete or steel with different shapes such as square, circle, solid wall, rectangular, tube filled with concrete. According to type of bridge and loads, the number of piers is varied and there are certain parameters can be affected on the spacing of piers such as the superstructure type, the spacing between girders, and the size of the piers (dimensions). The Choice of piers type for a bridge should be founded on functional, structural, and geometric requirements [9-13].
After each earthquake, the important losses of life and materials carries the significance of the works in the field of earthquake engineering and the evaluation of structural safety must be taken. Calculating the seismic hazard of an area encountered as a devoted part of pre-earthquake disaster management is among the stoppages that can be implemented. The critical influence of earthquake actions reveals some weaknesses in urban environments. Generally, because of the factors and level of earthquake, soil characteristics, and type of structures, the amount of the damages will increase or decrease. When the damages caused by previous earthquakes are considered, the interaction significance of earthquake and soil and structure becomes apparent. Therefore, the structures design and assessment become more evocative by defining the relationship between these three factors. The seismic risk must be recognized properly to define the earthquake behavior of structures and to reduce the damages of earthquake actions [14-20].
The main significant task of bridges structures is allowing the traffic of roads and railways transportations to cross the rivers and valleys and provides safety with limited damages without collapse. The important of this case shows a unlimited role in the engineering designs for a probable earthquake wave. The earth states of soil and supports types affect considerably the behavior of bridge piers when investigated the structure of damaged piers after subjected to earthquake action. Differences in ground situations cause important variations in the seismic behavior of bridges structure which they have tall piers and higher displacements can occur by softening uniform soil structure. When the bridge structure subjected to earthquake actions, the dynamic behavior of bridge can be calculated by using deterministic methods in time domain and frequency domain methods which is based on random vibration theory [21, 22].
In the seismic design of bridges, the seismic earth-shaking risk should be considered by using an acceleration response spectrum. Each bridge must be consigned to one of four seismic design categories. These categories include category A, B, C, and D according to the one-second period design spectral acceleration for the design of earthquake [23].
There are two parameters can be used in evaluation of seismic design of bridge supports. These parameters are demand and capacity. Demand denotes to all external load such as self-weight (dead load of bridge structure), wind, earthquake, and snow. Capacity refers to overall ability of a bridge structure to carry an enacted demand. The purposes of demand and capacity analysis are to notice that structure has enough capacity to carry demands or not, to increase capacity by changing the material properties or cross section form and dimensions, to determine the failure of structural member which occurs when demand is more than capacity. In general, demand to capacity ratio must be saved less than one or at least equal to one to avoid failure. This can be completed by increasing the cross section of structural members, reducing the loads, increasing the strength of the material by replacing the material or improving the properties of construction materials [24].
Demand to capacity ratio (D/C) is a method has been firstly offered by Applied Technology Council (ATC). The internal forces and displacements resulting by using an elastic analysis for design earthquake (demand) are compared with the capacity of structural members to resist the forces and displacements due to earthquake action. When demand to capacity ratio is more than one, it is indicating that the structural member will subject to failure and there needs for retrofitting. The demand to capacity ratio can be associated to section ductility demand of 2 or 3, when the ductility is measured in the section. The demand to capacity method has been imperiled to more detailed investigation in the bright of recent developments in earthquake reaction studies. The main difficulty meeting in the using of this method is that there is no relationship between member and structure ductility parameter because of the non-linear behavior [25, 26].
The need for performance evaluation of existing bridges against earthquake load has become an important issue in Indonesia lately. This evaluation is motivated by many new bridge constructions, on one side, and recent large magnitude earthquake events, which caused bridge damage, on the other side. It is a significant feature to check the seismic susceptibility of bridges when they are subjected to an earthquake action. Demand to capacity ratio is the ratio between demand of the structure in the identified situations under all external applied loads and the capacity of the structure which it will perform throughout its life time to resist the external loads which it is used to assess the structural performance of the bridge structure under effect of different types of loads. When demand to capacity ratio is 0, it means that there is no damage to structure and when it is equal to 1.0, it means that the structure is at the limit of failure [27, 28].
The purpose of this study is to optimize and evaluate the earthquake resistance of bridge piers by adopting different cross-section forms and dimension for bridge supports under earthquake action.
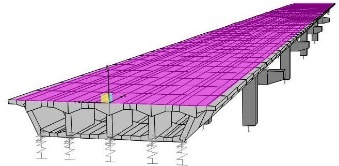
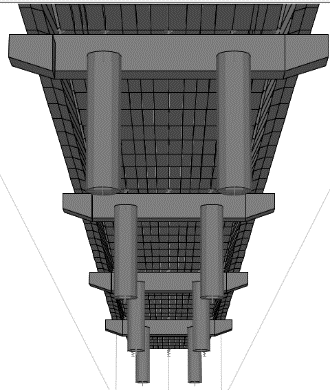
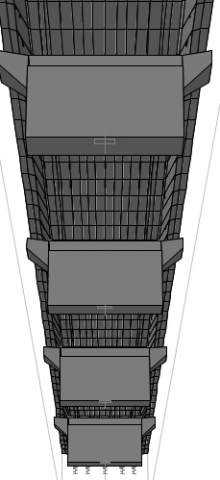
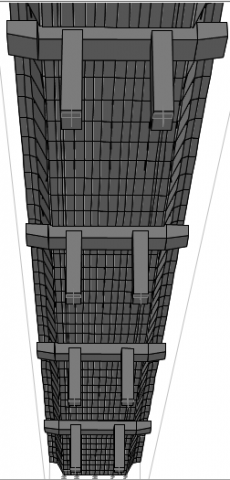
Prestressed concrete box girder bridge is selected to study the optimization and evaluation of earthquake resistance of bridge piers by adopting different piers cross-section forms and dimensions. The bridge structure consists of five spans. Each span has length equal to 25 m. Therefore, the total length of bridge structure is 125 m. The cross-section of girder is four cells box girder bridge which is constructed by using prestressed concrete grade 40. The width and height of bridge girder is 11 m and 1.8 m respectively. The bridge structure has four supports. Four piers forms with different three dimensions are selected in this study which represent the most common forms that are using in the construction of bridge substructure. These four forms include square form, circle form, solid wall form, and rectangular form. All bridge supports have two piers except supports which has solid wall form. The height of each pier is 5 m. Table 1 lists the pier form and dimensions with model symbol. Figure 1 shows the models of bridge supports.
Table 1. Pier form and dimensions with model symbol
|
Pier Form |
Pier Dimensions (m) |
Model Symbol |
|
Square |
1.2 m ×1.2 m |
S1 |
|
1.5 m ×1.5 m |
S2 |
|
|
1.8 m ×1.8 m |
S3 |
|
|
Circle |
D=1.2 m |
C1 |
|
D=1.5 m |
C2 |
|
|
D=1.8 m |
C3 |
|
|
Solid wall |
11 m ×1.2 m |
SO1 |
|
11 m ×1.5 m |
SO2 |
|
|
11 m ×1.8 m |
SO3 |
|
|
Rectangular |
1 m ×1.2 m |
R1 |
|
1 m ×1.6 m |
R2 |
|
|
1 m ×2 m |
R3 |
(a) 3D view
(b) Elevation view
(c) Square pier form
(d) Circle pier form
(e) Solid wall pier form
(f) Rectangular pier form
Figure 1. Models of bridge supports
A bearing of bridge plays important role in the construction of bridges structures because of they are the structural devices which are used to transfer the loads of superstructure and external loads to the substructure. Bearings are one of the most vulnerable components in the resistance of earthquakes events. The bearings can be classified according to types of structure and different conditions. These types include seismic isolation bearings (elastomeric bridge bearings), pinned bearings, rocker bearing, roller bearing, and fixed bearing. In general, bearings allow for two types of superstructure movement. Firstly, it is the translational movement and secondly is rotational movement [29-31].
In this study, elastomeric seismic isolation bearings are used for abutments restrain any movement in vertical direction and rotational movement around the layout line of bridge structure. For interior supports, seismic isolation bearings (fixed bearing) are used and they allow just rotation with fixing the others forms of movement.
4.1 Demand to capacity ratio for square form of piers model
Table 2 and Figure 2 shows the results of demand, capacity, and DC-ratio (DCR) for bridge supports in transverse direction (Y-axis). From these table and figure it can be seen that all values of DC-ratio are less than 1.0, indicating that the bridge structure has enough capacity to resist the earthquake action. The maximum value of DC-ration is 0.88 and 0.86 and they are appeared within model S1 (support No. 3 and support No. 2 respectively) which has smaller dimensions of pier cross-section. The minimum value of DC-ratio is 0.24 within model S3 (support No. 1 and support No. 4) which has greater piers dimensions. For square form models, the increasing of pier cross-section dimensions lead to decreased the demand to capacity ratio, then increasing the capacity of bridge supports to carry the earthquake loads in transverse direction.
Table 3 and Figure 3 illustrates the values of demand, capacity, and DC- ratio for bridge supports in longitudinal direction (X-axis). All values of DC-ratio are less than 0.5, indicating that there are no damages in longitudinal direction of bridge supports and they have enough capacity. Also, it can be notes that the earthquake action can be affected the bridge structure in transverse direction more than longitudinal direction. For square form of piers, this study recommended that using of S3 model in the design of bridge structure because of it gives capacity values more than demand.
Figure 2. DCR in transverse direction of square form of pier
Figure 3. DCR in longitudinal direction of square form of pier
Table 2. DCR in transverse direction of square form of pier
|
Model Name |
Support No. 1 |
Support No. 2 |
||||
|
Demand |
Capacity |
D/C Ratio |
Demand |
Capacity |
D/C Ratio |
|
|
S1 |
0.037 |
0.064 |
0.57 |
0.059 |
0.068 |
0.86 |
|
S2 |
0.015 |
0.047 |
0.31 |
0.024 |
0.049 |
0.48 |
|
S3 |
0.009 |
0.037 |
0.24 |
0.014 |
0.042 |
0.33 |
|
|
Support No. 3 |
Support No. 4 |
||||
|
Demand |
Capacity |
D/C Ratio |
Demand |
Capacity |
D/C Ratio |
|
|
S1 |
0.059 |
0.067 |
0.88 |
0.037 |
0.064 |
0.57 |
|
S2 |
0.024 |
0.048 |
0.50 |
0.015 |
0.048 |
0.31 |
|
S3 |
0.014 |
0.039 |
0.35 |
0.009 |
0.037 |
0.24 |
Table 3. DCR in longitudinal direction of square form of pier
|
Model Name |
Support No. 1 |
Support No. 2 |
||||
|
Demand |
Capacity |
D/C Ratio |
Demand |
Capacity |
D/C Ratio |
|
|
S1 |
0.036 |
0.089 |
0.40 |
0.036 |
0.094 |
0.38 |
|
S2 |
0.029 |
0.073 |
0.39 |
0.029 |
0.077 |
0.37 |
|
S3 |
0.025 |
0.075 |
0.33 |
0.024 |
0.080 |
0.30 |
|
|
Support No. 3 |
Support No. 4 |
||||
|
Demand |
Capacity |
D/C Ratio |
Demand |
Capacity |
D/C Ratio |
|
|
S1 |
0.040 |
0.094 |
0.42 |
0.041 |
0.090 |
0.45 |
|
S2 |
0.033 |
0.077 |
0.42 |
0.033 |
0.073 |
0.45 |
|
S3 |
0.027 |
0.080 |
0.33 |
0.028 |
0.075 |
0.37 |
4.2 Demand to capacity ratio for circle form of pier
According to Table 4 and Figure 4, the maximum value of demand to capacity ratio (DC-ratio) in transverse direction is 1.31 in support No. 2 and support No. 3 within model C1 which has lower diameter (1.2 m). these values are more than 1.0, indicating that the design of these piers is not suitable to resist earthquake load because of they have not enough capacity and have more demand. The minimum value of DC-ratio is equal to 0.36 in model C3 within support No. 1 and Support No. 4. and they are less than 1.0, Therefore, there is no damage in the piers of these supports because of the capacity is more than demand. It can be shown that the values of demand and DC-ratio are decreased with increasing of diameter of cross-section of circle piers, meaning that the design has greater dimension of circle diameter is effective to resist the action of horizontal earthquake.
For longitudinal direction, Table 5 and Figure 5 shows the results of demand, capacity, and DC-ratio. It can be seen that from them the all values of DC-ratio are less than 1.0 and they are decreased with increasing of circle diameter. Therefore, the bridge piers will resist the horizontal loads in longitudinal direction. It can be concluded that the effects of horizontal earthquake loads are important in transverse direction than longitudinal direction and the increasing of pier dimension will reduce the effects of these loads and make piers more stiffness and have enough capacity.
Figure 4. DCR in transverse direction of Circle form of pier
Figure 5. DCR in longitudinal direction of Circle form of pier
Table 4. DCR in transverse direction of circle form of pier
|
Model Name |
Support No. 1 |
Support No. 2 |
||||
|
Demand |
Capacity |
DC-Ratio |
Demand |
Capacity |
DC-Ratio |
|
|
C1 |
0.039 |
0.046 |
0.84 |
0.063 |
0.048 |
1.31 |
|
C2 |
0.020 |
0.039 |
0.51 |
0.032 |
0.040 |
0.80 |
|
C3 |
0.012 |
0.033 |
0.36 |
0.018 |
0.033 |
0.54 |
|
|
Support No. 3 |
Support No. 4 |
||||
|
Demand |
Capacity |
DC-Ratio |
Demand |
Capacity |
DC-Ratio |
|
|
C1 |
0.063 |
0.048 |
1.31 |
0.039 |
0.046 |
0.84 |
|
C2 |
0.032 |
0.040 |
0.80 |
0.020 |
0.039 |
0.51 |
|
C3 |
0.018 |
0.033 |
0.54 |
0.012 |
0.033 |
0.36 |
Table 5. DCR in longitudinal direction of circle form of pier
|
Model Name |
Support No. 1 |
Support No. 2 |
||||
|
Demand |
Capacity |
DC-Ratio |
Demand |
Capacity |
DC-Ratio |
|
|
C1 |
0.036 |
0.064 |
0.56 |
0.036 |
0.066 |
0.54 |
|
C2 |
0.032 |
0.055 |
0.58 |
0.032 |
0.056 |
0.57 |
|
C3 |
0.028 |
0.051 |
0.54 |
0.027 |
0.052 |
0.51 |
|
|
Support No. 3 |
Support No. 4 |
||||
|
Demand |
Capacity |
DC-Ratio |
Demand |
Capacity |
DC-Ratio |
|
|
C1 |
0.040 |
0.066 |
0.60 |
0.041 |
0.064 |
0.64 |
|
C2 |
0.036 |
0.056 |
0.64 |
0.037 |
0.055 |
0.67 |
|
C3 |
0.031 |
0.052 |
0.59 |
0.032 |
0.051 |
0.62 |
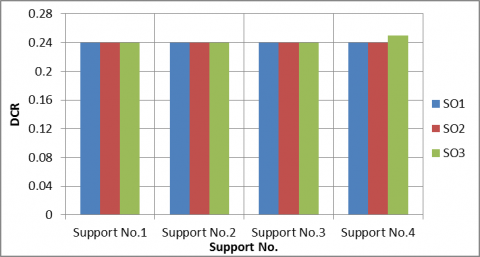
4.3 Demand to capacity ratio for solid wall form of pier
This type of pier appears lower demand and higher capacity, leading to give lower values of DC-ratio for all models of piers with different dimensions. All values of DC-ratio are less than 0.5 and the increasing of cross-section dimension has not significant effect on the reducing of demand and DC-ratio because of this type has enough capacity and stiffness to resist the earthquake loads. Tables 6, Figure 6, Table 7, and Figure 7 show the values of demand, capacity, and DC-ratio in transverse and longitudinal direction respectively.
Figure 6. DCR in transverse direction of solid wall form of pier
Figure 7. DCR in longitudinal direction of solid wall form of pier
Table 6. DCR in transverse direction of solid wall form of pier
|
Model Name |
Support No. 1 |
Support No. 2 |
||||
|
Demand |
Capacity |
D/C Ratio |
Demand |
Capacity |
D/C Ratio |
|
|
SO1 |
0.003 |
0.013 |
0.23 |
0.004 |
0.019 |
0.21 |
|
SO2 |
0.003 |
0.012 |
0.25 |
0.004 |
0.018 |
0.22 |
|
SO3 |
0.002 |
0.011 |
0.18 |
0.004 |
0.017 |
0.23 |
|
|
Support No. 3 |
Support No. 4 |
||||
|
Demand |
Capacity |
D/C Ratio |
Demand |
Capacity |
D/C Ratio |
|
|
SO1 |
0.004 |
0.019 |
0.21 |
0.003 |
0.013 |
0.23 |
|
SO2 |
0.004 |
0.018 |
0.22 |
0.003 |
0.012 |
0.25 |
|
SO3 |
0.004 |
0.017 |
0.23 |
0.002 |
0.011 |
0.18 |
Table 7. DCR in longitudinal direction of solid wall form of pier
|
Model Name |
Support No. 1 |
Support No. 2 |
||||
|
Demand |
Capacity |
D/C Ratio |
Demand |
Capacity |
D/C Ratio |
|
|
SO1 |
0.034 |
0.138 |
0.24 |
0.034 |
0.139 |
0.24 |
|
SO2 |
0.029 |
0.118 |
0.24 |
0.029 |
0.118 |
0.24 |
|
SO3 |
0.021 |
0.087 |
0.24 |
0.021 |
0.085 |
0.24 |
|
|
Support No. 3 |
Support No. 4 |
||||
|
Demand |
Capacity |
D/C Ratio |
Demand |
Capacity |
D/C Ratio |
|
|
SO1 |
0.038 |
0.155 |
0.24 |
0.039 |
0.159 |
0.24 |
|
SO2 |
0.032 |
0.132 |
0.24 |
0.033 |
0.135 |
0.24 |
|
SO3 |
0.024 |
0.097 |
0.24 |
0.024 |
0.096 |
0.25 |
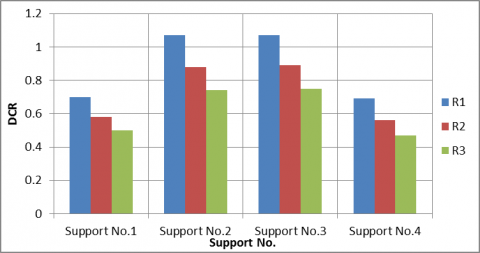
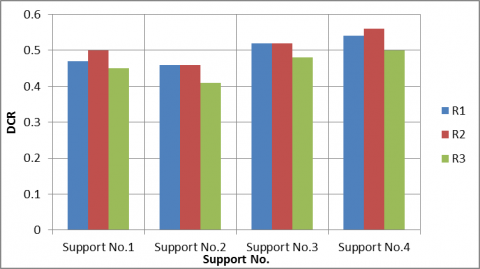
4.4 Demand to capacity ratio for rectangular form of pier
The model R1 (1 m × 1.2 m) of rectangular form of pier gives higher value of DC-ration which equals to 1.07 within support No. 2 and support No. 3. This value is more than 1.0. Therefore, the damage will appear in these supports when the seismic load effects in transverse direction. The minimum value is 0.47 and it is appeared in the model R3 (1 m × 2 m), which it has greater dimensions than others models of rectangular form of pier, within support No. 1 and support No. 4. It can be noted that the increasing of dimensions will lead to decrease the value of demand and DC-ratio and the structure has more capacity, stiffness, and resistance to earthquake action. In general, the values of DC-ratio in transverse direction are more and little less than 1.0, indicating that the dimensions of piers need to increase to get suitable design for seismic load. Table 8 and Figure 8 shows the values of demand, capacity, and DC-ratio of seismic displacement in transverse direction. Whereas, Table 9 and Figure 9 shows the values of demand, capacity, and DC-ratio of seismic displacement in longitudinal direction. All values of DC-ratio in longitudinal direction are less than 1.0, meaning that there is no damage due to seismic load in longitudinal direction.
Figure 8. DCR in transverse direction of rectangular form of pier
Figure 9. DCR in longitudinal direction of rectangular form of pier
Table 8. DCR in transverse direction of rectangular form of pier
|
Model Name |
Support No. 1 |
Support No. 2 |
||||
|
Demand |
Capacity |
D/C Ratio |
Demand |
Capacity |
D/C Ratio |
|
|
R1 |
0.044 |
0.062 |
0.70 |
0.071 |
0.066 |
1.07 |
|
R2 |
0.041 |
0.070 |
0.58 |
0.066 |
0.075 |
0.88 |
|
R3 |
0.039 |
0.077 |
0.50 |
0.062 |
0.083 |
0.74 |
|
|
Support No. 3 |
Support No. 4 |
||||
|
Demand |
Capacity |
D/C Ratio |
Demand |
Capacity |
D/C Ratio |
|
|
R1 |
0.071 |
0.066 |
1.07 |
0.044 |
0.063 |
0.69 |
|
R2 |
0.066 |
0.074 |
0.89 |
0.041 |
0.072 |
0.56 |
|
R3 |
0.062 |
0.082 |
0.75 |
0.039 |
0.082 |
0.47 |
Table 9. DCR in longitudinal direction of rectangular form of pier
|
Model Name |
Support No. 1 |
Support No. 2 |
||||
|
Demand |
Capacity |
D/C Ratio |
Demand |
Capacity |
D/C Ratio |
|
|
R1 |
0.035 |
0.073 |
0.47 |
0.035 |
0.076 |
0.46 |
|
R2 |
0.031 |
0.062 |
0.50 |
0.030 |
0.065 |
0.46 |
|
R3 |
0.026 |
0.057 |
0.45 |
0.025 |
0.060 |
0.41 |
|
|
Support No. 3 |
Support No. 4 |
||||
|
Demand |
Capacity |
D/C Ratio |
Demand |
Capacity |
D/C Ratio |
|
|
R1 |
0.039 |
0.075 |
0.52 |
0.040 |
0.073 |
0.54 |
|
R2 |
0.034 |
0.065 |
0.52 |
0.035 |
0.062 |
0.56 |
|
R3 |
0.029 |
0.060 |
0.48 |
0.029 |
0.057 |
0.50 |
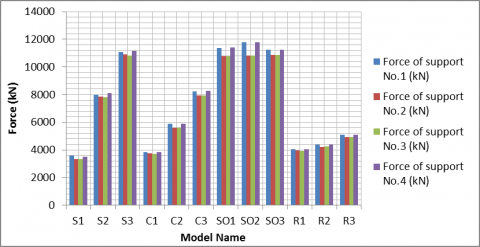
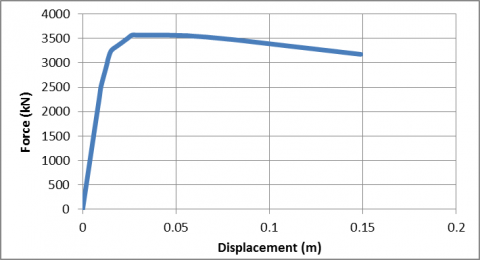
Yielding point based on force and displacement is important to determine the seismic capacity for bridges structure under earthquake lateral forces. it can be determined by adopting pushover analysis. It is a simple method to calculate the non-linear behavior of bridge structure under seismic loads. Pushover analysis method can help to prove the real failure in structures and to recognize the mode of final failure. Generally, the method also calculates probable weak regions in the structure by keeping path of the classification of damages of each and every part in the structure. Pushover analysis method is essentially based on the theory that the reaction of the structure is controlled by the first modes of vibration and modes shape [32-34].
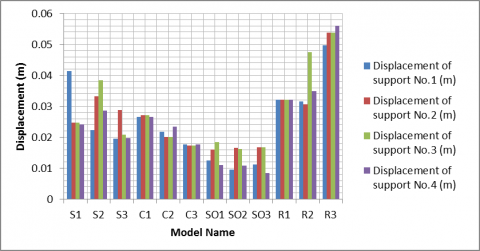
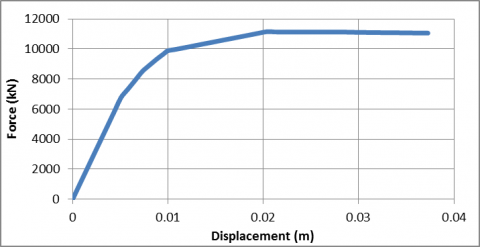
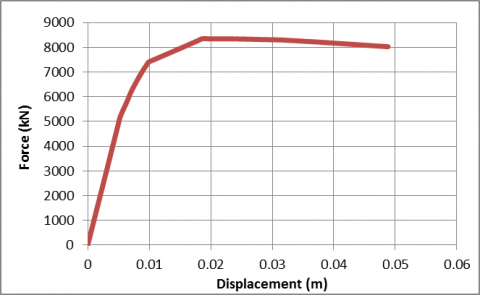
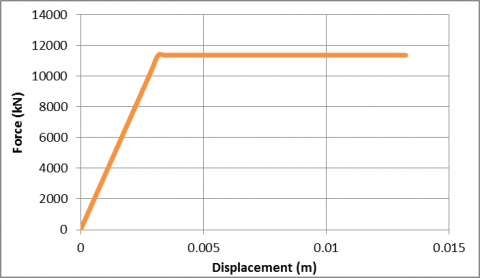
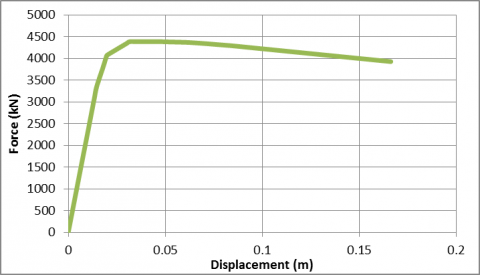
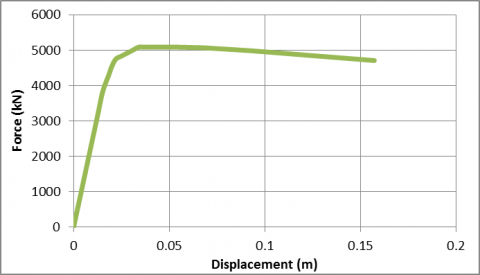
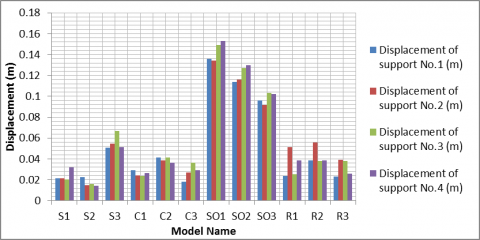
For transvers direction (width of bridge), Figure 10, and Figure 11 illustrates the results of yielding points for force-displacement according to pushover analysis. From them it can be noted that the yielding points are increased when the dimensions of piers are increased for all piers form and the maximum values are appeared within support No. 1 and support No. 4. Solid wall form of pier has the higher values of yielding points, meaning that this type of piers form has higher seismic capacity and it will resist the earthquake action more than others piers form. Figure 12, Figure 13, Figure 14, and Figure 15 show the curve of yielding point for support No. 1 for each pier form model in transverse direction. For longitudinal direction (length of bridge), the results of yielding points are increased when the pier dimensions increased and the values are less than transverse direction values. Also solid wall form of piers appears maximum values of yielding points than square, circle, and rectangular piers form. Figure 16 and Figure 17 show the values of yielding points for force and displacement in longitudinal direction. These Figures show that solid wall form of piers appears maximum values of yielding points than square, circle, and rectangular piers form, indicating that this type of pier will suffer from failure later than others types of piers.
Figure 10. Force yielding points in transverse direction for bridges supports
Figure 11. Displacement yielding points in transverse direction for bridges supports
(a) Yielding point for model S1 of support No. 1
(b) Yielding point for model S2 of support No. 1
(c) Yielding point for model S3 of support No. 1
Figure 12. Pushover results for square form of pier in transverse direction
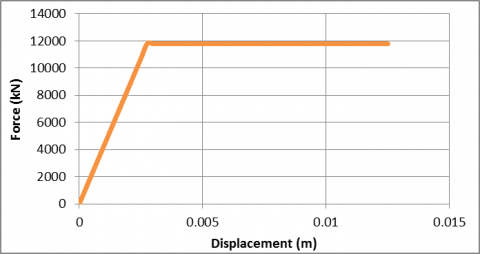
(a) Yielding point for model C1 of support No. 1
(b) Yielding point for model C2 of support No. 1
(c) Yielding point for model C3 of support No. 1
Figure 13. Pushover results for circle form of pier in transverse direction
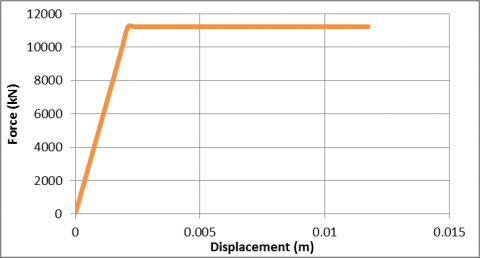
(a) Yielding point for model SO1 of support No. 1
(b) Yielding point for model SO2 of support No. 1
(c) Yielding point for model SO3 of support No. 1
Figure 14. Pushover results for solid wall form of pier in transverse direction
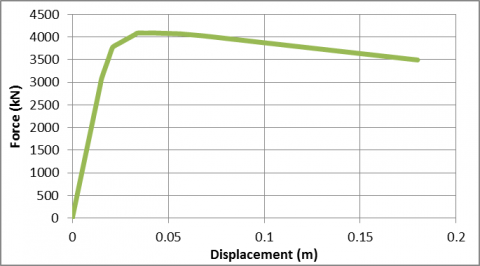
(a) Yielding point for model R1 of support No. 1
(b) Yielding point for model R2 of support No. 1
(c) Yielding point for model R3 of support No. 1
Figure 15. Pushover results for rectangular form of pier in transverse direction
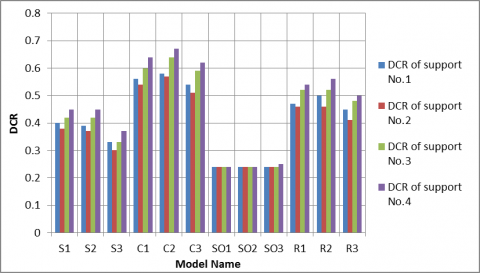
According to the abstract results of demand and capacity ratio for all piers forms which were shown in Figure 18 and Figure 19, it can be concluded that the circle pier (C1) form had the higher value of DCR in transverse and longitudinal direction than models of square, solid wall, and rectangular piers form, but this value was decreased with increasing of pier dimensions to be less than 1.0 for model C1 and C3. For the third model (higher dimensions) of piers form, rectangular pier form appeared maximum value of DCR in transverse direction than others models. Whereas, solid wall pier form had the lower value DCR and higher yielding points comparing with others models, indicating that solid wall piers are suitable in the design of bridge supports to resist the lateral loads of earthquake and it has enough stiffness and capacity under earthquake action. Therefore, this study is recommended to use solid wall piers as supports in construction of bridge structure within areas have earthquake action.
Figure 16. Force yielding points in longitudinal direction for bridges supports models
Figure 17. Displacement yielding points in longitudinal direction for bridges supports models
Figure 18. DCR in transverse direction of structural form of bridge piers
Figure 19. DCR in longitudinal direction of structural form of bridge piers
The conclusions of this study are:
(1) The main objective of this study is to optimize and evaluate the earthquake resistance of bridge piers by adopting different cross-section forms and dimension for bridge supports under earthquake action. Prestressed concrete box girder bridge is selected to study the optimization and evaluation of earthquake resistance of bridge piers by adopting different piers cross-section forms and dimensions. The bridge structure consists of five spans. Each span has length equal to 25 m. The width and height of bridge girder is 11 m. The bridge structure has four supports. Four piers forms with different three dimensions are selected in this study. These four forms include square form, circle form, solid wall form, and rectangular form. All bridge supports have two piers except supports which has solid wall form.
(2) The results of demand to capacity ratio shown that the circle pier (C1) form had the higher value of DCR in transverse and longitudinal direction than models of square, solid wall, and rectangular piers form, but this value was decreased with increasing of pier dimensions to be less than 1.0 for model C1 and C3. For the third model (higher dimensions) of piers form, rectangular pier form appeared maximum value of DCR in transverse direction than others models. Whereas, solid wall pier form had the lower value DCR comparing with others models, indicating that solid wall piers were suitable in the design of bridge supports to resist the lateral loads of earthquake and it has enough stiffness and capacity under earthquake action. Therefore, this study is recommended to use solid wall piers as supports in construction of bridge structure within areas have earthquake action.
(3) The results of performance points shown that the yielding points were increased when the dimensions of piers were increased for all piers form in transverse and longitudinal direction. The maximum values were appeared within support No. 1 and support No. 4. Solid wall form of pier had the higher values of yielding points, meaning that this type of piers form had higher seismic capacity and it will resist the earthquake action more than others piers form.
[1] Naser, A.F., Wang, Z. (2011). Damage inspection and performance evaluation of Jilin highway double-curved arch concrete bridge in China. Structural Engineering and Mechanics: An International Journal, 39(4): 521-539. https://doi.org/10.12989/sem.2011.39.4.521
[2] Mohammed, H.A., Naser, A.F. (2020). Mathematical assessment of vehicles types and loads influences on the structural performance parameters of concrete and steel bridges. Journal of Engineering Science and Technology, 15(2): 1254-1266.
[3] Naser, A.F. (2018). Optimum design of vertical steel tendons profile layout of post-tensioning concrete bridges: fem static analysis. ARPN Journal of Engineering and Applied Sciences, 13(23): 9244-9256.
[4] Naser, A.F., Wang, Z. (2011). Experimental inspection of damage and performance evaluation after repair and strengthening of Jiamusi highway prestressed concrete bridge in China. World Academy of Science, Engineering and Technology, 73: 195-201.
[5] Naser, A.F., Mohammed, H.A., Mohammed, A.A. (2021). Mathematical modeling of linear static and dynamic analysis for pier height effect on the structural performance of bridges structure. Mathematical Modelling of Engineering Problems, 8(4): 617-625. https://doi.org/10.18280/mmep.080415
[6] Naser, A.F. (2021). Analysis the effect of super-elevation on static and dynamic properties of horizontal curved concrete bridge by finite element. Journal of Engineering Science and Technology, 16(5): 3669-3686.
[7] Naser, A.F. Mohammed, H.A. (2020), Horizontal layout bend of bridges structure effects on the static design internal forces: Evaluation and optimization study. ARPN Journal of Engineering and Applied Sciences, 15(2): 186-191.
[8] Mahmood, A., Mohammad, K. (2019). Finite element analysis for RC deep beams under an eccentric load. Tikrit Journal of Engineering Sciences, 26(1): 41-50. https://doi.org/10.25130/tjes.26.1.06
[9] Jinrong, W. (2000). Piers and Columns, Bridge Engineering Handbook, Ed. Wai-Fah Chen and Lian Duan, Boca Raton: CRC Press.
[10] Amit, K., Kulkarni, M. (2018). Parametric study of bridge piers. International Research Journal of Engineering and Technology (IRJET), 5(1): 656-660.
[11] Mark, R. Basic concepts primer: Bridge components and elements (BIRM), Course No: S02-010, Continuing Education and Development, Inc. https://www.cedengineering.com/userfiles/Bridge%20Components%20and%20Elements.pdf.
[12] Naser, A.F. (2016). Effect of piers shape on the dynamic structural responses of prestressed concrete bridge: Part II. Journal of Babylon University/Engineering Sciences, 24(1): 14-25.
[13] Al-Hazragi, A., Lateef, A. (2021). Behaviour of uniaxial reinforced concrete columns strengthened with ultra-high performance concrete and fiber reinforced polymers. Tikrit Journal of Engineering Sciences, 28(2): 54-72.
[14] Ercan, I., Aydın, B., Yunus, L., Ekinci, M., Cihan, A., Ehsan, H. (2020). The effect of site-specific design spectrum on earthquake-building parameters: A case study from the Marmara region (NW Turkey). Applied Science, 10(20): 7247. https://doi.org/10.3390/app10207247
[15] Inel, M., Meral, E. (2016). Seismic performance of RC buildings subjected to past earthquakes in Turkey. Earthquakes and Structures, 11(3): 483-503. https://doi.org/10.12989/eas.2016.11.3.483
[16] Isik, E., Isik, M., Bulbul, M. (2017). Web based evaluation of earthquake damages for reinforced concrete buildings. Earthquakes and Structures, 13(4): 387-396. https://doi.org/10.12989/eas.2017.13.4.387
[17] Hadzima, N., Pavic, G., Lesic, M. (2016). Seismic vulnerability of older confined masonry buildings in Osijek, Croatia. Earthquakes and Structures, 11(4): 629-648. https://doi.org/10.12989/eas.2016.11.4.629
[18] Naser, A., Mohammed, H., Mohammed, A. (2021). Seismic design assessment of bridge piers location effect on the structural capacity of supports under earthquake action. International Journal of Safety and Security Engineering, 11(2): 143-153. https://doi.org/10.18280/ijsse.110203
[19] Harirchian, E., Jadhav, K., Mohammad, K., Aghakouchaki, H., Lahmer, T. (2020). Comparative study of MCDM methods integrated with rapid visual seismic vulnerability assessment of existing RC structures. Applied. Science, 10(18): 2-24. https://doi.org/10.3390/app10186411
[20] Akkar, S., Azak, T., Çan, T., Çeken, U., Tümsa, M, Duman, T., Kale, O. (2018). Evolution of seismic hazard maps in Turkey. Bulletin of Earthquake Engineering, 16: 3197-3228. https://doi.org/10.1007/s10518-018-0349-1
[21] Fevzi, S., Zeki, H. (2014). Dynamic behavior of an isolated bridge pier under earthquake effects for different soil layers and support. Teknik Dergi, 25(5): 1733-1756.
[22] Jia, H., Zhang, D., Zheng, S., Xie, W., Pandey, M. (2013). Local site effects on a high-pier railway bridge under tridirectional spatial excitations: nonstationary stochastic analysis. Soil Dynamics and Earthquake Engineering, 52: 55-69. https://doi.org/10.1016/j.soildyn.2013.05.001
[23] Anil, K., Huabei, L., Roy, A. (2012). Seismic design considerations Volume I: Technical Approaches and Results, Final Report, Report No. FHWA-NJ-2010-006, Federal Highway Administration U.S. Department of Transportation Washington, D.C. USA.
[24] Haseeb, J. (2017). Concept of demand & capacity in structures, https://www.aboutcivil.org/demand-capacity-structures.
[25] Sonawane, M., Dubey, S., Deodhar, S. (2013). An analytical approach to demand-capacity method. International Journal of Advanced Technology in Civil Engineering, 2(1): 17-23.
[26] Kenneth, T., Yahya, C. (2001). Capacity-demand index relationships for performance based seismic design, Structural Engineering Research Report, Report #NDSE-01-02, Department of Civil Engineering and Geological Sciences University of Notre Dame, Notre Dame, Indiana, USA.
[27] Lukman, M., Robby, P., Donald, E. (2020). Modal pushover analysis on reinforced concrete arch bridge to estimate seismic responses. E3S Web of Conferences, 156: 03005. https://doi.org/10.1051/e3sconf/202015603005
[28] Nilanjan, T., Prasad, M. (2020). Seismic performance of box girder bridge with non-linear static pushover analysis. International Journal on Emerging Technologies, 11(2): 897-904.
[29] Alperen, O. (2016). Seismic design of a prestressed concrete bridge. Master Thesis, University of New Orleans.
[30] Kevin, I., Fadel, A., Thomas, E. (2000). Seismic retrofit technology, Chapter 13, Bridge Engineering Handbook, Second Edition, Taylor & Francis Group, LLC.
[31] Riyad, A., Fares, J., Sara, S., Mucip, T. (2013). Seismic evaluation and retroβit of deteriorated concrete bridge components. Final Report, Syracuse University, Research and Innovative Technology Administration, U.S. Department of Transportation.
[32] Rahul, L. (2013). The Pushover analysis, explained in its simplicity. Proceedings of 2nd National Conference - RACE’13 at SAINTGITS College of Engineering, Kottayam.
[33] CSI Bridge. (2020). Integrated software for structural analysis and design. Computers and Structures Inc., Berkeley, CA, USA.
[34] Spyridon, T. (2008). Pushover analysis for seismic assessment and design of structures. Ph. D thesis, Heriot-Watt University, School of the Built Environment.