Ufaith Qadiri* | Mohmad Marouf Wani
OPEN ACCESS
In this contribution 15% ethanol blend with 85% gasoline, and micro-emulsion fuel (90% gasoline, 8% ethanol, & 2% H2O) was compared with 100% conventional gasoline fuel on 3-cylinder Spark Ignition engine to check its performance and emission characteristics. The AVL Boost software was used for predicting the performance and emission characteristics of 3-cylinder SI engine. It was found that although power increases for conventional 100% gasoline as the fuel, as compared to 15% ethanol blends and micro-emulsion fuel, but emissions were reduced more for micro-emulsion used as an alternative fuel in SI engine, and it meets the standards of present emission norms Euro 6. Micro-emulsion fuel was prepared in the lab by blending gasoline, ethanol and H2O was used as an additive in the fuel for improving its physical & thermal properties. The H2O molecule present in the fuel helped in reducing the emissions from 3-cylinder SI engine. As H2O addition increases the oxygen concentration in the micro-emulsion fuel which helps in enhancing the combustion of fuel, and in build oxygen atom inside the ethanol fuel also helps in better combustion which ultimately gives less CO, HC, & NOx emissions. The vibe-2 zone model was used for the combustion analysis of the engine which involves both burnt and unburnt gases in the combustion chamber. The results showed that micro-emulsion fuel not only improves the performance but also reduces the emissions. All the emissions CO, HC, and NOx showed decrease for ethanol blended fuel and micro-emulsion as compared to 100% gasoline fuel.
performance, bio fuel, emissions, AVL boost, micro-emulsions
As we all know fossil fuels are diminishing, and at the beginning of this century shortage of crude oil can drop off. Ethanol's bi-fuel diesel is widely used in the engine or mixed with petrol. Some studies have evaluated the effect of mixing ethanol-diesel / biodiesel on combustion operation and emission characteristics of the internal combustion engine [1-4]. However, little research has been done based on mixtures of ethanol gasoline and H2O. When ethanol is added to gasoline the oxygen content of blended fuel increases and higher the oxygen content of the fuel, the less CO emissions are formed because the fuel is completely burned [5-9]. In addition, with the use of ethanol containing water, the emissions are even lower, compared to 100% of gasoline as fuel [10]. In the case of HC emissions, there will be changes due to uneven combustion in the combustion chamber [11]. The most effective raw materials for making ethanol are burnt sugar. The equipment based on fuel often brings thanks to high quality material. Therefore, the required final content is 8% v / v and 12% [12]. In SI engine the ethanol blended gasoline fuel has been researched as an antiknock fuel. When used as a special fuel, the volumetric moisture content is about 5%. By blending the gasoline with water, the quantity of water should not be increased more than 5% in order to avoid the phase separation. The antiknock power of ethanol is more so it has a higher latent heat of vaporization (ethanol 904 kJ / kg, gasoline 350 kJ / kg). Increasing the cooling effect of the ethanol feed can increase volumetric efficiency [13]. To maximize cooling effect, the fraction of ethanol DI should be controlled to provide enough cooling without the fuel knock and cold start-up problems. In addition, low calorific value (LCV) of ethanol as compared to the conventional gasoline fuel, is 37% lower than gasoline because of which the volumetric fuel consumption of ethanol is increased for obtaining the same amount of energy. It also has an irritating effect on some of the alloys [14].
Due to the selected crops [14-16] and various industrial technologies, the amount of energy used to produce ethanol can vary from one place to another. In the production of ethanol its net energy balance phase is positive. Some of the main phases for the production of ethanol are distillation, dehydration, milling, fermentation, and saccharification. If the production of ethanol by secondary syrup (jaggery) of sugar refining process is required, then only dehydration, distillation, fermentation are required. As water in ethanol is completely miscible, and it makes an isotropic mixture quantitative concentration of water cannot be obtained by using distillation process in which ethanol concentration exceeds 95.6%. In some research it is shown [17, 18], ethanol energy consumption trend, which reaches 80% of the amount of water, increases linearly. From 80% to the azeotropic points, the demand for energy of distillation has increased rapidly. This greatly diminishes the net energy balance of bio ethanol life cycle, which augments its final cost in the market. To obtain complete ethanol, different methods of dehydration are employed. Although durable dehydration methods such as molecular sieves are implemented to get significant energy consumption, the use of energy consumption is still high [19]. Studies before the moisture ethanol were carried out in distinct machines. Diesel catalyst was discovered burn ethanol with efficiency of up to 30% humidity [20, 21]. Compared to the combined gasoline engine, NOx emissions have achieved lower heat efficiency. The impact of the extra weight gain of the engine is the lower growth rate [22] and the lower emission and higher the pressure of the cylinder. The impact of water extraction decreases the maximum temperature and reduces NOx emissions, [23], although combustion efficiency is strongly influenced by high emissions of green house gases and aldehyde (THC) [24]. One of the major concerns for the operation of iron oxide in the SI engine is the construction of garbage in the injection engine or a direct injection engine. Both events will help reduce combustion efficiency and increase the increase in total hydro carbon emissions (THC) and aldehyde. Although some studies were conducted on SI wet ethanol operation [25, 26], they did not conduct an in-depth analysis of part-load operations. No wet ethanol lean operation was studied with a lean mixture. From the commercial aspect, the costly water-free ethanol production is a disadvantage. By using an aqueous alcohol with elevated water content, it can be manufactured in an area by an easy distillation method, saving energy. Therefore, the use of aqueous ethanol in the engine is an option to enhance the energy balance of ethanol production. Various researchers [27, 28] are working to reduce oil consumption, improve engine effectiveness and optimize fuel make-up in the transport sector. The development of an ethanol-hydrated engine (93% volume of ethanol) was also done [27] which showed that the maximum torque and maximum power of the engine were enhanced by 9% and 14% respectively, while the engine ran on aqueous ethanol, correlated with gasoline, in the proportion of 78% petrol mixed with 22 % volume of anhydrous ethanol. This showed an increase in specific fuel consumption by 35%. When comparing emissions carbon-monoxide shows fewer emissions than petrol by 41%, while HC, NOx, from ethanol is also lower than petrol with 14% and 56% respectively. However, level of emissions is below the permissible level. Olberding et al. [28] consider the performance of the engine and the emission of a vehicle, using a catalytic spark plug that uses less spark ignition energy by using 30% water per volume (Eh70) water-in-water ethanol. The outcome confirms that the water-ethanol fuel efficiency is significantly more than that of petrol. A running operation fuelled with ethanol increased in efficiency slightly higher than a stoichiometric fuel air blend operation under the operating conditions same over the loading and speeding range. Compared with gasoline, the use of aqueous ethanol showed a significant decrease in HC emissions. CO of hydrogen ethanol fuel is reduced due to the water displacement mechanism (A reaction where water vapour mixes with CO to form CO2 and H2). At most operating points NOx is significantly reduced.
This research compares the performance and emission characteristics of the 3-cylinder SI engine using AVL Boost software running on conventional (100% gasoline), (85% gasoline, 15% ethanol) and (90% gasoline, 8% ethanol, H2O 2%) micro-emulsion used as an alternative fuel. The engine runs at varying load and constant speed of 2500 rpm.
Simulation Model of 3-Cylinder SI Engine
Figure 1 Shows the Simulation Model of 3-Cylinder SI engine based test rig.
Figure 1. The simulation model of 3-Cylinder SI engine based test rig
The Simulations were performed on 3-cylinder SI engine. This simulation model was developed on Avl Boost software developed by Avl Austria to predict the performance and emission characteristics of 3- cylinder SI engine. In this diagram C1, C2, C3 represents the cylinder of the engine.PL1, Pl2, and Pl3 represents the plenum, Mp1 to Mp15 represents the measuring points.SB1 and SB2 represents the System Boundary of the model.CAT1 represents the catalytic convertor used for reducing the emissions from 3-cylinder SI engine.CL1 represents the cleaner which cleans the inlet air and pressure drop takes place.MNT1 represents the monitor and E1 represents the Engine. The geometrical properties of 3-cylinder SI engine were taken as shown in Table 1.
Table 1. Geometrical properties of 3-Cylinder SI engine
|
Engine |
4s 3c Water Cooled Petrol Engine |
|
Make/Model |
Maruti-Omni |
|
Bore |
68.5 mm |
|
Stroke Length |
72 mm |
|
Compression Ratio |
8.5:1 |
|
Displacement |
796 cc |
|
Starting |
Self Start |
|
Method of Ignition |
Spark Ignition |
|
Orifice dia |
20 mm |
First, the 100% Conventional gasoline fuel was used in the engine for predicting the performance and emission characteristics of engine. Gasoline 85%, Ethanol 15% was blended together on volume basis considering its liquid density. And then gasoline 90%, Ethanol 8%, and H2O was used as an additive in the fuel in order to make it as micro-emulsion fuel. All the three fuel were compared on Avl Boost Software for predicting its performance and emission characteristics. In this research, the hydrous ethanol was blended with conventional gasoline fuel. The model for performing the simulations was made in AVL Boost software, in which the vibe 2-zone model was used for combustion analysis and woshnis model was used for the heat transfer analysis of the engine. Some characteristics properties of micro-emulsion are given in Table 2.
Table 2. Characteristics of micro-emulsions
|
parameter |
Micro-emulsion |
|
Formation |
Spontaneous |
|
Stable |
Thermodynamically |
|
Droplet size(μm) |
0.01-0.10 |
|
Appearance |
Transparent |
|
Surface area |
High(200) |
|
Interfacial Tension |
Ultra low |
|
system type |
W/O,O/W,and bicontinuous |
|
Co-surfactant type |
Short Chain Alcohol |
The foundation equation used for the formulation of model is basic thermodynamic equation which is obtained from the first law of thermodynamics:
$\partial \mathrm{E}=-\partial Q-\partial W+\sum_{i} h_{i} d m_{i}$ (1)
where, E is the internal energy. W is work done, hi is the specific enthalpy, dmi is flow of mass inside or outside of the cylinder, dw is mechanical work produced by engine [29].
3.1 Mathematical model
Mathematical models for SI engines can be divided into two main groups’ dimensional and thermodynamic models. Thermodynamic models can, in turn, be classified in two sub groups single zone and multi-zone models, where as dimensional models can be divided into one and multi-dimensional model [30].
The charge of the cylinder is supposed to be consistent in temperature, composition, and pressure, for single zone models. The function of these models is used as predictive tools or diagnostic (heat release analysis). Because of the simplicity of single zone models; it is used for calculating the flows into and out of crevices. However single zone models did not consider the combustion chamber geometry and flame propagation. Single zone models can also be used as foretelling tools if the mass burning rate is specified. On combustion mass time, ignition angle, burning rate depends, residual mass, equivalence ratio, engine geometry, etc. Thus, tuning may be required for predicting the diagrams of pressure in the same engine or dissimilar engine operating under variable conditions.
2-zone models are more feasible for resolving the combustion phenomena, compared to single zone models in a more physical manner. The chamber for combustion is generally divided into burnt and unburnt regions and sometimes-thermal boundary layers in burnt and unburnt gases are considered. The cylinder charge is normally composed of ideal gases and the first law of thermodynamics, state equation, mass conservation and volume are applied to the burnt and unburnt gases
3.2 Single - Zone models
For considering the models of single-zone the pressure, temperature, and composition of the cylinder charge are assumed to be uniform.3-zone models permit a more accurate treatment of the thermodynamic properties of the cylinder mixture; the burnt and unburnt gases are considered as independent thermodynamic systems that are uniform in state and composition. However, the geometry of each zone must be tracked in order to calculate the heat transfer and composition of the burnt and unburnt gases and are considered as independent thermodynamic systems that are uniform in state and composition. In single zone models, combustion can be believed as a process of heat addition, and the chamber charge is considered as a simple fluid.
The first law of thermodynamics for open system can be written as
$\begin{aligned} \frac{d_{(m e)}}{d_{\theta}} &=-p \frac{d V}{d \theta}-\frac{d Q}{d \theta}+\sum \dot{m} i h i \\ e &=e^{0}+\int_{T_{0}}^{T} C_{v} d T \end{aligned}$ (2)
where, m, T, and p are the mass, temperature, and pressure, of the cylinder charge, respectively, e is the mixture specific internal energy, Cv is considered as specific heat at volume constant, V is the combustion chamber volume; dQ/dθ represents the heat losses; specific enthalpy of gases is hi, flowing into the cylinder with a mass flow rate equal to ṁi,T0 is a reference temperature, e0 is the internal energy of formation at the reference temperature T0, and θ is the crank shaft angle. In the absence of injection and flows into crevices.
dm/dθ = 0. In premixed charge engines, there are flows into and out of crevices (i.e. volumes between the piston, cylinder wall, and piston rings and the spark plug threads).The crevices can be modelled as a single volume at the cylinder pressure or as a series of volumes, connected by restrictions to simulate the piston ring- cylinder wall region and blow by.
Eq. (1) can be written as
$\frac{d Q_{C H}}{d \theta}=m C_{v} \frac{d T}{d \theta}+p \frac{d V}{d \theta}+\frac{d Q}{d \theta}+(h-e) \frac{d m_{C R}}{d \theta}$ (3)
where, dQCH /dθ represent the heat released by combustion, dmCR/dθ represents the mass flow rate into crevices, and h is the specific enthalpy.
The equation for mass conservation applied to combustion chamber yields
$\frac{d m}{d \theta}=-\frac{d m_{C R}}{d \theta}$ (4)
When the cylinder pressure is high $\frac{d m_{C R}}{d \theta}>0$ and the value of h corresponds to that in the combustion chamber:
h = e + PV/m (5)
However, during the expansion stroke, dmCR/dθ< 0 and the value of h is that of the gases contained in the crevices.
If the volume of crevice and temperature are assumed constant and the crevice pressure is equal to that of the cylinder charge, the mass flow rate into the crevices can be written as
$\frac{d m_{C R}}{d \theta}=V_{C R} \frac{d p / d \theta}{R T w}$ (6)
where, the crevice temperature was set equal to the temperature of the cylinder wall Tw and volume of the crevice is VCR. Eq. (5) can be substituted into Eqns. (2) and (3) to obtain an equation for the combustion heat release once the losses from heat transfer dQ/dθ are specified [31].
3.3 Multi-Zone models
Multi- zone models consider the geometry of combustion chamber and pressure of both burnt and unburnt gases. In these models the mixture of cylinder is divided into burnt & unburnt zones, which are separated from each other by a surface of discontinuity (the flame). Both burnt and unburnt gases have different temperature and composition and in combustion chamber pressure is uniform throughout. Although the uniform temperature assumption in the unburnt gases is logical, significant gradient temperatures may exist in the burnt gases because of the dissimilarity involving in first burning and then the burnt gas, compressing as compared to compressing first and then fire the fresh mixture.
The flame structure is not considered by 2-zone models but it can account for quenching of flame.
The equations governing the burnt and unburnt-gas zones can be written as
m = mu + mb
dm ∕ dθ = dmu ∕dθ + dmb∕dθ = - dmu,CR ∕ dθ - dmb,CR ∕dθ (7)
V = Vu + Vb (8)
p Vu = mu Ru Tu (9)
p Vb = mb RbTb (10)
d∕dθ (mu eu) = -p dVu∕dθ - dQu∕dθ + hu dmu, R∕dθ - hu dmu,CR∕dθ (11)
d∕dθ (mb eb) = -p dVb∕dθ - dQb ∕dθ +hu dmb, R ∕dθ - hb dmb, CR ∕dθ (12)
eu = eu˚ + $\int\limits_{To}^{Tu}{Cvu}dT$ eb = ebo + $\int\limits_{To}^{Tb}{CvbdT}$ (13)
where, the subscripts u and b denote the unburnt and burnt gases respectively; and third terms on the right hand sides of Eqns. (11) and (12) denote the enthalpy fluxes associated with the chemical reaction R; and the fourth terms on the right- hand sides of Eqns. (11) and (12) denote the enthalpy fluxes associated with flows into crevices CR.
Woschni Model
For high pressure cycle the woschni model is outlined below [32].
$\propto=130 . D^{-0.2} \cdot p_{c}^{0.8} \cdot T_{c}^{-0.53} \cdot\left[C_{1} \cdot c_{m}+\right.\left.C_{2 \cdot} \frac{V_{D . T_{c .1}}}{P_{c, 1 . V_{c .1}}} \cdot\left(p_{c-p_{c,0}}\right)\right] 0.8$ (14)
C1 = 2.28+ 0.308. Cu/Cm
C2 = 0.00324 Direct Injection
D Bore of cylinder
cm piston mean speed
Cu velocity circumferential
VD cylinder displacement
Pc, o engine cylinder pressure [bar]
Tc, 1 cylinder temperature at intake valve closing (IVC)
Pc, 1 cylinder pressure IVC [bar]
This heat transfer model which is modified form of woschni model has been published in 1990 (C6) for the purpose to give prediction of heat transfer more accurate at part load operation [33].
$\propto_{w}=130 . D^{-0.2} \cdot . p_{c}^{0.8} \cdot T_{c}^{-0.53}. \left\{c_{1} \cdot c_{m} \cdot\left[1+2\left(\frac{V_{T D C}}{V}\right)^{2} \cdot \operatorname{Imep}^{-0.2}\right]\right\}^{0.8}$ (15)
VTDC cylinder TDC volume
V cylinder volume actual
IMEP is indicated mean effective pressure
In the case that
$\mathrm{C}_{2} \frac{V_{D}, T_{c, 1}}{p_{c, 1}\cdot V} \cdot\left(p_{c}-p_{c, 0}\right) \geq 2 \cdot C_{1} \cdot c_{m} \cdot\left(V_{T D C / V}\right)^{2} \cdot \operatorname{Imep}^{-0.2}$
In this equation the calculation of coefficient of heat transfer published in 1978 for the process of exchanging gas, woschni use the above equation for the coefficient of heat transfer [34].
$\propto=130 . D^{-0.2} \cdot p_{c}^{0.8} \cdot T_{c}^{-0.53} \cdot\left(C_{3} \cdot c_{m}\right)^{0.8}$ (16)
C3 = 6.18+0.417.cu/cm
αw is heat transfer coefficient
D Bore of cylinder
Cm piston mean speed
Cu circumferential velocity.
5.1 Vibe 2 zone
The heat released by the burning of the mass fraction is described by a vibe function. However, assuming burned charge has equal temperature is discarded. Alternately for both burned and unburned charge the first law of thermodynamics is applied respectively [35].
$d m_{b} u_{b} / d_{\infty}=-p_{c} \frac{d v_{b}}{d_{\infty}}+\frac{d Q_{F}}{d_{\infty}}-\sum \frac{d Q_{w b}}{d_{\infty}}+h_{u} \frac{d_{m b}}{d_{\infty}}-h_{B B, b} \frac{d m_{B B, b}}{d_{\infty}}$ (17)
$d m_{u} u_{u} / d_{\infty}=-p_{c} \frac{d_{V u}}{d_{\infty}}-\sum \frac{d Q_{w u}}{d_{\infty}}-\sum \frac{d Q_{w u}}{d_{\infty}}-h_{u} \frac{d_{m b}}{d_{\infty}}-h_{B B, u} \frac{d m_{B B, b}}{d_{\infty}}$ (18)
Index b indicates burned zone and index u indicates unburned zone.
The term $h_{u} \frac{d m_{B}}{d_{\infty}}$ defines the flow of enthalpy from unburned to the burned zone converting the fresh charge to products of combustion. And heat flux is neglected between the two zones.
All volume change must result in the change of cylinder volume and the sum of the volume of the zone must be equal to the volume of the cylinder.
$\frac{d V_{b}}{d_{\infty}}+\frac{d V_{u}}{d_{\infty}}=\frac{d V}{d_{\infty}}$ (19)
$V_{b}+V_{u}=V$ (20)
The mixture burnt is obtained from the vibe function at each time step that is mentioned by the user. For other terms like heat losses of wall etc. models which are similar to the models that are single zone with approximate distribution on models that are two zones are used
6.1 Power V/s load
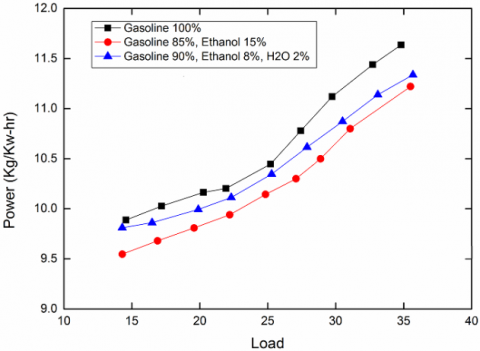
Figure 2 shows the plot between Power and Load using Gasoline, blended ethanol and micro emulsion compositions.
Figure 2. The plot between power and load using gasoline, blended ethanol and micro emulsion compositions
In the plot 2 there is the variation of power of Conventional fuel gasoline100%, gasoline 85%, Ethanol 15%, and micro emulsion composition with varying loads. The power obtained is more for micro emulsion fuel which shows that the fuel is more efficient, and then power shows increase for blending 15% ethanol with 85% gasoline at higher loads. The power shows again the variation for conventional gasoline engine. At the start of the combustion when the fuel supply is more the corresponding power also shows some increase. At increasing loads the power increases for gasoline because of higher heating value of the fuel. The most efficient fuel found was micro emulsion fuel tested in 3-cylinder SI engine. Although the power shows more increase for 100% conventional gasoline fuel due to its more calorific value. But other alternative fuels were also efficient in terms of power production. As there is slight variation for other fuels as compared to conventional gasoline fuel. Since micro-emulsion fuel contains 90% gasoline as compared to gasoline 85% and ethanol 15%, this is slightly more and it shows more power.
6.2 Torque V/s load
Figure 3 shows the plot between torque and load using gasoline, blended ethanol and micro emulsion compositions.
Figure 3. The plot between torque and load using gasoline, blended ethanol and micro emulsion compositions
In the plot 3 there is the relation between Torque and load. All the fuels show continuous increase in torque. With increase in load torque on the engine increases more for micro emulsion fuel. This rise in torque shows that the fuel is efficient. As increases load also increases the power. Since torque is directly related with power. This increasing trend of curves shows that all the compositions of fuel are efficient in terms of performance. Torque is the measure of engines ability to do work. With the increase in load torque also increases, and correspondingly it reduces the engine speed of the engine. Almost all the compositions of the fuel show similar kind of trend for varying Loads. This shows that apart from conventional gasoline as the fuel, ethanol blended fuel and micro-emulsion is also very efficient fuel.
6.3 Bsfc V/s load
Figure 4 Shows the plot between Bsfc and load using Gasoline, blended ethanol, and micro emulsion compositions.
Figure 4. The plot between Bsfc and load using gasoline, blended ethanol, and micro emulsion compositions
As shown in the plot 4 Bsfc increases for all the composition of micro emulsion, blended ethanol and conventional gasoline fuel. The Bsfc increases with increase in load mostly for micro emulsion fuel. The Bsfc shows less consumption of fuel for the conventional gasoline engine at lower loads. And then it increases continuously with increase in load when the mixture becomes rich, and the fuel supply increases. This decrease of fuel consumption at lower loads for the conventional gasoline is due to the reason that gasoline has higher heating value as compared to other compositions. So the net heat released is more for less consumption of fuel. In the same way since ethanol have lower heating value so the net output of the heat obtained is less and the consumption of fuel supply increase for the blended and for micro emulsion fuel.
6.4 Bmep V/s load
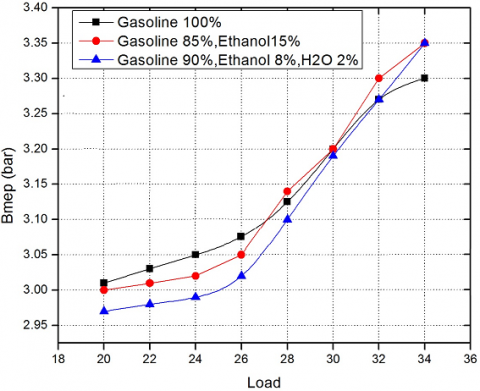
Figure 5 shows the plot between Bmep and load using Gasoline, blended ethanol, and micro-emulsion compositions.
Figure 5. The plot between Bmep and load using gasoline, blended ethanol, and micro-emulsion compositions
In the plot 5 there is the relation between Bmep and load for 3-cylinder spark ignition engine. The pressure shows continuous increase for all the fuels used including gasoline, blended ethanol, and micro-emulsion fuel used as an alternative fuel. This increase in Bmep with increase in load defines that there is more number of cycles getting completed in two revolutions of crankshaft which increases the Bmep inside the engine which completes the cycle for 3 cylinder 4-stroke SI engine. Bmep is the actual output of the internal combustion engine at the crankshaft. This is the average pressure in the cylinder for a complete engine cycle. From the plot it can be easily seen that the highest average pressure is produced by conventional 100% gasoline fuel, and then correspondingly by other alternative fuels. The reason behind this increase in average pressure is that conventional gasoline fuel has more heating value which is responsible to increase in Bmep of engine.
6.5 IMEP V/s Load
Figure 6 shows the plot between IMEP and load using Gasoline, blended ethanol, and micro emulsion compositions.
In Figure 6 the plot shows the variation for different fuels under investigation. The plot gives the idea how Imep varies at variable loads. Imep is the uniform pressure that would be required throughout the power stroke of an engine to do the same amount of work as is done by the varying pressures that are in fact obtained during the stroke. Brake mean effective pressure is the proportion of the indicated mean effective pressure that is available to perform external work at the flywheel. The difference between Imep and Bmep is equal to the mean pressure required to overcome engine friction and to perform the functions of filling and emptying the cylinder and of driving the auxiliaries such as the oil and water pumps, generator and so on. These are generally known as friction and pumping losses.
Figure 6. The plot between IMEP and load using gasoline, blended ethanol, and micro emulsion compositions
6.6 Pressure V/s Crank angle
Figure 7 shows the plot between pressure and crank angle using Gasoline, blended ethanol, and micro emulsion compositions.
Figure 7. The plot between pressure and crank angle using Gasoline, blended ethanol, and micro emulsion compositions
In the plot 7 the peak pressure is obtained at 24bar at 2500rpm.The pressure obtained in 3 cylinders SI engine by using conventional 100% gasoline shows slight decrease in peak pressure as compared to blended ethanol and micro-emulsion fuel. The possible reason can be that by adding H2O molecule in micro-emulsions it results in increase of peak pressure as combustion is heterogeneous inside the combustion chamber which increases the temperature of SI engine, and pressure also increases slightly more for micro-emulsion as an alternative fuels.
7.1 CO emissions
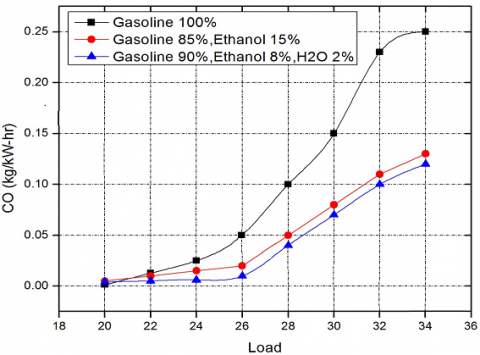
Figure 8 shows the plot between CO and load using Gasoline, blended ethanol, and micro emulsion compositions.
Figure 8. The plot between CO and load using gasoline, blended ethanol, and micro emulsion compositions
In plot 8 there is comparison between various types of alternative fuels including conventional gasoline fuel for checking the CO emissions with varying load conditions. The plot clearly defines the CO emissions for all the three fuels. With increase in load the CO emissions increase for Conventional gasoline more as compared to Ethanol 15% blended with 85% gasoline, and is lowest for micro emulsion fuel which contains 2% H2O as an additive in fuel. So, in terms of emissions micro emulsion fuel again proves to be efficient as CO emissions are lowest for this fuel. The reason behind this increase in CO emissions at higher loads is that the fuel is not getting sufficient time for oxidation to completely burn the fuel in to CO2 formation.
7.2 HC emissions
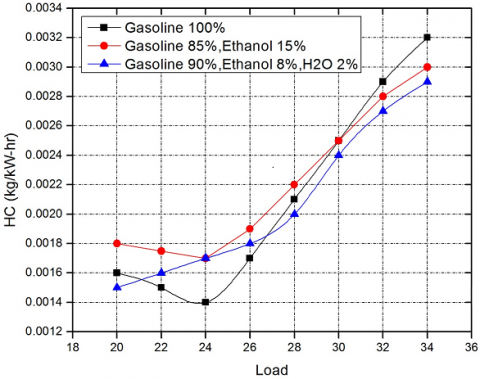
Figure 9 shows the plot between HC and load using Gasoline, blended ethanol, and micro emulsion compositions.
In Figure 9 there is Comparison of various fuels for checking the HC emissions with varying load conditions. As HC emissions is slightly showing decrease at lower loads but increases continuously with increase in load for all the fuels. The reason behind this increase is combustion chamber wall. A quench layer containing unburned and partially burned fuel-air mixture is left at the wall when the flame is extinguished as it approaches the wall. Another source of HC in engines is incomplete combustion due to bulk quenching of the flame in that fraction of the engine cycles where combustion is especially slow. Such conditions are most likely to occur during transient engine operation when the air-fuel ratio, Spark timing, and the fraction of the exhaust recycled for emission control may not be properly matched.
Figure 9. The plot between HC and load using gasoline, blended ethanol, and micro emulsion compositions
7.3 Nox emissions
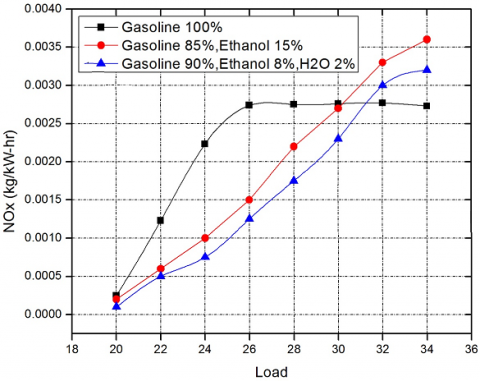
Figure 10 shows the plot between NOx and load using Gasoline, blended ethanol, and micro emulsion compositions.
Figure 10. The plot between NOx and load using gasoline, blended ethanol, and micro emulsion compositions
In Figure 10 there is NOx formation for various alternative fuels and 100% gasoline. The plot shows that with increase in load NOx emissions also increase for all the fuels. The gasoline fuel shows the highest NOx emissions as compared to ethanol as 15% in 85% gasoline and is lowest for micro emulsion fuel. The reason for this increase in NOx emissions is the high temperature burned gases behind the flame through chemical reaction involving Nitrogen and Oxygen atoms and molecules. The higher is the burned gas temperature the higher the rate of formation of NOx emissions.
Based on above investigation the following conclusion can be drawn
This work was stimulated in part by interactions with researchers and professors at National Institute of Technology Hazratbal Srinagar Kashmir India. The contents of this paper, however, do not necessarily reflect the opinions or views of any of these individuals.
[1] Prashant, G.K., Lata, D.B., Joshi, P.C. (2016). Investigation on the effect of ethanol blend on the combustion parameters of dual diesel engine. Appl. Therm. Eng., 96: 623-631. https://doi.org/10.1016/j.applthermaleng.2015.11.051
[2] Khoobbakht, G., Najafi, G., Karimi, M., Akram, A. (2016). Optimization of operating factors and blended levels of diesel, biodiesel and ethanol fuels to minimize exhaust emissions of diesel engine using response surface methodology. Appl. Therm. Eng., 99: 1006-1017. https://doi.org/10.1016/j.applthermaleng.2015.12.143
[3] Boretti, A. (2012). Advantages of converting diesel engines to run as dual fuel ethanol diesel. Appl. Therm. Eng. 47: 1-9. https://doi.org/10.1016/j.applthermaleng.2012.04.037
[4] Padala, S., Woo, C., Kook, S., Hawkes, E.R. (2013). Ethanol utilization in a diesel engine using dual-fuelling technology, Fuel, 109: 597-607. https://doi.org/10.1016/j.fuel.2013.03.049
[5] Marques, D.O., Trevizan, L.S.F., Oliveira, I.M.F., Seye, O., Silva, R.E.P. (2017). Combustion assessment of an ethanol/gasoline flex-fuel engine. J Braz. Soc. Mech. Sci. Eng., 39: 1079-1086. https://doi.org/10.1007/s40430-016-0609-4
[6] Catagliola, M.A., Prati, M.V., Florio, S., Scorletti, P., Terna, D., Iodice, P., Buono, D., Senatore, A. (2016). Performances and emissions of a 4-stroke motorcycle fuelled with Ethanol/gasoline blends. Fuel, 183: 470-477. https://doi.org/10.1016/j.fuel.2016.06.105
[7] Najafi, G., Ghobadian, B., Moosavian, A., Yusaf, T., Mamat, R., Kettner, M., Azmif, W.H. (2016). SVM and ANFIS for prediction of performance and exhaust emissions of a SI engine with gasoline-ethanol blended fuels. Appl. Therm. Eng., 95: 186-203. https://doi.org/10.1016/j.applthermaleng.2015.11.009
[8] Schifter, I., Diaz, R., Rodriguez, R., Gómez, J.P., Gonzalez, U. (2011). Combustion and emissions behaviour for ethanol-gasoline blends in a single cylinder engine. Fuel, 90(12): 3586-3592. https://doi.org/10.1016/j.fuel.2011.01.034
[9] Wang, X., Chen, Z., Ni, J., Liu, S., Zhou, H. (2015). The effects of hydrous ethanol gasoline on combustion and emission characteristics of a port injection gasoline engine. Case Stud. in Therm. Eng., 6: 147-154. https://doi.org/10.1016/j.csite.2015.09.007
[10] Costa, R.C., Sodre, J.R. (2010). Hydrous ethanol vs. Gasoline ethanol blend: Engine performance and emissions. Fuel, 89(2): 559-570. https://doi.org/10.1016/j.fuel.2009.06.017
[11] Jeuland, N., Montagne, X., Gautrot, X. (2004). Potentiality of ethanol as a fuel for dedicated engine performance and emissions. Oil Gas Sci. Technol., 59(6): 559-570. https://doi.org/10.2516/ogst:2004040
[12] Basso, L.C., Basso, T.O., Rocha, S.N. (2011). Ethanol Production in Brazil: The industrial process and its impact on yeast fermentation. Bio Fuel Production - Recent Developments and Prospects, Chapter 5, 85-100. https://doi.org/10.5772/17047
[13] Jeuland, N., Montagne, X., Gautrot, X. (2004). Potentiality of ethanol as a fuel for dedicated engine. Oil Gas Sci Technol., 59(6): 559-70. http://dx.doi.org/10.2516/ogst:2004040
[14] Shapouri, H., Duffield, J., Wang, M. (2003). The energy balance of corn ethanol revisited. Trans Soc Agric Eng., 46: 959-68. https://doi.org/10.13031/2013.13951
[15] Dai, D., Hu, Z., Pu, G., Li, H., Wang, C. (2006). Energy efficiency and potentials of cassava fuel ethanol in Guangxi region of China. Energy Convers Manage, 47(13-14): 1686-99. http://dx.doi.org/10.1016/j.enconman.2005.10.019
[16] Ladisch, M.R., Dyck, K. (1979). Dehydration of ethanol: new approach gives positive energy balance. Science, 205(4409): 898-900. http://dx.doi.org/10.1126/science.205.4409.898
[17] Flowers, D.L., Aceves, S.M., Frias, J.M. (2007). Improving ethanol life cycle energy efficiency by direct utilization of wet ethanol in HCCI engines. SAE Tech Pap., 1070-8. http://dx.doi.org/10.4271/2007-01-1867
[18] López-Plaza, E.L., Hernández, S., Barroso-Muñoz, F.O., Segovia-Hernández, J.G., Aceves, S.M., Martínez-Frías, J., Saxena, S., Dibble, R. (2014). Experimental and theoretical study of the energy savings from wet ethanol production and utilization. Energy Technol., 2(5): 440-445. http://dx.doi.org/10.1002/ente.201300180
[19] Chen, W.C., Sheng, C.T., Liu, Y.C., Chen, W.J., Huang, W.L., Chang, S.H., Huang, W.L., Chang, S.H., Chang, W.C. (2014). Optimizing the efficiency of anhydrous ethanol purification via regenerable molecular sieve. Appl Energy, 135: 483-9. http://dx.doi.org/10.1016/j.apenergy.2014.08.112
[20] Cordon, D., Clarke, E., Beyerlein, S., Steciak, J., Cherry, M. (2002). Catalytic igniter to support combustion of ethanol-water/air mixtures in internal combustion engines. SAE Powertrain & Fluid Systems Conference & Exhibition. http://dx.doi.org/10.4271/2002-01-2863
[21] Olberding, J., Beyerlein, D.C.S., Steciak, J., Cherry, M. (2005). Dynamometer testing of an ethanol-water fueled transit van. SAE Tech Pap. http://dx.doi.org/10.4271/2005-01-3706
[22] Augoye, A., Aleiferis, P. (2014). Characterization of flame development with hydrous and anhydrous ethanol fuels in a spark-ignition engine with direct injection and port injection systems. SAE Tech Pap. http://dx.doi.org/10.4271/2014- 01-2623
[23] Brewster, S., Railton, D., Maisey, M., Frew, R. (2007). The effect of E100 water content on high load performance of a spray guide direct injection boosted engine. SAE Tech Pap. http://dx.doi.org/10.4271/2007-01-2648
[24] Munsin, R., Laoonual, Y., Jugjai, S., Imai, Y. (2013). An experimental study on performance and emissions of a small SI engine generator set fuelled by hydrous ethanol with high water contents up to 40%. Fuel, 106: 586-92. http://dx.doi.org/10.1016/j.fuel.2012.12.079
[25] Lanzanova, T.D.M., Vielmo, H.A., Sari, R.L., Dornelles, H.M., Tatsch, G.A., Martins, M.E.S., et al. Performance analysis of a spark ignited engine running on different water-in-ethanol mixtures. SAE Tech Pap. http://dx.doi.org/10.4271/2013-36-0202
[26] Martins, M., Lanzanova, T., Sari, R. (2015). Low cost wet ethanol for spark-ignited engines: Further investigations. SAE Int J Fuels Lubr, 8(2): 367-373. https://doi.org/10.4271/2015-01-0954
[27] Clemente, R.C., Werninghaus, E., Coelho, E.P.D., Ferraz, L.A.S. (2001). Development of an internal combustion alcohol fueled engine. SAE Technical Paper. http://doi.org/10.4271/2001-01-3917
[28] Olberding, J., Beyerlein, D.C.S., Steciak, J., Cherry, M. (2005). Dynamometer testing of an ethanol-water fueled transit van. SAE Technical Paper 2005-01-3706. https://doi.org/10.4271/2005-01-3706
[29] Pourkhesalian, A.M., Shamekhi, A.H., Salimi, F. (2010). Alternative fuel and gasoline in an SI engine: A comparative study of performance and emissions characteristics. Fuel, 89(5): 1056-1063. https://doi.org/10.1016/j.fuel.2009.11.025
[30] Ramos, J.I. (2017). Internal Combustion Engine Modelling. CRC Press.
[31] Verhelst, S., Sheppard, C.G.W. (2009). 3-zone thermodynamic modelling of spark-ignition engine combustion - An overview. Energy Convers. Manag., 50(5): 1326-1335. https://doi.org/10.1016/j.enconman.2009.01.002
[32] A. theory manual Boost, No Title Avl Boost, 2009.
[33] A. Hans-List-Platz 1, A-8020Graz, AVL LIST GmbH, in: AVL Boost, 07/2009, 2009: p. 87. doi:07/2009.
[34] A.V.L.L. Gmbh, Users Guide AVL-AST LICENSING. (2009).
[35] Avl-Boost Combustion Models, (n.d.).