Novreza Pratama![]() | Zainal Arifin*
| Zainal Arifin*![]() | Rendy Adhi Rachmanto
| Rendy Adhi Rachmanto![]() | Singgih Dwi Prasetyo
| Singgih Dwi Prasetyo![]()
© 2025 The authors. This article is published by IIETA and is licensed under the CC BY 4.0 license (http://creativecommons.org/licenses/by/4.0/).
OPEN ACCESS
The rising operating temperature of photovoltaic (PV) panels, particularly in floating solar systems, reduces electrical efficiency and long-term reliability. Passive cooling using thermosyphon technology offers a promising solution without additional energy consumption. This study experimentally investigates a hybrid floating photovoltaic–thermosyphon (FPV–TS) system to enhance thermal regulation and power generation. Nine collector configurations combining three width-to-distance (W/D) ratios (0.5:1, 0.75:1, 1:1) and three depth dimensions (20, 30, 40 mm), under real outdoor conditions. Measured temperature, power, and efficiency to evaluate the best configuration performance. Results show that thermosyphon integration reduced PV temperature by up to 6.8℃ and increased electrical efficiency by 9.3%. Defining optimality by daily-average performance (total efficiency and electrical output), W/D = 0.75:1 at depth 30 achieved the highest day-average efficiency, narrowly surpassing the depth 40 variant. The collector 40 exhibited slightly higher instantaneous thermal efficiency near noon but yielded no meaningful daily gain, indicating diminishing returns beyond 30 alongside greater fluid inventory and fabrication complexity. Deeper collectors enhanced heat dissipation through improved convective transfer, while moderate spacing minimized lateral heat loss. This research provides empirical insights into geometric optimization of thermosyphon collectors for passive PV cooling and offers design guidance for improving floating solar system performance.
collector geometry, floating photovoltaic, passive cooling, PV efficiency, thermosyphon
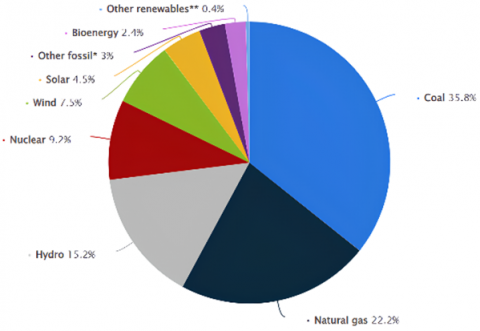
The increasing global population and industrial growth have led to a significant surge in energy consumption [1]. In Indonesia, although the government has set a target to reduce energy intensity by 1% annually, actual energy consumption continues to exhibit an upward trend [2]. This situation is further exacerbated by the fact that approximately 35.8% of the national energy mix still relies on coal, as illustrated in Figure 1, which is recognized as a major contributor to carbon emissions, ozone depletion, and global warming [3, 4]. Amidst global pressure to transition towards clean energy, renewable energy sources have proliferated and are projected to surpass fossil fuels as the world’s primary energy source by 2035. Among various renewable energy options, solar energy stands out as one of the most promising alternatives due to its abundant availability, zero emissions, and flexibility in both direct and indirect applications [5].
With the growing attention toward the utilization of solar energy, photovoltaic (PV) technology has emerged as one of the primary methods for converting solar radiation into electricity [6]. However, as PV panel applications expand, significant technical challenges have arisen, particularly related to efficiency degradation due to increased operating temperatures. A substantial portion of the solar radiation absorbed by PV panels is not fully converted into electricity but transforms into heat that accumulates on the module surface. This heat buildup elevates the panel’s operating temperature, which directly reduces electrical conversion efficiency and, over time, may accelerate material degradation and shorten the service life of PV panels [7]. Therefore, temperature control efforts through effective cooling systems are essential for maintaining the performance and reliability of PV technology under various environmental conditions [8].
Figure 1. Worldwide power generation distribution in 2022
To address the issue of temperature, rise in PV panels, various cooling methods have been developed, both active and passive [9]. Active cooling systems typically employ pumps or fans to induce forced convection using either liquid or air as the working medium, thereby significantly enhancing the heat transfer rate [10]. However, such systems require additional energy consumption, higher installation costs, and more complex maintenance. In contrast, passive cooling systems are simpler, require no external energy input, and are generally more environmentally friendly [11]. One increasingly studied passive cooling approach is the use of thermosyphon systems, which operate based on the principle of natural convection driven by fluid density differences caused by temperature variations [12]. Yoon et al. [13] reported that the integration of radiative cooling and a closed-loop thermosyphon increased net power output by 6.4% without the need for auxiliary pumps. A study by Fu et al. [14] demonstrated that a PV/T system utilizing natural circulation achieved an energy efficiency of 69.63% and an exergy efficiency of 12.84%, surpassing the performance of forced convection systems under certain conditions. These findings suggest that passive cooling is more efficient in terms of auxiliary energy consumption and can also be competitive in performance when appropriately configured. Such results provide a compelling foundation for the further development of thermosyphon-based passive cooling systems for PV panels, particularly in the context of efficient and sustainable hybrid applications [15].
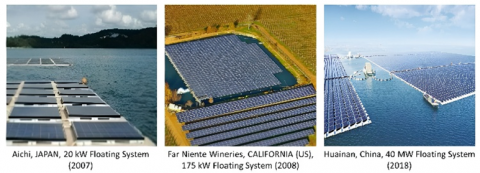
On the other hand, as the demand for PV system installations increases, land availability has become a critical issue, particularly in densely populated areas with limited rooftop or open land space [16]. Conventional PV systems typically require large installation areas (approximately 10 m² for every kilowatt of generated power), making space constraints a tangible barrier to large-scale expansion. To address this challenge, the concept of floating photovoltaic (FPV) systems has emerged as an innovative solution by utilizing water surfaces such as lakes, reservoirs, or irrigation ponds as platforms for solar panel installations [17]. Indonesia has set a target of achieving 26% renewable energy by 2026, with innovative solutions such as floating PV playing a key role in overcoming land limitations [18]. In addition to conserving land use, FPV systems offer additional benefits, including natural cooling from the underlying water, which can enhance electrical conversion efficiency [19]. Furthermore, FPV has been shown to significantly reduce water evaporation rates, thereby supporting water resource conservation in specific regions [20]. Given these technical and ecological advantages, FPV represents a strategic approach to advancing renewable energy transitions in tropical countries like Indonesia, as illustrated in Figure 2 [17]. However, integrating this system with passive cooling technologies such as thermosyphons still requires thorough investigation, particularly regarding configuration design and system response to real-world environmental variability.
Although the integration of thermosyphon systems for PV panel cooling has been extensively discussed in the literature, most studies remain focused on land-based systems and rely primarily on simulation approaches [21] or theoretical analyses [22]. The development of hybrid floating photovoltaic–thermosyphon (FPV–TS) systems that take into account the environmental characteristics of water bodies and the actual dynamics of heat transfer is still minimal [23, 24].
Furthermore, geometric configurations of the thermosyphon collector (such as shape, depth, and placement behind the panel) have not been comprehensively investigated as influential factors in cooling effectiveness and energy conversion efficiency. Some studies even continue to rely on forced circulation using pumps to improve system performance, which paradoxically undermines the energy efficiency advantages of the passive cooling concept itself [10]. Therefore, there is an urgent need for experimental studies that directly evaluate the influence of thermosyphon collector configurations on the performance of FPV systems under real-world conditions. This innovation space is critical for improving the overall system efficiency and formulating optimal and practical passive designs for field implementation, particularly in tropical regions with high solar radiation potential and dynamic environmental challenges.
Figure 2. The first FPVS (Aichi, Japan), the first commercial FPVS (California, USA), and the world's largest FPVS (Huainan, China)
Based on the discussion above, this study aims to experimentally evaluate the influence of thermosyphon collector configurations on the cooling performance of photovoltaic panels in a hybrid floating photovoltaic–thermosyphon (FPV–TS) system. The configuration variables examined include the dimensions and placement of the collectors as passive heat transfer media located at the rear side of the panel. This research is designed to identify optimal configurations that can effectively reduce the panel’s operating temperature while simultaneously enhancing electrical conversion efficiency under actual environmental conditions. The primary contribution of this study lies in providing new experimental data to support the development of efficient and energy-saving FPV–TS system designs without the need for additional power consumption. Furthermore, the findings are expected to serve as a technical reference for designing thermosyphon-based passive cooling systems for solar energy applications ranging from residential to commercial scales in tropical regions.
2.1 System and material design
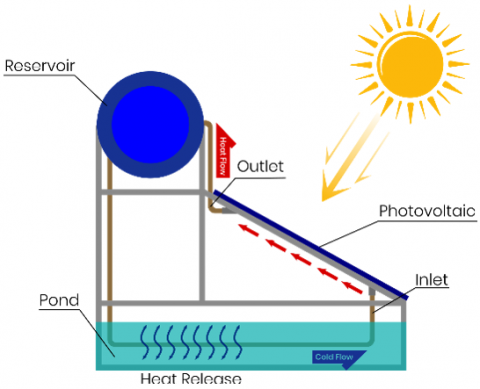
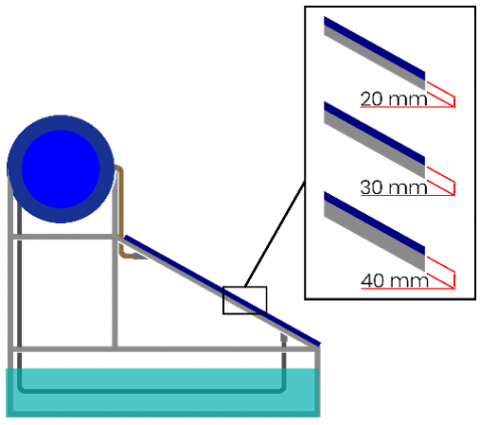
This study utilizes a hybrid floating photovoltaic–thermosyphon (FPV–TS) system developed to enhance solar panels' electrical efficiency and passive cooling through natural fluid circulation within the collector. The system comprises a polycrystalline photovoltaic (PV) panel with a nominal power of 50 Wp (Sunwatt SM-50WP), 17.6% efficiency, and dimensions of 670 × 530 × 30 mm, installed at a tilt angle of 12.5° facing north on an iron frame. The panel is directly coupled with a thermosyphon collector using a thermal paste layer, which facilitates heat absorption from the panel through evaporation and condensation mechanisms without the assistance of a pump. The schematic of the hybrid FPV-thermosyphon system is illustrated in Figure 3.
The thermosyphon collector consists of 10 flat aluminum channels with varying depths, arranged in parallel. Each channel end is connected to a transparent flexible HDPE hose with a diameter of ¾ inch, which transports the working fluid to the reservoir (condenser) and back to the collector. At the lower section, these hoses are connected to ½ inch copper pipes submerged in water, serving as the heat sink to maximize condensation. This assembly forms a closed-loop circulation system, where fluid circulates naturally due to density differences induced by heating and cooling processes.
Figure 3. FPV-Thermosyphon hybrid system scheme
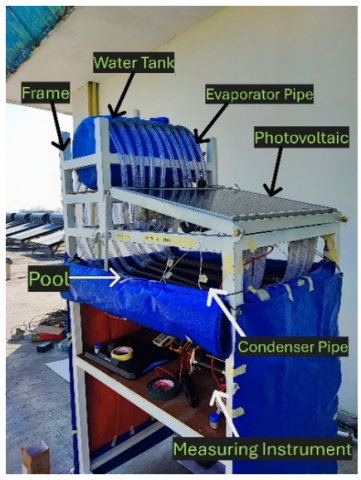
Figure 4. Field documentation of experimental equipment setup
The system was equipped with a series of instruments for measuring temperature, solar irradiance, and electrical parameters to obtain accurate experimental data. Temperature was measured using type-K thermocouples, manually calibrated using an ice–water mixture as a zero-point reference (0℃) to ensure accuracy via cold junction calibration. These thermocouples have a measurement range of – 270℃ to 1260°C, with an accuracy of ± 2.2℃ (standard) and ± 1.1℃ (special limits of error). Temperature sensors were placed at several critical points: the underside surface of the PV panel (back plate absorber), the inlet and outlet of the thermosyphon collector, and the ambient air. Solar irradiance was measured using a Lutron SPM-1116SD solar power meter. Temperature data from the thermocouples were continuously recorded using a LabJack U6-Pro multichannel data logger, featuring up to 24-bit resolution and 14 analog input channels. All instruments and test components were mounted on a fixed metal frame, as shown in the field documentation in Figure 4, to ensure mechanical stability and safety throughout the experiment.
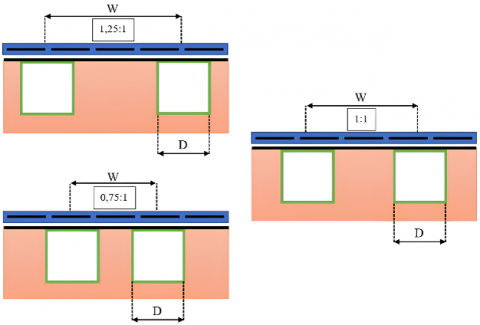
The collector depth was varied at 20 mm, 30 mm, and 40 mm to evaluate the effect of fluid volume and cross-sectional area on fluid residence time and heat absorption capacity. Meanwhile, the W/D ratio was adjusted in three configurations, 0.75:1 (pipe spacing of 35 mm), 1:1 (40 mm), and 1.25:1 (45 mm), to observe heat distribution and the interaction of natural convection between collector channels. These variations form a full factorial 3 × 3 experimental designs, resulting in nine main configurations. The depth variation is illustrated in Figure 5.
Figure 5. Illustration of depth variation
Experimental parameters were maintained consistently to minimize error. These include: a constant PV panel type (50 Wp polycrystalline), with only a single panel used to avoid variability in panel performance; aluminum collector material with a thickness of 1 mm; a fixed evaporator length of 750 mm and condenser length of 1600 mm; measurement times between 07:00 and 16:00 WIB on clear days with a minimum ambient temperature of 27℃; and a fixed tilt angle of 12.5° facing north. The variations in W/D ratio are illustrated in Figure 6.
Figure 6. W/D ratio variation scheme
The dependent variables in this study include panel temperature, PV output power, and system efficiency (both thermal and electrical). Controlled variables such as sensor type, PV panel specification, collector length, and working fluid were kept constant to ensure that the influence of the main parameters could be observed in isolation. For data acquisition, experiments were conducted over three separate days to avoid thermal accumulation effects on the structure and to ensure that each configuration was tested under comparable solar irradiance conditions. Each variation was tested at one-hour intervals and repeated three times. The complete factorial design enabled evaluation of both main effects and interaction effects between factors using statistical analysis via ANOVA.
2.2 System governing equations and physical parameters
The thermosyphon system is a passive heat transfer technology that operates based on the natural circulation of fluid driven by density differences induced by temperature gradients [25]. In the context of floating photovoltaic (FPV) systems, the integration of thermosyphons not only enhances thermal efficiency but also leverages the relatively stable and cooler aquatic environment [20]. When the working fluid in the collector absorbs heat from the PV panel, it undergoes evaporation at the lower section of the collector (evaporator) and rises to the upper section (condenser) to release heat, before returning downward due to gravity This cycle occurs continuously without requiring additional energy input, making it an efficient cooling solution for PV systems deployed on floating platforms [12].
Natural circulation in the thermosyphon system is driven by fluid density differences resulting from temperature changes. The Grashof number represents the intensity of this buoyant force [26]:
$G_r=\frac{g \beta \Delta T L^3}{v^2}$ (1)
This equation indicates that the greater the temperature difference (∆T), the stronger the buoyant force that drives natural circulation. The PV panel is oriented to the north with a tilt angle of 12.5°, which requires a correction to the gravitational acceleration component (g. cos ϑ) [27]. To determine whether natural convection dominates within the system, the Rayleigh number is used:
$R_a=G_r \times P_r$ (2)
If Ra > 104, natural convection heat transfer is considered significant. The convective heat transfer rate can be estimated using the Nusselt number (Nu), which relates convective to conductive heat transfer. In this case, the thermosyphon system receives energy from the underside of the PV panel, corresponding to the correlation for a surface heated facing down [27]:
$N u_L=0.27 \times R a_L^{1 / 4}$ (3)
The thermosyphon operates as a closed-loop system, meaning the mass of the working fluid remains constant over time [28]:
$\dot{\mathrm{m}}=\rho \cdot A \cdot v$ (4)
The mass flow rate (kg/s) is calculated as the product of fluid density (kg/m³), collector cross-sectional area (m²), and fluid velocity (m/s). In a closed system, the mass flow rate is constant throughout the entire loop, allowing it to be measured based on fluid movement at a single point, through visual observation of liquid displacement in the reservoir or the shifting of a liquid column. This approach is valid because the continuity principle ensures no leakage or accumulation of mass at any point within the system [12].
Author computes the overall resistance between the PV backplate and pond water in equation:
$\begin{aligned} R_{{Total }}=\frac{T_{P V}-T_{ {pond }}}{Q} =R_{c, { paste }}+R_{ {cond }, { Al }}+R_{ {conv }, { in }} +R_{ {pipe }}+R_{ {cond }, { Cu }}+R_{{conv}, { out }}\end{aligned}$ (5)
Conduction through the 1 mm aluminum collector and thermal paste is estimated with R = t / k. Transport properties of water (ρ, ν, μ) are temperature-dependent (interpolated each hour), while Cp is evaluated at the daily average (32.8℃). Where appropriate, bounds for convective coefficients are obtained from standard natural-convection correlations for internal channels (hydraulic diameter) and submerged external cylinders (condenser). Then report the overall conductance U Atotal = 1 / Rtotal.
The electrical efficiency of the PV module is defined as the ratio of maximum output power to the incident solar radiation power. As panel temperature increases, this efficiency tends to decline and can be expressed using the following equation [29]:
$P=I \times V$ (6)
where, P is the PV power output (W), I is the recorded current (A), and V is the voltage (V). This electrical power is used to compute the electrical efficiency.
$\eta_e=\frac{P}{A_{P V} \cdot G}$ (7)
In thermal analysis, the efficiency reduction due to increased panel temperature can be modeled using a linear approach [28]:
$\eta_e=\eta_{S T C}\left[1-\beta\left(T_{P V}-25\right)\right]$ (8)
Here, $\eta_{S T C}$ represents the standard test condition efficiency of the PV module, β is the temperature coefficient of efficiency loss (0.45%/℃ for polycrystalline silicon PV), and TPV is the panel temperature during measurement. Thermal efficiency (ηth) reflects how effectively the thermal energy from the PV panel is absorbed and transferred by the working fluid within the thermosyphon collector. This efficiency is calculated from the fluid temperature difference and mass flow rate as follows [28].
$\eta_{t h}=\frac{\dot{\mathrm{m}} \cdot C p \cdot\left(T_{ {out }}-T_{ {In }}\right)}{A_{T S} \cdot G}$ (9)
This formulation is particularly relevant for passive cooling systems such as thermosyphons, where no mechanical work is involved. Thermal efficiency can also be used to assess how well the system avoids excessive heat accumulation on the panel surface.
The thermosyphon loop used ordinary water. During daytime operation the bulk-water temperature varied within 26–35℃ (daily average 32.8℃ from 07.00 until 16.00). Because the variation of Cp over this narrow range is < 0.5%, we adopted Cp = 4.18 kJ/kg.K evaluated at 32.8℃ for the thermal power calculation. In contrast, transport properties were treated as temperature dependent: density (ρ), kinematic viscosity (υ), and dynamic viscosity (μ) were obtained at each time step by linear interpolation from standard water-property tables. These temperature-dependent values were used consistently in Grashof/Rayleigh and Nusselt correlations. An example of a summary of fluid properties (collector 40 ratio 0.75:1) applied is presented in Table 1.
Table 1. Water properties used in calculations
|
Depth 40 Ratio 0.75:1 |
||||||||
|
Time |
PV (℃) |
Collector Fluid Temperature |
ρ (kg/m3) |
υ (m2/s) |
μ (Pa.s) |
|||
|
T+ in (℃) |
T out (℃) |
∆T |
Average (℃) |
|||||
|
10.00 |
46.901 |
29.478 |
37.329 |
7.851 |
33.403 |
994.611 |
0.000000752 |
0.000748 |
|
11.00 |
48.932 |
30.511 |
39.253 |
8.742 |
34.882 |
994.138 |
0.000000729 |
0,000725 |
|
12.00 |
49.876 |
30.663 |
39.780 |
9.117 |
35.221 |
994.016 |
0.000000724 |
0,000720 |
|
13.00 |
48.466 |
30.613 |
38.948 |
8.334 |
34.780 |
994.170 |
0.000000730 |
0,000726 |
|
14.00 |
45.109 |
30.596 |
38.170 |
7.574 |
34.383 |
994.297 |
0.000000736 |
0,000733 |
Simple payback analysis is a standard approach to evaluate solar systems’ economic viability. Similar methods have been applied to thermosiphon solar water heaters, showing payback periods of 1.63 – 3.27 years in Tukey weather condition [30], and in hybrid photovoltaic-thermal (PVT) systems, where payback, IRR, and NPV are derived from combined electricity and heat outputs [31]. The cost-effectiveness of the FPV–TS system was evaluated using a simple payback approach under two scenarios: electricity-only and cogeneration (electricity and thermal). The payback period is defined as:
$\eta_{\text {th }}=\frac{\Delta C A P E X}{\Delta B_{{ANNUAL }}}$ (10)
where, $\triangle C A P E X$ is the additional investment cost per kWp compared to standard FPV, and $\triangle B_{{ANNUAL }}$ is the additional annual benefit.
$\Delta B_{A N N U A L}=E_{ {base }} \times \Delta \% \times P_e$ (11)
With $E_{{base }}$ is baseline annual energy yield of FPV (kWh/kWp.yr), ∆% is measured increase in daily-average electrical efficiency of FPV–TS relative to FPV, and $P_e$ electricity value (self-consumption or export tariff).
$\Delta B_{ {ANNUAL }}=E_{ {base }} \times \Delta \% \times P_e+E_{t h} \times P_{t h}$ (12)
where, $E_{{th}}$ is the sound thermal energy recovered from the working fluid, and $P_{{th}}$ is the equivalent value of displaced fuel or electricity. This framework allows for the reporting of conservative payback for electricity-only use and indicates the potential benefit of thermal energy recovery where applicable.
3.1 Temperature profile of photovoltaic panels at various collector geometries
For the aluminum collector wall, the through-thickness conduction resistance per unit area is Rcond,Al = 4.23×10⁻⁶ m2K/W, which is smaller than the water-side film resistances (10-3 – 10-2 m2K/W) thus steady-state UA (conductance) is set by convection rather than wall thickness. Thickness mainly impacts transient behavior through areal heat capacity. Increasing the thermal time constant approximately linearly with thickness, 1 mm is adequate for heat transfer; thicker walls should be chosen only for stiffness or corrosion allowance required by specific sites (e.g., seawater).
The analysis of photovoltaic panel temperature reveals that the thermosyphon collector's geometry significantly impacts the system’s cooling performance. In general, increasing the collector depth from 20 mm to 30 mm reduced panel temperature by approximately 1 – 1.3℃ across all tested W/D ratios. This phenomenon reflects an increased thermal mass capacity, enabling the working fluid to absorb more heat before condensation occurs. For instance, at 12:00 PM with a W/D ratio 1:1, the panel temperature decreased from 51.89℃ at 20 mm depth to 50.68℃ at 30 mm depth, then rose slightly to 51.11℃ at 40 mm depth. This indicates an optimal point, where the additional fluid volume at 30 mm is sufficient to absorb heat effectively without significantly reducing the natural flow velocity. Conversely, a depth of 40 mm begins to show a tendency toward reduced natural circulation due to increased flow resistance, evidenced by a higher fluid ∆T without notable improvement (or even a decline) in panel cooling effectiveness.
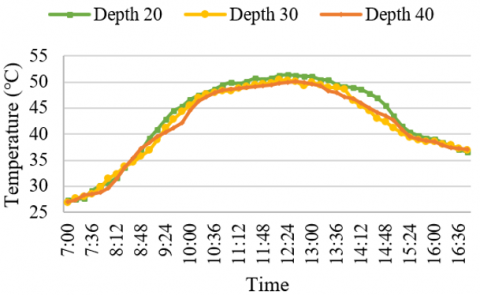
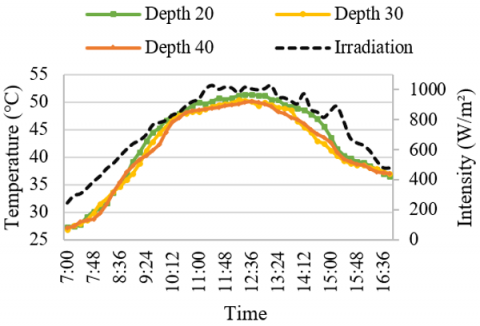
The narrower spacing between collectors at the 0.75:1 ratio allows for more homogeneous heat distribution and an increased local temperature gradient, which enhances fluid circulation. This condition accelerates heat transport from the panel to the working fluid, maintaining a lower and more stable panel temperature during peak solar radiation hours. The temperature reduction pattern for the 0.75:1 ratio throughout the day for each collector depth is clearly illustrated in Figure 7. The graph shows that the 30 mm depth consistently maintained lower temperatures than the 20 mm and 40 mm depths, particularly between 11:00 AM and 1:00 PM, when solar irradiance reaches its maximum. This suggests a 30 mm depth offers the most responsive configuration for handling high thermal loads.
Figure 7. Temperature decreases throughout the day on a ratio of 0.75:1
Furthermore, the direct effect of varying W/D ratios at a constant depth of 40 mm is illustrated in Figure 8. The graph confirms that although the larger fluid volume at 40 mm depth allows for greater heat absorption, cooling performance remains strongly influenced by the density and uniformity of collector distribution. The 0.75:1 ratio still demonstrated a temperature advantage of up to 1℃ lower than the 1.25:1 ratio during midday hours.
The narrow collector spacing (W/D = 0.75:1) and medium collector depth (30 mm) provides the most effective cooling. This configuration significantly reduces the panel surface temperature and maintains thermal stability during peak irradiance periods. This phenomenon is significant, as lower panel temperatures are directly correlated with improved electrical efficiency and prolonged lifespan of the photovoltaic system [8].
Figure 8. Temperature decreases throughout the day on a depth of 40 mm
3.2 Effect of W/D ratio on thermal flow and heat release capacity
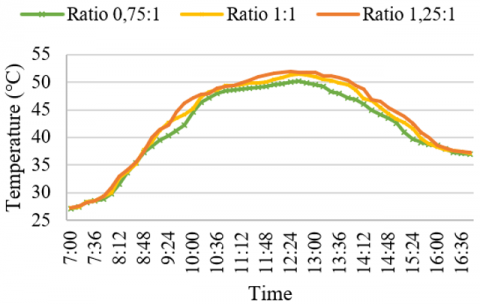
Experimental results show that the lower the W/D ratio, the more effectively the system reduces panel temperature, indicating that a denser collector distribution provides more efficient heat extraction pathways. At every collector depth, the 0.75:1 ratio consistently resulted in the lowest panel temperatures, followed by the 1:1 and 1.25:1 ratio. This phenomenon is attributed to enhanced heat absorption in areas with denser collector spacing, which creates more uniform local temperature gradients and accelerates natural fluid circulation. At a collector depth of 30 mm and during peak irradiance (12:00 PM), the panel temperature with a W/D ratio of 0.75:1 was recorded at 50.04°C, while the 1:1 and 1.25:1 ratio yielded 50.68°C and 51.22°C, respectively. The 1.18°C difference between the smallest and largest ratios is thermally significant in the context of photovoltaic performance. The advantage of the 0.75:1 ratio is evident in reducing peak temperature and maintaining temperature stability throughout daily fluctuations. The temperature reduction effect associated with the optimal W/D ratio is clearly visualized in Figure 9.
The graph shows that the panel with a 0.75:1 ratio maintained the lowest temperature compared to the other ratios, with a difference exceeding 1°C. The temperature drops for the 0.75:1 configuration was faster and more stable than in configurations with larger ratios, indicating the system’s thermal responsiveness to changing heat loads. This thermal behavior can be explained by the principle of natural convection, wherein a denser collector distribution provides a larger thermal conduction surface and a smaller region of accumulated heat, minimizing heat losses to the environment and enhancing energy transport to the working fluid [32]. A narrower ratio also shortens the lateral distance between heat source points and the collector, enabling more direct heat transfer without significant dispersion into the surrounding air [33]. As a result, fluid circulation becomes more active even without mechanical assistance.
Figure 9. Temperature data at an optimal ratio relative to intensity throughout the day
3.3 Effect of collector depth on thermal resistance, stagnation risk, and thermal performance
The collector depth in a thermosyphon system directly influences the heat absorption capacity and the effectiveness of working fluid circulation. Increasing the depth leads to a greater fluid volume within the collector, thereby increasing the thermal mass available to absorb and store thermal energy from the photovoltaic panel surface. However, this also introduces higher internal thermal resistance and may slow down natural circulation if not balanced with appropriate geometry, as noted by Diwania [34].
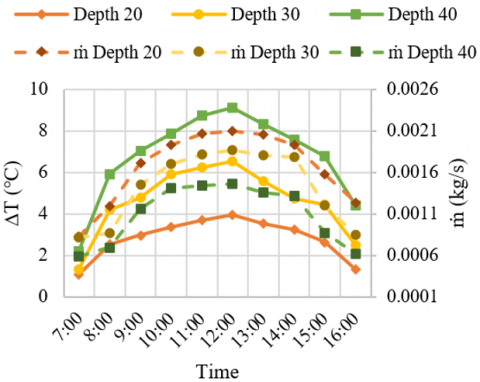
This is illustrated in Figure 10 (ΔT Comparison at Each Depth for W/D = 0.75:1), where the 40 mm depth shows the highest ΔT but the lowest flow rate, particularly at 12:00 PM during peak irradiance. In contrast, the 30 mm depth maintains a favorable ΔT alongside active circulation, making it the most thermo-hydraulically efficient configuration. While increasing the collector depth to 40 mm does enhance heat absorption capacity, it also brings the system closer to thermal stagnation, where fluid movement becomes minimal and heat is no longer effectively dissipated.
Figure 10. The ratio of delta T and mass flow rate
Mechanistically, increasing collector depth extends the thermal path length from the collector surface to the fluid and enlarges the channel cross-sectional area, reducing fluid velocity and increasing residence time. Depending on the match between fluid mass and the generated buoyant force, these effects can be beneficial or detrimental. If this balance is not achieved, fluid circulation may decline or even approach stagnation, where heat remains trapped in the fluid without efficient transfer to the condenser. The concept of increasing thermal resistance with larger thermosyphon dimensions is also supported by Badache et al. [35] who analyzed ground-coupled thermosyphon systems. Therefore, although a 40 mm depth can deliver the highest ΔT and thermal efficiency under specific configurations, its performance begins to exhibit diminishing returns and stagnation risks if not paired with an appropriate W/D ratio. Further analysis reveals that high aspect ratios can lead to flow instability or stagnation in thermosyphon systems, a finding thoroughly discussed by Nguyen and Merzari [36].
3.4 Power output and electrical efficiency trends
Findings from this study demonstrate that integrating a thermosyphon cooling system within a floating photovoltaic (FPV) configuration significantly enhances power output compared to conventional systems, particularly during peak solar irradiance. The highest power performance was recorded in the thermosyphon collector configuration with a depth of 30 mm and a W/D ratio of 0.75:1, reaching 49.73 W at 12:00 PM, substantially higher than the land-based PV (LPV) system, which only produced 39.16 W.
According to the maximum power output data, it can be observed that increasing collector depth from 20 mm to 30 mm resulted in a substantial improvement in power output. In contrast, a further increase to 40 mm yielded only marginal or stagnant enhancements depending on the W/D ratio. This indicates that electrical power output is susceptible to panel temperature. That efficient cooling can reduce the internal resistance of the solar cells, thereby significantly increasing the output current (Imp), even if the operating voltage (Vmp) slightly decreases.
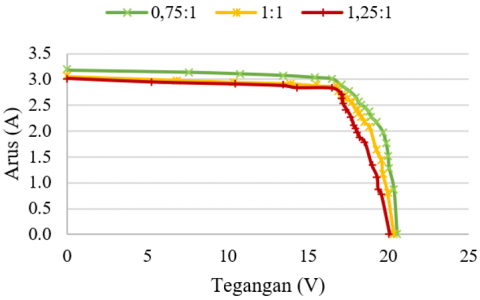
The system with a 30 mm depth and 0.75:1 ratio produced an Imp of 3.01 A and a Vmp of 16.52 V, outperforming all other configurations, as shown in Figure 11. The power gain from changing the ratio from 1.25:1 to 0.75:1 at 30 mm depth reached 6.3%, highlighting the strong effect of dense collector distribution in enhancing cooling and electrical performance. This aligns with the findings of Ibrahim et al. [37] who reported that using passive fins on PV panels can improve electrical efficiency by up to 2.55% through free convection, or 3.01% with forced convection.
Figure 11. I-V curves of the depth 30 collector at each W/D ratios
The two-way ANOVA results indicate that collector depth is the most dominant factor influencing the electrical power output of the FPV-Thermosyphon system. The calculated F-value of 103.50 is substantially higher than the critical F-value of 3.35, with a significance level (P-value) of 2.18 × 10⁻¹³ < 0.05, demonstrating a highly significant effect. This factor accounts for 61.51% of the total variation in power output.
Similarly, the W/D ratio also exhibits a significant effect, with an F-value of 46.19 > 3.35 and a P-value of 1.93 × 10⁻⁹, contributing 27.45% to the variation in power. In contrast, the interaction between collector depth and W/D ratio is statistically insignificant (F-value 2.54 < 2.73, P-value 0.063 > 0.05) and contributes only 3.01%, indicating that these factors act relatively independently in influencing power output. Interaction plots exhibited near-parallel trends across factors, supporting an additive interpretation over the tested range. Hence, optimization can be treated modularly, dominated by Depth and W/D, with negligible practical impact from the interaction. The remaining 8.02% of the variation is attributed to other uncontrolled factors or measurement uncertainty (within-group error). Therefore, it can be concluded that collector depth is the most influential design parameter, followed by the W/D ratio, while their interaction can be considered negligible in optimizing the system’s performance. These findings align with those of Assareh et al. [38] who employed optimization algorithms to determine the optimal collector design based on riser depth and spacing.
Given the lack of significant interaction between depth and W/D ratio in the statistical analysis, the system design can be modularized. Collector spacing and fluid depth can be modified separately depending on operational objectives such as peak efficiency, daily stability, or economic and structural considerations in field applications.
Then, to align with field-relevant operation, the author defines an optimal configuration based on daily averages rather than instantaneous peaks. Under this criterion, the 0.75:1, 30 mm configuration delivered the highest day-average electrical performance. In contrast, the 40 mm depth offered only marginal instantaneous advantages around noon without translating into a superior daily outcome.
3.5 Performance evaluation and total efficiency
For each geometry at 12:00, author computed overall conductance on the optimal geometry (W/D = 0.75:1, depth = 40 mm) shows overall conductance 2.854 W/K (representative daytime value), corresponding to overall resistance 0.687 K/W shifting to shallower depth (20 mm) or wider spacing (1.25:1) increases overall resistance (lower overall conductance), consistent with the higher panel temperatures and lower electrical output reported earlier. Overall resistance and conductance data are presented in Figure 12.
Based on the experimental results, the highest daily total efficiency was achieved by the collector configuration with a 30 mm depth and a W/D ratio of 0.75:1, reaching an average efficiency of 50.75%, followed closely by the 40 mm (0.75:1) configuration at 50.71%. These results highlight the significant contribution of collector depth to overall efficiency, although the effect of the W/D ratio remains substantial. The combination of 20 mm depth and a 1.25:1 ratio yielded an average efficiency of only 43.97%, significantly lower than the optimal configuration. This finding confirms that shallow and widely spaced collectors fail to capture and transfer heat efficiently to the working fluid, resulting in a steep decline in system thermal performance.
Figure 12. Overall resistance and conductance at 12.00
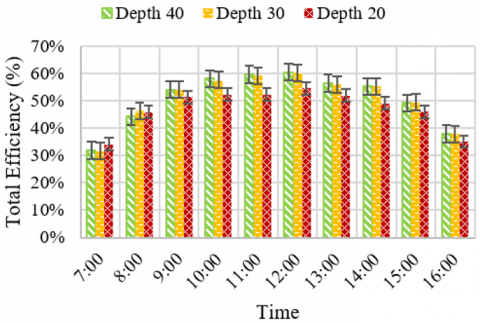
A visualization of total efficiency trends throughout the day for each depth at the optimal ratio (0.75:1) is shown in Figure 13. The graph reveals that the 40 mm depth configuration slightly outperformed others during peak irradiance (11:00–12:00), achieving a maximum efficiency of 60.52%. However, this advantage was neither linear nor sustained. After midday, the 30 mm depth configuration matched or slightly exceeded the performance of the 40 mm depth. Figures include error bars (mean ± SEM, n = 3); replicate-to-replicate spread remained small in the quasi-steady windows used for comparison, and configuration ranking was unchanged when considering propagated measurement uncertainty.
Figure 13. Total efficiency of 0.75:1 ratio at each depth variation
Compared with recent FPV-thermosiphon literature, our field results (up to 6.8℃ PV temperature reduction and 9.3% electrical-efficiency gain over FPV without cooling) fall within reported ranges and clarify where geometry optimization pays off. On a full-scale FPV array, Indartono and Nur [28] measured a drop from 49.57℃ (FPV) to 41.11℃ (FPV-thermosiphon) and an efficiency improvement of 27% against ground (8.18% for FPV vs ground), highlighting the incremental benefit of adding a passive loop to floating systems. Complementarily, Yoon et al. [13] showed that a radiative-cooling/thermosiphon concept can raise annual net power by 6.4% at a hot–dry site, underscoring the value of passive circulation when coupled with nighttime cold-storage. For FPV specifically, Sutanto et al. [12] combined experiments and CFD to demonstrate enhanced heat rejection from natural-convection loops on water bodies, supporting our use of buoyancy-driven cooling as a low-energy pathway. Broader PV cooling studies (forced-air/fin plates) report larger spot gains but at the expense of parasitic power, reinforcing the practicality of our passive approach for day-average performance [37]. Finally, a state-of-the-art FPV review reports energy-yield gains spanning 0.11–31.29% depending on site and design [22]; our measured improvements align with this band while adding a geometry-level explanation (optimal W/D = 0.75:1; depth = 30 mm) for passive FPV-TS natural convection.
Technically, this is closely related to thermal mass capacity and fluid circulation velocity. Although the 40 mm depth absorbs more heat, fluid circulation tends to slow due to the increased fluid column and frictional resistance. If the system operates in high thermal regimes for extended periods, heat accumulation may lead to decreased electrical efficiency despite high thermal performance. In contrast, the 30 mm depth configuration provides a more balanced outcome, where the fluid remains actively circulating, efficiently absorbs heat, and prevents excessive panel temperature rise. Another key point is that the improvement in total efficiency from 30 mm to 40 mm depth averaged only 0.03%, or less than one percent in absolute terms. Thus, while the 40 mm depth may deliver the highest absolute efficiency, the 30 mm depth is superior in terms of practical and economic considerations, including ease of manufacturing, smaller fluid volume, and lower installation complexity. This makes it the ideal configuration for large-scale field implementation.
Consistently, the day-average total efficiency was highest for 0.75:1, 30 mm (50.75%), with identical daily terms of 0.75:1, 40 mm (50.71%). The slight percentage-point difference (< 0.1%), coupled with increased fluid volume and potential flow deceleration at 40 mm, indicates diminishing returns when increasing depth beyond 30 mm. Hence, 30 mm is identified as the overall optimum for daily performance.
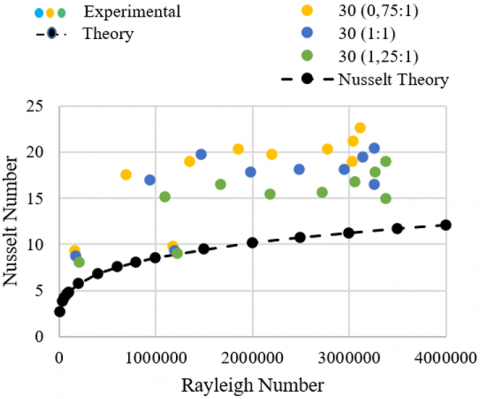
Figure 14. Correlation of Nu and Ra at depth 30
Detailed data for this optimal configuration showing an average fluid mass flow rate of 1.42 × 10⁻³ kg/s, fluid temperature difference (ΔT) of 4.63℃, maximum Rayleigh number of 3.12 × 10⁶, and maximum Nusselt number of 11.34. Under peak irradiance, thermal efficiency reached 46.33%, with a daily average of 35.93%. These values support a total system efficiency of 50.75%, making this configuration optimal in output, thermodynamically efficient, and fluidically stable. The relationship between the Rayleigh number (Ra) and the Nusselt number (Nu), which reflects the natural convection mechanism, is validated in Figure 14. The graph shows that all data points lie above the threshold for natural convection (Nu ≈0,27 RaL1/4 [27]), confirming that the entire system operates within the regime of active free convection.
A linear increase in Nu accompanies the rise in Ra at a 30 mm depth, indicating that this design effectively maintains a vertical temperature gradient to support fluid flow without external assistance.
The economic feasibility analysis of the FPV–TS system shows promising potential for return on investment, even in a conservative scenario that only considers electrical energy. Using the measured 9.3% improvement in daily-average electrical efficiency of FPV-TS (30 mm; W/D = 0.75:1) relative to FPV, and assuming an additional initial investment = IDR 1.0 million/kWp, the electricity-only scenario yields a simple payback of 5.1 years for self-consumption at IDR 1,400/kWh, and 8.0 years for sales to the government at IDR 900/kWh (range ≈4.9-5.5 and 7.6-8.5 years for 1,400-1,565 kWh/kWp.yr yields). This represents the conservative baseline, since thermal energy was not monetized.
In the co-generation scenario, where the recovered hot water (e.g., pre-heating, aquaculture, or industrial water use), the total benefit includes additional electricity and thermal energy. Under this case, the adequate payback would shorten significantly depending on the unit value of thermal energy (e.g., replacing electricity for heating or LPG/diesel fuel). Therefore, while the electricity-only payback already falls in a feasible range for distributed FPV sites, the integration of thermal utilization can improve economic viability further and reduce payback times.
This study was performed in quiescent water. Thus, the reported condenser-side heat transfer and overall conductance should be considered a conservative lower bound, as mild currents or wave-induced motion would thin the thermal boundary layer and enhance heat rejection. Conversely, dynamic conditions may introduce loop instability (via platform pitch/roll and intermittent aeration) and accelerate corrosion/biofouling (especially in seawater), necessitating appropriate mechanical design and protection. Future work should quantify performance under controlled crossflow (0–0.5 m/s) and wave conditions, assess loop stability versus platform motion, and evaluate marine-grade materials/coatings; design variables such as condenser submergence (0.3 – 0.5 m) and vertical leg separation can then be optimized. While a small interaction cannot be entirely ruled out, its effect size is minor and does not alter the geometry ranking; future work with larger samples can further bound this term.
This work defines optimal configuration as the geometry that maximizes daily average performance (day-average total efficiency and electrical output) under outdoor conditions. By this criterion, the thermosyphon collector with W/D = 0.75:1 and depth = 30 mm is optimal, yielding the highest daily total efficiency (50.75%) and stable electrical gains. The 40 mm collector at the same ratio showed a slightly higher instantaneous thermal efficiency at midday but no material advantage over a full day; the slight percentage-point daily difference (< 0.1%) underscores diminishing returns beyond 30 mm, increasing fluid inventory and fabrication complexity. Therefore, the author recommends 30 mm as the baseline design for cost-effective implementation, with 40 mm considered near-optimal where short-duration peak heat-rejection headroom is specifically required.
This work advances passive PV cooling strategies, particularly for space-limited environments, and supports sustainable energy practices with potential applications in floating solar farms and BIPV systems. However, limitations include the small-scale setup, static water conditions, and short-term operation. Future studies should explore dynamic aquatic environments, long-term durability, and integration with intelligent control or multifunctional platforms.
This paper presents the findings of a research project titled "Optimization of Renewable Energy Efficiency for Sustainable Energy Production," which is funded by Sebelas Maret University under the Penguatan Kapasitas Grup Riset (Pkg-uns) A scheme, with contract number 371/UN27.22/PT.01.03/2025.
|
A |
Surface area, m2 |
|
CP |
Specific heat, J. kg-1. K-1 |
|
G |
Solar radiation intensity, W. m-2 |
|
g |
Gravitational acceleration, m.s-2 |
|
Gr |
Grashof number |
|
I |
Current, A |
|
L |
Characteristic length, m |
|
$\dot{\mathrm{m}}$ |
Mass flow rate, kg. s-1 |
|
Nu |
Nusselt number |
|
P |
Power, W |
|
Pr |
Prandtl number |
|
Ra |
Rayleigh number |
|
STC |
Standard Test Condition |
|
T |
Temperature, ℃ |
|
v |
Fluid velocity, m. s-1 |
|
V |
Voltage, V |
|
Greek symbols |
|
|
$\beta$ |
Thermal expansion coefficient, K-1 |
|
ρ |
Fluid density, kg. m-3 |
|
υ |
Kinematic viscosity, m2. s-1 |
|
Subscripts |
|
|
e |
Electric |
|
In |
Thermosyphon water inlet |
|
Out |
Thermosyphon water outlet |
|
PV |
Photovoltaic |
|
th |
Thermal |
|
TS |
Thermosyphon |
[1] Azaliah, R., Hartono, D. (2020). Determinan intensitas energi di Indonesia: Analisis data panel. Jurnal Ekonomi Dan Pembangunan, 28(1): 53-63. https://doi.org/10.14203/JEP.28.1.2020.53-63
[2] Ilhaq, M.S., Pembangunan, E., Ekonomi, F., Brawijaya, U. (2022). Analisis determinan intensitas energi di Indonesia. Journal of Development Economic and Social Studies, 1(4): 550-562. https://doi.org/10.21776/jdess.2022.01.4.06
[3] Nunayon, S.S., Akanmu, W.P. (2022). Potential application of a thermosyphon solar water heating system for hot water production in beauty salons: A thermo-economic analysis. Case Studies in Thermal Engineering, 32: 101881. https://doi.org/10.1016/j.csite.2022.101881
[4] Statista. (2023). World electricity generation shares by source 2022 Statista. https://www.statista.com/statistics/269811/world-electricity-production-by-energy-source/.
[5] Sutanto, B. (2023). Analysis of hybrid system in the photovoltaic and photothermal technology. Eksergi, 19(1): 5. https://doi.org/10.32497/eksergi.v19i01.4191
[6] Shahsavari, A., Akbari, M. (2018). Potential of solar energy in developing countries for reducing energy-related emissions. Renewable and Sustainable Energy Reviews, 90: 275-291. https://doi.org/10.1016/j.rser.2018.03.065
[7] Mostakim, K., Hasanuzzaman, M. (2022). Global prospects, challenges and progress of photovoltaic thermal system. Sustainable Energy Technologies and Assessments, 53: 102426. https://doi.org/10.1016/j.seta.2022.102426
[8] Keyhanara, M., Arabhosseini, A., Gholami, Z., Rahmati, M.H. (2020). Progressive cooling technologies of photovoltaic and concentrated photovoltaic modules: A review of fundamentals, thermal aspects, nanotechnology utilization and enhancing performance. Solar Energy, 211: 117-146. https://doi.org/10.1016/j.solener.2020.09.048
[9] Abou Akrouch, M., Chahine, K., Faraj, J., Hachem, F., Castelain, C., Khaled, M. (2025). Advancements in cooling techniques for enhanced efficiency of solar photovoltaic panels: A detailed comprehensive review and innovative classification. Energy and Built Environment, 6(2): 248-276. https://doi.org/10.1016/j.enbenv.2023.11.002
[10] Prasetyo, S.D., Prabowo, A.R., Arifin, Z. (2023). The use of a hybrid photovoltaic/thermal (PV/T) collector system as a sustainable energy-harvest instrument in urban technology. Heliyon, 9(2): e13390. https://doi.org/10.1016/j.heliyon.2023.e13390
[11] Arifin, Z., Tjahjana, D.D.D.P., Hadi, S., Rachmanto, R.A., Setyohandoko, G., Sutanto, B. (2020). Numerical and experimental investigation of air cooling for photovoltaic panels using aluminum heat sinks. International Journal of Photoenergy, 2020(1): 1574274. https://doi.org/10.1155/2020/1574274
[12] Sutanto, B., Indartono, Y.S., Wijayanta, A.T., Iacovides, H. (2022). Enhancing the performance of floating photovoltaic system by using thermosiphon cooling method: Numerical and experimental analyses. International Journal of Thermal Sciences, 180: 107727. https://doi.org/10.1016/j.ijthermalsci.2022.107727
[13] Yoon, S., Seo, J., Choi, M., Lee, B.J. (2022). Enhanced photovoltaic efficiency through radiative cooling augmented by a thermosyphon effect. Energy Conversion and Management, 268: 116046. https://doi.org/10.1016/j.enconman.2022.116046
[14] Fu, H., Li, G., Li, F. (2019). Performance comparison of photovoltaic/thermal solar water heating systems with direct-coupled photovoltaic pump, traditional pump and natural circulation. Renewable Energy, 136: 463-472. https://doi.org/10.1016/j.renene.2019.01.028
[15] del Amo, A., Martínez-Gracia, A., Bayod-Rújula, A.A., Antoñanzas, J. (2017). An innovative urban energy system constituted by a photovoltaic/thermal hybrid solar installation: Design, simulation and monitoring. Applied Energy, 186: 140-151. https://doi.org/10.1016/j.apenergy.2016.07.011
[16] Choudhary, P., Srivastava, R.K. (2019). Sustainability perspectives-a review for solar photovoltaic trends and growth opportunities. Journal of Cleaner Production, 227: 589-612. https://doi.org/10.1016/j.jclepro.2019.04.107
[17] World Bank Group. (2019). Where sun meets water: floating solar market report. World Bank.
[18] Kibtiah, T.M., Bainus, A., Dian Prama Dewi, G., Rachman, M.F.A., Suitela, K.M., Hasan, D.R. (2024). Floating solar power plants potential in Indonesia. Journal of Renewable Energy and Environment, 11(3): 156-164. https://doi.org/10.30501/jree.2024.423550.1726
[19] Ranjbaran, P., Yousefi, H., Gharehpetian, G.B., Astaraei, F.R. (2019). A review on floating photovoltaic (FPV) power generation units. Renewable and Sustainable Energy Reviews, 110: 332-347. https://doi.org/10.1016/j.rser.2019.05.015
[20] Rosa-Clot, M., Tina, G.M., Nizetic, S. (2017). Floating photovoltaic plants and wastewater basins: An Australian project. Energy Procedia, 134: 664-674. https://doi.org/10.1016/j.egypro.2017.09.585
[21] Nahar, A., Hasanuzzaman, M., Rahim, N.A., Parvin, E.S. (2019). Numerical investigation on the effect of different parameters in enhancing heat transfer performance of photovoltaic thermal systems. Renewable Energy, 132: 284-295. https://doi.org/10.1016/j.renene.2018.08.008
[22] Deshmukh, S.V., Joshi, S.S., Khapekar, A.V., Mohite, M.Y. (2023). Theoretical and experimental investigations on the performance of passive cooling arrangement for solar photovoltaic module. Journal of the Brazilian Society of Mechanical Sciences and Engineering, 45(1): 32. https://doi.org/10.1007/s40430-022-03964-3
[23] El Hammoumi, A., Chtita, S., Motahhir, S., El Ghzizal, A. (2022). Solar PV energy: From material to use, and the most commonly used techniques to maximize the power output of PV systems: A focus on solar trackers and floating solar panels. Energy Reports, 8: 11992-12010. https://doi.org/10.1016/j.egyr.2022.09.054
[24] Trapani, K., Redón Santafé, M. (2015). A review of floating photovoltaic installations: 2007–2013. Progress in Photovoltaics: Research and Applications, 23(4): 524-532. https://doi.org/10.1002/pip.2466
[25] Bolaji, B.O. (2006). Flow design and collector performance of a natural circulation solar water heater. Journal of Engineering and Applied Sciences, 1(1): 7-13.
[26] Sutanto, B., Iacovides, H., Nasser, A., Cioncolini, A., Afgan, I. (2023). Numerical study of a natural convection cooling loop system for floating photovoltaic panels. In International Green Energy Conference, Springer Nature, Switzerland, pp. 1-19. https://doi.org/10.1007/978-3-031-48902-0_1
[27] Incropera, F.P., DeWitt, D.P., Bergman, T.L., Lavine, A.S. (1996). Fundamentals of heat and mass transfer. New York: Wiley, p. 116.
[28] Indartono, Y.S., Nur, A.M. (2023). Design and testing of thermosiphon passive cooling system to increase efficiency of floating photovoltaic array. Evergreen, 10(1): 480-488. https://doi.org/10.5109/6782151
[29] Hassan, A., Abbas, S., Yousuf, S., Abbas, F., Amin, N. M., Ali, S., Mastoi, M.S. (2023). An experimental and numerical study on the impact of various parameters in improving the heat transfer performance characteristics of a water based photovoltaic thermal system. Renewable Energy, 202: 499-512. https://doi.org/10.1016/j.renene.2022.11.087
[30] Yılmaz, S.E., Yildizhan, H., Yıldırım, C., Zhao, C.Y., Gomes, J., Alkharusi, T. (2023). The drivers and barriers of the solar water heating entrepreneurial system: A cost–benefit analysis. Sustainability, 15(20): 14989. https://doi.org/10.3390/su152014989
[31] Somasundaram, S., Tay, A.A. (2019). Performance study and economic analysis of photo-voltaic thermal system under real-life thermal loads in tropical climate. Sustainable Environment Research, 29(1): 34. https://doi.org/10.1186/s42834-019-0040-5
[32] Wang, F., Li, Z., Pang, D., Li, Z., Zhao, X., et al. (2024). Enhancing heat transfer of photovoltaic panels with fins. International Journal of Energy Research, 2024(1): 5180627. https://doi.org/10.1155/2024/5180627
[33] Rath, S., Dash, S.K. (2019). Effect of horizontal spacing and tilt angle on thermo-buoyant natural convection from two horizontally aligned square cylinders. International Journal of Thermal Sciences, 146: 106113. https://doi.org/10.1016/j.ijthermalsci.2019.106113
[34] Diwania, S., Agrawal, S., Siddiqui, A.S., Singh, S. (2020). Photovoltaic–thermal (PV/T) technology: A comprehensive review on applications and its advancement. International Journal of Energy and Environmental Engineering, 11(1): 33-54. https://doi.org/10.1007/s40095-019-00327-y
[35] Badache, M., Aidoun, Z., Eslami-Nejad, P., Blessent, D. (2019). Ground-coupled natural circulating devices (thermosiphons): A review of modeling, experimental and development studies. Inventions, 4(1): 14. https://doi.org/10.3390/inventions4010014
[36] Nguyen, T., Merzari, E. (2021). On the impact of aspect ratio and other geometric effects on the stability of rectangular thermosiphons. Journal of Heat Transfer, 143(7): 072601. https://doi.org/10.1115/1.4051055
[37] Ibrahim, T., Hachem, F., Ramadan, M., Faraj, J., El Achkar, G., Khaled, M. (2023). Cooling PV panels by free and forced convections: Experiments and comparative study. AIMS Energy, 11(5): 774-794. https://doi.org/10.3934/ENERGY.2023038
[38] Assareh, E., Jafarian, M., Nedaei, M., Firoozzadeh, M., Lee, M. (2022). Performance evaluation and optimization of a photovoltaic/thermal (PV/T) system according to climatic conditions. Energies, 15(20): 7489. https://doi.org/10.3390/en15207489