Nabeel Jabal Abed*![]() | Ehab Abdulrazzaq Hussein
| Ehab Abdulrazzaq Hussein![]()
© 2025 The authors. This article is published by IIETA and is licensed under the CC BY 4.0 license (http://creativecommons.org/licenses/by/4.0/).
OPEN ACCESS
Liver cancer remains a leading cause of mortality worldwide, where early and precise diagnosis plays a crucial role in improving patient outcomes. This study presents a novel deep convolutional neural network (CNN) architecture specifically designed for the classification of liver diseases in Computed Tomography (CT) and Magnetic Resonance Imaging (MRI) images. Unlike previous methods that depend on patch-based analysis or high-complexity transfer learning models, our model processes entire preprocessed images using tailored Hounsfield unit (HU) filtering and Contrast Limited Adaptive Histogram Equalization (CLAHE), eliminating the need for manual annotation and region selection. The proposed CNN demonstrates significant improvements over existing models by achieving 99.8% accuracy, 99.9% precision, and 100% recall across three benchmark datasets: The Cancer Genome Atlas Liver Hepatocellular Carcinoma Collection (TCGA-LIHC), 3D-IRCADb-01, and LiTS17. It also reduces computational overhead while maintaining high diagnostic performance. These advancements highlight the effectiveness and efficiency of our approach in facilitating early detection and classification of liver tumors, offering substantial contributions to computer-aided diagnosis systems.
CNN, deep learning, CT, MRI, Hounsfield unit, Contrast Limited Adaptive Histogram Equalization, TCGA-LIHC, IRCADb-01, LiTS17, DWT
Liver cancer is one of the leading causes of cancer-related deaths globally. Despite advancements in treatment, the disease still exhibits high mortality rates, largely due to challenges in early and accurate diagnosis. Medical imaging, particularly CT and MRI, remains the cornerstone of liver disease evaluation. However, conventional diagnosis methods are often time-consuming and subject to inter-observer variability, necessitating automated and intelligent systems based on deep learning [1-3]. CT and MRI imaging techniques are the primary tools for identifying hepatic lesions through detection, diagnosis, and monitoring. The challenge of underdiagnosis emerges because of subtle tissue contrast differences and noise from variations in anatomical structures, which interfere with proper treatment. Using traditional methods with prior knowledge and tissue properties usually results in unpredictable results, but deep learning models built on ResNet-50, AlexNet, and GoogLeNet achieve better segmentation accuracy. Despite the advancements in medical imaging, these improvements require higher computational resources [4, 5].
Abdominal CT scans are a valuable tool for the early detection and characterization of various liver cancers. They provide detailed information on the size, shape, and location of tumors within the liver and surrounding abdomen, along with the vascular anatomy. Accurate lesion characterization is crucial for treatment planning. However, radiologists face the time-consuming task of manually detecting and segmenting lesions within complex 3D CT images containing numerous lesions. This highlights the need for computer-aided analysis to assist physicians in liver metastasis detection and size evaluation in CT scans. Automatic segmentation of liver lesions and parenchyma remains challenging due to lesions' varying contrast enhancement patterns and the inherent variability in perfusion and scan timing, leading to poor image contrast between these tissues [6, 7].
This study explores the development of a deep-learning model for liver disease classification through a comparative analysis of various classifiers. A confusion matrix was utilized to assess each model's classification performance using multiple evaluation metrics. Given the complex clinical features of liver cancer histopathological images and the heterogeneous training data, a CNN model with superior architecture is proposed for tumor detection in liver CT and MRI images to address the challenges of feature extraction. The key contribution of our work lies in designing a scalable CNN model that can effectively handle both large, heterogeneous datasets and smaller datasets.
Despite notable advancements in liver image classification using CNNs, many existing models still depend on high computational resources, manual region selection, or are trained on limited, modality-specific datasets. Moreover, few frameworks simultaneously support CT and MRI images in a unified architecture. To address these limitations, this study proposes a robust and lightweight CNN model that processes entire liver images, eliminating the need for patch-based input and reducing redundant computations. The architecture integrates optimized preprocessing techniques, including HU filtering and CLAHE, to enhance tissue contrast and suppress irrelevant regions. Designed for small and large heterogeneous datasets, the model achieves classification accuracy exceeding 99%, combining high diagnostic performance with computational efficiency. This balance of adaptability, precision, and speed represents the core contribution of this research.
The paper is structured as follows: Section 2 reviews related work; Section 3 outlines the methodology; Section 4 presents the results and comparative analysis of the proposed method; and Section 5 provides the conclusion.
Deep learning models demonstrate the potential to accurately predict liver diseases when provided with access to a broader range of patient data, including hidden attributes. Prior research has leveraged diverse datasets comprising binary computed tomography images, histologically stained slides, liver function blood tests, and molecular markers within blood samples to train classifiers for liver disease prediction. This review summarizes recent studies investigating the identification and classification of liver diseases using these advanced deep-learning techniques [8, 9].
A dual-model framework was proposed in the study [10] for liver tumor detection and classification in CT scans using the LiTS2017 dataset. The system integrates TAGN, a Transformer-based U-Net variant for segmentation, and ViT-GRU, which combines Vision Transformer features with Gated Recurrent Units for classification. TAGN achieved a segmentation accuracy of 84.65%, while ViT-GRU reached 98.79% classification accuracy, with 96.12% precision and 95.64% recall, outperforming conventional models.
An Improved Probabilistic Neural Network using Bayesian Optimization (IPNN-BO) for the segmentation and classification of liver tumors using the LiTS17 dataset was proposed by Kolli in the study [11]. This approach addresses problems like the intensity overlap of tissues and morphological variations using several preprocessing methods such as denoising, edge sharpening, and normalization. Segmentation was performed using custom-designed liver and tumor masks, and the optimization of hyperparameters was done using Bayesian techniques. The IPNN-BO recorded a Dice accuracy of 0.897 for segmentation and attained 99.25% classification accuracy, outperforming baseline methods like KNN, CNN, and DCNN.
Sumash Chandra Bandaru in research [12] introduced Swingale, a liver tumor classification framework utilizing the Duke Liver Dataset. The model integrates Swin Transformers for spatial feature extraction and employs GANs for data augmentation. Attention mechanisms, including CBAM and ECA, are incorporated to enhance regional feature discrimination. Built upon VGG19 with feature fusion, Swingale achieved a classification accuracy of 99.29%.
A liver segmentation and classification methodology were presented in reference [13] by using the Edge Strengthening Parallel UNet (ESP-UNet) to handle both under-segmentation and over-segmentation artifact problems in computed tomography (CT) scans. The methodology presents an Automated Lesion Classification and Detection (ALCD) system using lightweight sequential Deep Convolutional Neural Networks (DCNNs). The combined approach reached 98.60% accuracy with perfect recall of 1.00, precision of 0.97, and F1-score of 0.98.
A deep learning technology-based network was proposed in a study [14] for classifying early-stage liver cancer using the LiTS dataset. This technique utilized Gaussian filtering for removing noise, the Enhanced Otsu Method (EOM) for the extraction of the liver area, and classification was done using a Dilated Attention Convolutional Neural Network (DA-CNN). The model successfully classified liver cancer into NC, HCC, and CC at 98.20% accuracy.
A multimodal DNN was presented by the authors in research [15] for the classification of liver cancer types, namely HCC Multiple, HCC Single, and mCRC. The network architecture simultaneously examined varied imaging modalities for cancer-relevant feature detection. For stable training and to avoid the potential of overfitting, strategies like batch normalization and stochastic depth were utilized. Evaluated on a dataset collected from various institutions, the model reported a classification accuracy of 96.06%, with an area under the curve (AUC) measure of 0.832.
A two-step computer-aided diagnosis method was proposed by the authors in the study [16] using pre-treatment portal venous phase CT scans for liver tumor classification. A modified Inception v3 network was used to differentiate between HCC, ICC, CRLM, and benign tumors. Evaluated on a multi-institutional dataset of 814 patients, the model achieved an overall accuracy of 96%, with class-wise sensitivities of 96% (HCC), 94% (ICC), 99% (CRLM), and 86% (benign tumors).
The authors in their research study [17] proposed a VGG-16-based model for classifying thyroid ultrasound images as benign or malignant, using TCGA-THCA and DDTI datasets. After applying histogram equalization and fine-tuning the pre-trained network, the model achieved 99.80% accuracy, 100% precision, and 98.9% F1-score. While the results are impressive, the study focused on binary classification using 2D ultrasound. In contrast, the proposed CNN in this work handles multi-class classification on CT and MRI data, offering broader applicability and comparable accuracy with higher modality complexity.
The previous models, named ResNet Unet and Inception-v3, demonstrated effective performance in liver tumor detection despite their existing constraints. The ResNet model effectively handles gradient issues, but this model needs extensive computational power and long training periods. UNet functions well in image segmentation, yet shows lower performance in classifying medical images when dealing with restricted data resources or when making multiclass predictions. Inception-v3 implements a complex structure that does not work effectively for immediate clinical processing. The new CNN model establishes an optimized relationship between precision and operational efficiency. The model's performance in classification operations becomes better than ResNet and other systems because it avoids complex pathways and multi-scale connections, which enable 99.8% accuracy with minimal processing requirements. The combination of CT and MRI data through a single unified training approach boosts the model's generalization capabilities, which commonly remains unexplored in existing research.
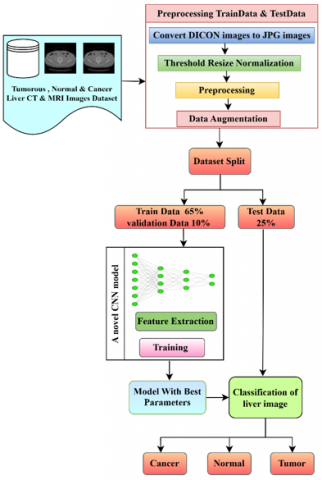
This section outlines the proposed CNN-based framework for the classification of liver diseases from CT and MRI images. The overall methodology is illustrated in Figure 1 and consists of three main stages: preprocessing, feature extraction, and deep learning-based classification. The prescribed workflow begins with the image preprocessing phase, where unhindered compatibility with the CNN is ensured by transforming the DICOM-format CT images into the JPG format. Furthermore, the HU intensity scale is also limited to values in the range of -75 to 150 to emphasize the tissue densities of the liver and exclude irrelevant regions such as bones and air in CT images. After windowing the HU images, CLAHE is applied to both the HU images and the JPG version of the MRI images to enhance contrast and outline the tumor edges alongside the physiological tissue appearances. Other preprocessing steps comprise intensity thresholding to leave intensities that are clinically significant, image resizing to a standard spatial resolution of 100 pixels by 100 pixels, and normalization of pixel values across all datasets to a standard pixel value. All the images are reconstructed into three channels before they are analyzed to meet the input requirements of the convolutional neural network.
Figure 1. Block diagram for the proposed model
Data augmentation is applied to expand the dataset and improve generalizability through rotation, flipping, and brightness adjustments. The refined data is split into 65% for training, 10% for validation, and 25% for testing. The CNN model is trained to extract hierarchical features from the liver images, automatically learning texture, shape, and structural patterns associated with various liver conditions. Model parameters are optimized iteratively to minimize classification error, based on validation metrics that include accuracy, sensitivity, and specificity.
Upon completion of training, the model is deployed to classify liver images into three categories: cancer, tumor, and normal. The learned feature representations guide the classification, enabling robust performance across heterogeneous image modalities. The proposed pipeline integrates advanced preprocessing, high-quality imaging datasets (TCGA-LIHC, 3D-IRCADb-01, and LiTS17), and an efficient CNN architecture, offering a reliable approach for automated liver disease detection and diagnosis.
3.1 The liver datasets preparation
This study utilized three publicly available liver imaging datasets: 3D-IRCADb-01, LiTS17, and TCGA-LIHC [18-20]. These datasets contain abdominal CT scans originally stored in the DICOM (.dcm) format. However, DICOM files are not natively supported by most deep learning libraries. All DICOM images were converted to JPEG (.jpg) format to address this issue. The conversion process was implemented using MATLAB. A custom conversion pipeline was applied and executed in two stages. The main script iterated through a list of DICOM file identifiers. A helper function (dicom2image.m) was called for each file. This function uses MATLAB’s dicomread to load the image data. The image was normalized using mat2 gray, scaled to an 8-bit representation using uint8, and saved in JPEG format using imwrite. This procedure ensured that the images were preserved with high visual fidelity while being formatted for compatibility with deep learning models. The converted images were resized and stored in a consistent format and resolution, enabling streamlined training and testing of the custom-designed convolutional neural network.
The 3D-IRCADb-01 dataset provides CT scans from 20 patients (10 male, 10 female), ranging from 260 to 2800 axial slices per scan at a resolution of 512×512. The LiTS17 dataset comprises 130 training and 70 testing volumes for the liver tumor segmentation benchmark.
Our decision to rely heavily on well-documented public data, including TCGA-LIHC, 3D-IRCADb-01, and LiTS17, to conduct this fundamental study was driven by interconnected issues. Top among these is the provision of standardized procedures for acquisition, which, in addition to making the direct comparison of the results to current state-of-the-art procedures a less daunting task, also makes the reproducibility of our findings that much easier. Nevertheless, we are mindful of the shortcomings that real-life clinical circumstances impose with heterogeneous scanner manufacturers, varying protocols, different demographics of patients, and variable clinical presentations of diseases, which can lead to misinterpretations.
3.2 Preprocessing
All CT images underwent a systematic pre-processing pipeline to enhance structural clarity and improve the reliability of feature extraction for downstream classification tasks. The initial step involved converting raw DICOM pixel values to HU, which represent a standardized radiodensity scale used in computed tomography. This conversion is crucial for ensuring consistency across imaging devices and clinical settings. The transformation is performed using a linear mapping extracted from DICOM metadata:
$\begin{gathered}H U=RawValue \times RescaleSlope+RescaleIntercept\end{gathered}$ (1)
This enables meaningful interpretation of tissue densities; the range of -75 to 150 HU was deliberately chosen based on established clinical practices for liver CT imaging [21, 22]. After conversion, intensity windowing was applied to isolate and emphasize relevant anatomical structures. Voxels outside the selected liver window were clipped, and the resulting image was rescaled to a normalized range of [0,1], preparing it for further enhancement.
To amplify local contrast and expose subtle tissue boundaries, CLAHE was applied to the windowed HU images. CLAHE divides the image into contextual regions (tiles), performs histogram equalization within each, and then combines the results using bilinear interpolation. To prevent over-enhancement of noise, a clip limit (0.01) was set, controlling the maximum slope of the cumulative distribution function within each tile. The intensity histogram hm,n(r) for a tile Tm,n was computed as:
$h_{m, n}(r)=\sum_{(x, y) \in T_{m, n}} \delta(I(x, y)-r)$ (2)
where, δ is the Kronecker delta function, excess pixels above the clip limit were redistributed to maintain contrast without introducing artifacts.
The 8×8 tile size ensured that enhancement was localized to small, clinically relevant regions, while the modest clip limit of 0.01 was effective in enhancing the visibility of subtle tumor boundaries and textural details without amplifying background noise. This combination proved essential for normalizing the diverse datasets and preparing them for the subsequent feature extraction stages. It is important to note that using other parameter values for CLAHE, such as a clip limit of 0.02 with an 8×8 tile size (resulting in 95.6% accuracy), or a clip limit of 0.01 with a 4×4 tile size (90.1% accuracy) or 16×16 tile size (85.7% accuracy), consistently led to sub-optimal performance compared to our chosen parameters.
Following contrast enhancement, a 2D median filter was employed to suppress high-frequency noise and improve overall image quality. This non-linear filter replaces each pixel with the median of its neighboring values within a fixed window (3×3), making it highly effective against impulsive noise while preserving anatomical boundaries. Compared to linear smoothing filters, the median filter maintains edge sharpness and structural fidelity, which are essential in medical imaging analysis.
The integrated application of HU normalization, intensity windowing, CLAHE, and median filtering yielded images with improved clarity, balanced contrast, and reduced noise artifacts. This pre-processing sequence proved particularly beneficial for subsequent classification tasks, as it enhanced the visibility of diagnostically significant features while suppressing irrelevant variability. Figure 2 shows the liver image before and after the pre-processing using HU, CLAHE, and a median filter.
Figure 2. Preprocessing state of the CT image before and after applying HU, CLAHE, and the median filter
3.3 Proposed CNN design
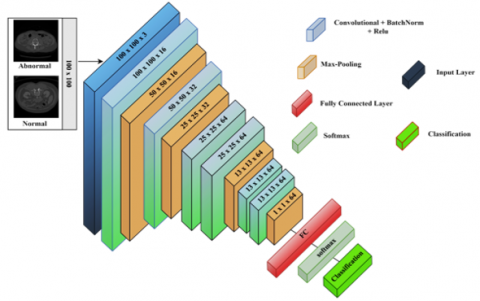
The suggested CNN model is designed to extract high-level features from 100×100-pixel grayscale medical images. A proposed CNN architecture for liver tumor classification comprised six convolutional blocks and a fully connected layer. Each convolutional block consisted of a convolutional layer with more learnable filters (16, 32, and 64 for the subsequent four layers), capturing more abstract features from the images. The architecture's deeper convolutional layers are designed to capture high-level discriminative features, such as morphological or textural patterns that distinguish pathological abnormalities from normal regions. These layers are sequentially followed by batch normalization, rectified linear unit (ReLU) activation, and max-pooling operations to optimize feature robustness and computational efficiency. The network architecture integrated four max-pooling layers, each contributing to the progressive downsampling of feature maps. Full and convolutional layers followed a ReLU activation function and batch normalization to enhance training stability and make the network more effective. By combining them, it brings in non-linearity, allowing for the network to learn complex patterns. To mitigate overfitting, dropout regularization with a probability of 0.1 was applied to the fully connected layer. Finally, softmax activation was utilized to compute low-risk probabilities. The model was optimized using the Adam (Adaptive Moment Estimation) optimizer with a learning rate of 0.001 and trained over 25 epochs, allowing fast convergence and high performance across diverse datasets. The proposed model's structure is illustrated in Figure 3.
Figure 3. The proposed CNN structure
3.4 Feature extraction
Mathematical transformations play a crucial role in extracting hidden or subtle patterns from medical images that are not easily discernible in their raw form. Among the most prominent techniques, the Discrete Wavelet Transform (DWT) has demonstrated high efficacy in image analysis, particularly in medical image feature extraction. In the context of this study, 2D-DWT was employed on liver CT images to extract meaningful texture and structural features. The wavelet transform is capable of decomposing an image into a set of sub-bands that represent different frequency components and orientations, capturing both spatial and spectral characteristics. The 2D-DWT is applied in a separable manner: first across the rows and then across the columns of the image, effectively generating four sub-band components — approximation (LL), vertical details (LH), horizontal details (HL), and diagonal details (HH).
The decomposition is mathematically defined using low-pass and high-pass filters, denoted by h[n] and g[n], respectively. For a 1D discrete signal, the approximation and detail coefficients at the first level of decomposition are obtained as:
$\begin{gathered}\text { Low-pass (approximation):} a[k]=\sum_n x[n]. h[2 k-n]\end{gathered}$ (3)
High-pass (detail): $d[k]=\sum_n x[n] \cdot g[2 k-n]$ (4)
In 2D-DWT, this decomposition is extended to two dimensions by applying the 1D-DWT first along the image rows and then along the columns, resulting in four sub-band images which can be mathematically represented by:
$L L(i, i)=\sum_m \sum_n I(m, n) \cdot h(2 i-m) \cdot h(2 j-n)$ (5)
$L H(i, j)=\sum_m \sum_n I(m, n) \cdot h(2 i-m) \cdot h(2 j-n)$ (6)
$H L(i, j)=\sum_m \sum_n I(m, n) \cdot h(2 i-m) \cdot h(2 j-n)$ (7)
$H H(i, j)=\sum_m \sum_n I(m, n) \cdot h(2 i-m) \cdot h(2 j-n)$ (8)
where, I(m,n) is the input image.
In this study, we utilized the Haar wavelet, a commonly used wavelet function defined by its simple step-like structure, suitable for detecting sharp transitions and edges in CT images. We performed both one-level and two-level decompositions, in which only the LL sub-band is recursively decomposed to achieve a multiscale representation. The 2D-DWT-based feature extraction provided a multi-resolution and compact description of liver CT images, enabling the identification of both global structures and fine textures relevant to liver pathology.
3.5 Training
The proposed CNN model learns image features through multiple convolutional and pooling layers, followed by a fully connected layer for classification. To optimize performance, hyperparameters were tuned via grid search over discrete values, as detailed in Table 1, with accuracy used as the primary selection criterion. The model was trained using the Adam optimizer with a learning rate of 0.001, a batch size of 32, and for 25 epochs. A dropout rate of 0.1 was applied to reduce overfitting. During training, weights were updated iteratively through forward and backward propagation to minimize loss and ensure stable convergence.
Table 1. Hyperparameter tuning and optimization values
|
Hyper Parameter |
Value |
|
Learning Rate |
0.001 |
|
Batch Size |
32 |
|
Number of Epochs |
25 |
|
Optimizer |
Adam |
|
Dropout Rate |
0.1 |
A data split of 65% for training, 10% for validation, and 25% for testing was adopted to provide a sufficient training volume while maintaining a robust and unbiased test set for final evaluation.
Our approach involved a series of practical experiments where different combinations of hyperparameters were tested to ensure a stable training process, avoiding issues such as overfitting identify the configuration that yielded the optimal balance between model performance (primarily accuracy) and generalization capability (minimizing the gap between training and validation curves).
We systematically varied critical hyperparameters, including the learning rate, batch size, and optimizer settings. The impact of these variations was observed through the model's convergence behavior, final accuracy, and the learning curves (training vs. validation loss/accuracy over epochs). Configurations that led to rapid convergence without significant overfitting, and ultimately achieved the highest validation accuracy, were selected.
Data augmentation played a critical role in enhancing the model's generalizability and robustness. By introducing transformations such as rotation, flipping, and shearing, the model was exposed to varied orientations and intensities, reducing overfitting and improving classification accuracy across all datasets. Although the class distributions in the benchmark datasets used were relatively balanced, augmentation also helped mitigate minor class imbalances, especially for rare tumor subtypes. Regarding the architecture illustrated in Figure 4, each convolutional layer employed 3×3 filters with a stride of 1 and 'same' padding to preserve spatial dimensions. Max-pooling layers with 2×2 filters and a stride of 2 were applied after specific convolutional blocks to downsample the feature maps progressively. The model operates on 2D image slices; therefore, standard 2D convolutions were used instead of 3D convolutions. While volumetric CT/MRI data were available, slices were extracted individually to reduce complexity and maintain training efficiency without compromising diagnostic relevance.
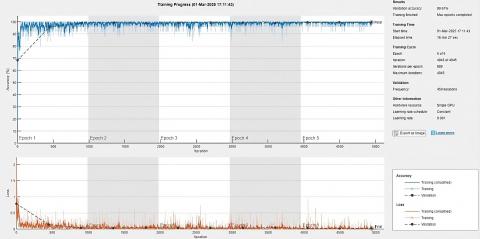
Figure 4. The training progress of a deep learning model designed
The proposed model was implemented and validated in MATLAB 2023b on a system equipped with 16 GB RAM, an Intel Core i5 (12th Gen) processor, an RTX 4060 Ti GPU, and Windows 11 OS. Performance evaluation was conducted using three benchmark datasets, including histopathological images for liver cancer. The evaluation metrics included accuracy, precision, recall (also known as sensitivity), specificity, F1-score, and intersection over union (IoU), supported by confusion matrix elements: true positive (TP), false positive (FP), false negative (FN), and true negative (TN). Precision measured the proportion of correctly predicted abnormal cases among all predicted abnormal cases, while recall quantified the proportion of correctly identified abnormal cases among all actual abnormal cases. The F1-score provided a harmonic mean of precision and recall. All metrics were computed for each dataset based on standard Eqs. (9)-(14), and the results are summarized in Table 2.
recall $=\frac{T P}{T P+F N}$ (9)
Precision $=\frac{T P}{T P+F P}$ (10)
Accuracy =$\frac{(T P+T N)}{T P+T N+F P+F N}$ (11)
$\mathrm{IoU}=\frac{T P}{T P+F P+F N}$ (12)
$F_1$-score $=\frac{2 \times \text { sensitivity } \times \text { recall }}{\text { sensitivity }+ \text { recall }}$ (13)
specificity $=\frac{T N}{T N+F P}$ (14)
Figure 4 illustrates the training progression of the proposed CNN across three datasets: TCGA-LIHC, 3D-IRCADb-01, and LiTS17. The accuracy curve shows a rapid initial increase, stabilizing near 100% after approximately 1,000 iterations, while validation accuracy improved from 59.58% to 99.61% by the end of the fifth epoch—demonstrating strong generalization and minimal overfitting. The corresponding loss curve exhibited a sharp decline followed by stabilization, indicating effective learning and optimized parameter tuning. Training was completed in 4,945 iterations over five epochs, using a constant learning rate of 0.001 and a single GPU setup, with a total runtime of 16 minutes and 27 seconds. These results confirm the model’s efficiency and ability to learn from heterogeneous datasets with high computational practicality.
The evaluation metrics (accuracy, precision, recall, F1-score, specificity, and IoU) were chosen to render a complete judgement of the model’s classification ability. In medical diagnosis, recall (sensitivity) is of particular importance because it indicates the capacity of the model to identify pathological cases in the correct way, avoiding false negatives. Precision, in contrast, reflects the confidence of the positive predictions, which is crucial for cost-effective avoidance of subsequent follow-up tests. Specificity helps normal tissues to be correctly classified, thus decreasing false positives. The F1-score compromises between precision and recall, and IoU provides spatial accuracy that is particularly useful in segmentation-aware classification. The proposed CNN outperformed state-of-the-art models like GoogleNet, Inception-v3, and ResNet-50 according to all the performance metrics. This is due to the customized architecture, focused pre-processing, and training approach, which leads to outperforming the more complicated models even with its small computational footprint.
Table 2. The intermediate results of the proposed CNN model on three benchmark datasets
|
Dataset |
Type |
Accuracy (%) |
Precision (%) |
Recall (%) |
IoU (%) |
F1-Score (%) |
Specificity (%) |
|
TCGA-LIHC |
Cancer |
99.7 |
100 |
99.7 |
99.7 |
99.85 |
100 |
|
Normal |
94.1 |
100 |
94.1 |
96.9 |
99.7 |
||
|
3D-IRCADb-01 |
Normal |
99.7 |
99.2 |
100 |
99.2 |
99.6 |
100 |
|
Tumor |
100 |
99.6 |
99.6 |
99.8 |
99.2 |
||
|
LiTS17 |
Normal |
99.5 |
98.9 |
98.5 |
97.8 |
97.7 |
99.7 |
|
Tumor |
99.7 |
99.8 |
99.1 |
99.75 |
98.9 |
||
|
TCGA-LIHC, 3D-IRCADb-01, and LiTS17 |
Cancer |
99.8 |
99.7 |
99.9 |
99.6 |
99.8 |
99.7 |
|
Normal |
96.9 |
100 |
96.6 |
98.2 |
99.7 |
||
|
Tumor |
100 |
99.6 |
99.6 |
99.8 |
100 |
A detailed quantitative assessment of the propositional CNN architecture's complexity was undertaken to prove that it is a lightweight one. The model was evaluated along two principal axes, which include the total number of parameters that can be trained and the number of floating-point operations (FLOPs) performed in a single forward pass. These measures form the established size and computing expense measures in models. To compare our model, we contrasted it with the well-established ResNet-50 structure, which is a default benchmark in computer vision. Table 3 indicates the results. Floating-point operations were also calculated in each model under an input dimension of 100×100×3, which were the exact dimensions used in the present research.
Table 3. Comparison of computational complexity
|
Model |
Total Parameters |
FLOPs |
|
Our Proposed Model |
~0.31 million |
~75.8 million |
|
ResNet-50 |
~25.6 million |
~1.34 billion |
This dramatic reduction in both parameters and FLOPs directly translates to a significantly lower inference time, making our model exceptionally well-suited for real-time applications and deployment on resource-limited hardware, such as embedded systems in clinical settings.
A confusion matrix analysis was used to analyze the accuracy of the proposed CNN model compared to pre-trained models (AlexNet, VGG16, ResNet-50, Inception-v3, and GoogleNet). From Figure 5 and Table 4, the analysis reveals that classification accuracy is directly influenced by the complexity of the images. The small scale of the AlexNet network had difficulty extracting the unique features of the histopathological images, and the performance was low compared to other models. VGG16 was improved only modestly due to its large depth, whereas ResNet-50 achieved sufficient performance through the residual connections, overcoming the gradient vanishing issues. Inception-v3 outperformed other pre-trained models due to its use of multi-scale convolutions, and GoogleNet outperformed all the other pre-trained models due to its excellent design for complex pattern recognition.
The proposed CNN method delivers superior performance on all benchmark datasets, achieving an accuracy of 99.8%, precision of 98.77%, recall of 99.83%, specificity of 99.8%, an IoU of 98.6% and F1-score of 99.27%. The achieved results provide evidence of the model's strong feature extraction capabilities and reliable classification system. The model demonstrates outstanding recall and sensitivity, which enables it to find genuine positive diagnoses while avoiding missed cases in medical diagnostics. The system maintains high specificity in the identification of negative cases, which leads to reduced false positives.
Within the framework of our manuscript, it should also be stressed that all the models subjected to the research, including both the proposed CNN architecture and the most frequent pre-trained models (Inception-v3, ResNet-50, and VGG16), were evaluated under identical conditions. All CT and MRI images from all datasets were subjected to a coherent preprocessing protocol presented in Section 3.2, before being included in any model. With the help of such a strict protocol, we ensure that the comparison between the performance measures is fair and unbiased, since all models will be trained and tested on data that have the same enhancement, normalization, and standardization processes. As a result, all possible confounding factors that might be present through the difference in data preparation used are mitigated, and the strength of the models, along with their comparative advantages, thus becomes all the more strengthened.
Table 4. Performance of the proposed CNN with other methods
|
Methods |
Accuracy (%) |
Precision (%) |
Recall (%) |
IoU (%) |
F1-Score (%) |
Specificity (%) |
|
alexnet |
88 |
98.4 |
88.9 |
87.61 |
93.41 |
68.2 |
|
vgg16 |
89.2 |
98.6 |
89.9 |
88.73 |
94.05 |
77 |
|
resnet50 |
91.4 |
94.2 |
95.7 |
90.41 |
94.94 |
66.7 |
|
googlenet |
92.1 |
99.9 |
91.7 |
91.66 |
95.25 |
99.1 |
|
Inception-v3 |
90.1 |
96.3 |
92.6 |
89.38 |
94.41 |
68.4 |
|
Proposed CNN |
99.8 |
98.77 |
99.83 |
98.6 |
99.27 |
99.8 |
(a)
(b)
(c)
(d)
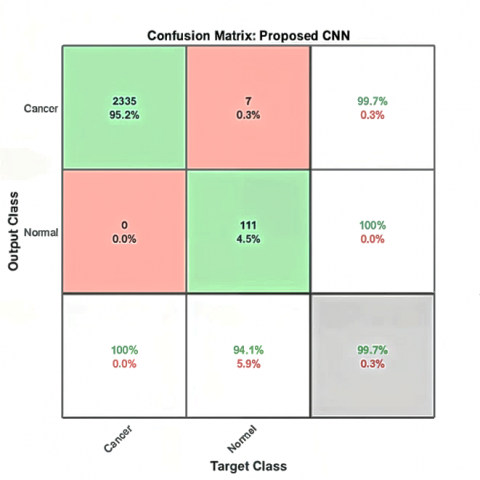
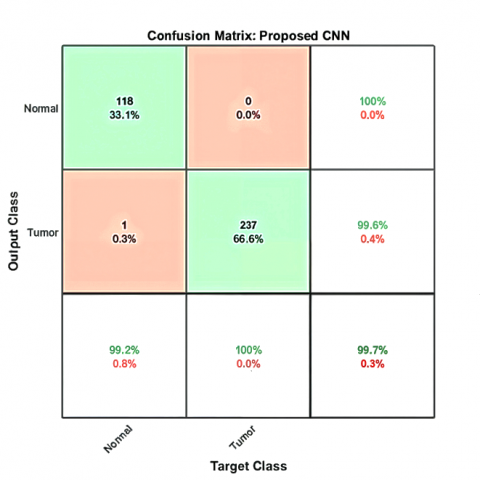
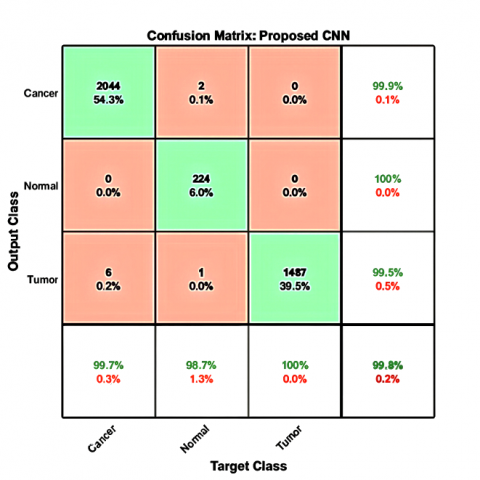
Figure 5. The confusion matrix results of the proposed CNN model on three different benchmark datasets: (a) TCGA-LIHC, (b) 3D-IRCADb-01, (c) LiTS17, and (d) for three benchmark datasets
While the confusion matrices in Figure 5 demonstrate the high classification accuracy of the proposed CNN model, minor misclassifications were still observed—particularly between the tumor and cancer classes. This confusion likely stems from overlapping visual features in CT and MRI images, where both tumor and malignant tissue regions may exhibit similar texture intensities or irregular shapes. Factors like size, shape, enhancement patterns, and internal heterogeneity can be ambiguous. There is another reason, which is data heterogeneity. Some errors may arise from annotation inconsistencies or low-contrast slices, which limit the model’s ability to differentiate subtle boundary variations. To mitigate these issues, future work could focus on refining the labeling process, incorporating additional contrast-enhancement techniques during preprocessing, or leveraging attention mechanisms to guide the model toward discriminative regions. Augmenting the dataset with more diverse samples, especially borderline cases, could further improve class separation and reduce false predictions.
The superior performance of the proposed CNN compared to models like AlexNet, ResNet-50, and Inception-v3, as shown in Table 5, can be attributed to several architectural and dataset-specific factors. AlexNet, while historically significant, employs a relatively shallow architecture with fewer convolutional layers and lacks modern techniques such as batch normalization, making it less effective in extracting intricate spatial and textural patterns from grayscale CT and MRI images. As a result, it fails to generalize well to the complex anatomical variations present in liver images. ResNet-50, on the other hand, is a much deeper network that utilizes residual connections to solve the vanishing gradient problem. However, it is primarily trained on natural RGB images (e.g., ImageNet), and its high parameter count can lead to overfitting when applied to smaller medical datasets. Moreover, residual learning may not significantly improve classification accuracy when the image features are already subtle and homogeneous, as is often the case in liver imaging. Inception-v3 introduces architectural complexity with multi-scale feature extraction, but this comes at the cost of increased computational burden and training time, which may not yield proportional gains in medical image tasks. In contrast, the proposed CNN was designed from the ground up to handle grayscale liver CT and MRI images efficiently. It balances depth and simplicity, leverages carefully selected filter sizes and activation functions, and is trained end-to-end with domain-specific preprocessing. These design choices enable it to learn highly discriminative features with reduced risk of overfitting, leading to its superior performance in both accuracy and generalizability across all evaluated datasets.
Table 5. Performance comparison between the selected models
|
Classifiers |
Dataset |
Accuracy (%) |
Precision (%) |
Recall (%) |
Specificity (%) |
|
GCN [23] |
LiTS17 |
99.1 |
99.4 |
99.4 |
- |
|
FC-CNN [24] |
3D-IRCADb-01 |
99.11 |
98.10 |
- |
- |
|
CNN + EfficientNetV2B3 [25] |
Kaggle |
96.3 |
93.4 |
86.4 |
- |
|
Differential CNN and KELM [26] |
LiTS17, and 3D-IRCADb-01 |
98.72 |
98.52 |
98.24 |
98.4 |
|
UNet70 [27] |
3D-IRCADb-01 |
94.58 |
92.12 |
97.5 |
91.66 |
|
DeeplapV3 + ResNet-50 [28] |
3D-IRCADb-01, and LiTS17 |
99.5 |
86.4 |
97.9 |
- |
A graph convolutional network (GCN)-based framework is proposed in the study [23] for automated liver and tumor segmentation in CT scans. Using the LiTS17 dataset, the model applies four Chebyshev graph convolution layers and a fully connected layer. Preprocessing involved adaptive histogram equalization and anisotropic diffusion filtering. The framework achieved state-of-the-art performance, with 99.1% accuracy, 99.4% sensitivity and precision, and a Dice coefficient of 91.1%, surpassing U-Net and ResNet-based methods in boundary-sensitive segmentation tasks.
A fully connected convolutional neural network (FC-CNN) was introduced in research [24] for the segmentation and classification of hepatic tumors in CT scans, achieving 99.11% accuracy on the 3D-IRCADb-01 dataset with noted computational efficiency. However, the absence of sensitivity and specificity metrics raises concerns regarding its diagnostic reliability. Moreover, the model was evaluated on a single dataset, limiting its generalizability across diverse imaging protocols and patient populations.
The authors in their research study [25] developed a spliced deep learning framework that consists of CNNs and EfficientNetV2B3 for IDC vs. non-IDC classification in WSIs. The model's good performance was attributed to its use of transfer learning and multi-stage preprocessing pipeline. Our best model performed similarly well with 96.3% accuracy, 93.4% precision, 86.4% recall, and an F1-score of 89.7%.
The authors in the study [26] introduced a hybrid model based on a Differential CNN and a KELM classifier for the detection of HB tumor. Evaluated on LiTS17 and 3D-IRCADb-01 datasets, it attained 98.72% accuracy, 98.24% recall, and 98.52% sensitivity. However, the model is computationally expensive with KELM and has a bit inferior specificity to state-of-the-art CNNs, which may cause misdiagnosis of benign anomaly.
The authors in the study [27] proposed the UNet70 model, an enhanced version of the UNet architecture featuring 70 convolutional layers and hybrid residual connections. Designed to address limitations in tumor heterogeneity and small lesion detection, the model processed contrast-enhanced CT and MRI scans. UNet70 achieved 94.58% accuracy, a Dice score of 94.73%, and 97.50% sensitivity on a multi-institutional dataset.
A CNN-based framework was proposed in the study [28] for hepatic malignancy detection, leveraging transfer learning and feature fusion from multiple pretrained models, including ResNet-50 and DenseNet-121. Evaluated on LiTS17 and 3D-IRCADb-01 datasets, the model achieved 99.5% accuracy, with a precision of 0.864 and a recall of 0.979.
In this study, a novel CNN architecture was developed and optimized for the classification of liver cancer and tumor images using CT and MRI data. The model achieved outstanding results across three benchmark datasets (TCGA-LIHC, 3D-IRCADb-01, and LiTS17), recording an accuracy of 99.8%, a recall of 99.83%, and a precision of 99.9%. These results highlight the model’s strong generalization capabilities across diverse imaging modalities. The proposed CNN introduces a task-specific architecture that leverages Hounsfield unit filtering and CLAHE during preprocessing, eliminating the need for manual region selection or complex transfer learning pipelines. This design choice, combined with efficient training (converging in under 17 minutes on a single GPU), demonstrates the model's computational efficiency without compromising accuracy. The novelty of this work lies in its ability to balance performance, simplicity, and adaptability to both CT and MRI data. This makes it a promising candidate for integration into clinical decision support systems, offering potential to improve early detection, reduce diagnostic workload, and support timely treatment planning for liver cancer patients.
|
DICOM |
Digital Imaging and Communications in Medicine |
|
LL |
Approximation (low-pass in both directions) |
|
LH |
Vertical details (low-pass rows, high-pass columns) |
|
HL |
Horizontal details (high-pass rows, low-pass columns) |
|
HH |
Diagonal details (high-pass in both directions) |
|
GPU |
Graphics Processing Unit |
|
RAM |
Random Access Memory |
|
IoU |
Intersection over Union |
|
KELM |
Kernel Extreme Learning Machine |
[1] Goodarzi, E., Ghorat, F., Jarrahi, A.M., Adineh, H., Sohrabivafa, M., Khazaei, Z. (2019). Global incidence and mortality of liver cancers and its relationship with the human development index (HDI): An ecology study in 2018. World Cancer Research Journal, 6(2): e1255.
[2] Moghbel, M., Mashohor, S., Mahmud, R., Saripan, M.I.B. (2018). Review of liver segmentation and computer assisted detection/diagnosis methods in computed tomography. Artificial Intelligence Review, 50(4): 497-537. https://doi.org/10.1007/s10462-017-9550-x
[3] Abed, N.J., Hussein, E.A. (2021). Design and implementation of real time health care monitoring system based on IoT. Journal of Physics: Conference Series, 1818(1): 012044.
[4] Elbashir, M.K., Mahmoud, A., Mostafa, A.M., Hamouda, E., et al. (2023). A transfer learning approach based on ultrasound images for liver cancer detection. Computers, Materials & Continua, 75(3): 5105-5121. https://doi.org/10.32604/cmc.2023.037728
[5] Prakash, N.N., Rajesh, V., Namakhwa, D.L., Pande, S.D., Ahammad, S.H. (2023). A DenseNet CNN-based liver lesion prediction and classification for future medical diagnosis. Scientific African, 20: e01629. https://doi.org/10.1016/j.sciaf.2023.e01629
[6] Ibrahim, M., Mahmoud, M., Albadawy, R.M., Abdulkader, H. (2022). Liver multi-class tumour segmentation and detection based on hyperion pre-trained models. International Journal of Intelligent Engineering & Systems, 15(6): 392-405. https://doi.org/10.22266/ijies2022.1231.36
[7] Manjunath, R.V., Ghanshala, A., Kwadiki, K. (2024). Deep learning algorithm performance evaluation in detection and classification of liver disease using CT images. Multimedia Tools and Applications, 83(1): 2773-2790. https://doi.org/10.1007/s11042-023-15627-z
[8] Whangbo, J., Lee, J., Kim, Y.J., Kim, S.T., Kim, K.G. (2024). Deep learning-based multi-class segmentation of the paranasal sinuses of sinusitis patients based on computed tomographic images. Sensors, 24(6): 1933. https://doi.org/10.3390/s24061933
[9] Hang, T., Fan, D., Sun, T., Chen, Z., Yang, X., Yue, X. (2025). Deep learning and hyperspectral imaging for liver cancer staging and cirrhosis differentiation. Journal of Biophotonics, 18(4): e202400557. https://doi.org/10.1002/jbio.202400557
[10] Stephe, S., Kumar, S.B., Thirumalraj, A., Dzhyvak, V. (2024). Transformer based attention guided network for segmentation and hybrid network for classification of liver tumor from CT scan images. Eastern Ukrainian Medical Journal, 12(3): 692-710. https://doi.org/10.21272/eumj.2024
[11] Kolli, S., Parvathala, B.R., Krishna, A.P. (2024). A novel liver tumor classification using improved probabilistic neural networks with Bayesian optimization. e-Prime-Advances in Electrical Engineering, Electronics and Energy, 8: 100514. https://doi.org/10.1016/j.prime.2024.100514
[12] Bandaru, S.C., Mohan, G.B., Kumar, R.P., Altalbe, A. (2024). SwinGALE: Fusion of swin transformer and attention mechanism for GAN-augmented liver tumor classification with enhanced deep learning. International Journal of Information Technology, 16(8): 5351-5369. https://doi.org/10.1007/s41870-024-02168-3
[13] Napte, K.M., Mahajan, A., Urooj, S. (2023). Automatic liver cancer detection using deep convolution neural network. IEEE Access, 11: 94852-94862. https://doi.org/10.1109/ACCESS.2023.3307640
[14] Ramani, R., Devi, K.V., Thiruselvan, P., Umamaheswari, M. (2024). Classification of liver cancer via deep learning based dilated attention convolutional neural network. International Journal of Data Science and Artificial Intelligence (IJDSAI), 2(4): 128-134.
[15] Khan, R.A., Fu, M., Burbridge, B., Luo, Y., Wu, F.X. (2023). A multi-modal deep neural network for multi-class liver cancer diagnosis. Neural Networks, 165: 553-561. https://doi.org/10.1016/j.neunet.2023.06.013
[16] Midya, A., Chakraborty, J., Srouji, R., Narayan, R.R., et al. (2023). Computerized diagnosis of liver tumors from CT scans using a deep neural network approach. IEEE Journal of Biomedical and Health Informatics, 27(5): 2456-2464. https://doi.org/10.1109/JBHI.2023.3248489
[17] Abed, N.J., Hussein, E.A. (2024). Enhancing thyroid ultrasound image classification with deep transfer learning. In 2024 3rd International Conference on Advances in Engineering Science and Technology (AEST), Babil, Iraq, pp. 25-30. https://doi.org/ 10.1109/AEST63017.2024.10959876
[18] Dataset: https://wiki.cancerimagingarchive.net /collection/tcga-lihc/.
[19] Dataset: https://www.ircad.fr/research/data-sets/liver-segmentation-3d-ircadb-01/.
[20] Dataset: https://competitions.codalab.org/competitions/17094.
[21] Okimoto, N., Yasaka, K., Cho, S., Koshino, S., et al. (2024). New liver window width in detecting hepatocellular carcinoma on dynamic contrast-enhanced computed tomography with deep learning reconstruction. Radiological Physics and Technology, 17(3): 658-665. https://doi.org/10.1007/s12194-024-00817-7
[22] Kim, H.N., Jeon, H.J., Choi, H.G., Kwon, I.S., et al. (2023). CT-based Hounsfield unit values reflect the degree of steatohepatitis in patients with low-grade fatty liver disease. BMC Gastroenterology, 23(1): 77. https://doi.org/10.1186/s12876-023-02717-3
[23] Khoshkhabar, M., Meshgini, S., Afrouzian, R., Danishvar, S. (2023). Automatic liver tumor segmentation from CT images using graph convolutional network. Sensors, 23(17): 7561. https://doi.org/10.3390/s23177561
[24] Vadlamudi, S.H., Sai Souhith Reddy, Y., Ajith Sai Kumar Reddy, P., Periasamy, P., Vali Mohamad, N.M. (2022). Automatic liver tumor segmentation and identification using fully connected convolutional neural network from CT images. Concurrency and Computation: Practice and Experience, 34(24): e7212. https://doi.org/10.1002/cpe.7212
[25] Zarif, S., Abdulkader, H., Elaraby, I., Alharbi, A., Elkilani, W.S., Pławiak, P. (2024). Using hybrid pre-trained models for breast cancer detection. PloS One, 19(1): e0296912. https://doi.org/10.1371/journal.pone.0296912
[26] Jesi, P.M., Daniel, V.A.A. (2024). Differential CNN and KELM integration for accurate liver cancer detection. Biomedical Signal Processing and Control, 95: 106419. https://doi.org/10.1016/j.bspc.2024.106419
[27] Gowda, Y., Manjunath, R.V. (2025). Automatic liver tumor classification using UNet70 a deep learning model. Journal of Liver Transplantation, 18: 100260. https://doi.org/10.1016/j.liver.2025.100260
[28] Othman, E., Mahmoud, M., Dhahri, H., Abdulkader, H., Mahmood, A., Ibrahim, M. (2022). Automatic detection of liver cancer using hybrid pre-trained models. Sensors, 22(14): 5429. https://doi.org/10.3390/s22145429