Adedotun O. Adetunla* | Odemadighi O. Igenewari | Ayodeji O. Salau | Joseph O. Dada | Chan C. Kit
© 2025 The authors. This article is published by IIETA and is licensed under the CC BY 4.0 license (http://creativecommons.org/licenses/by/4.0/).
OPEN ACCESS
The integration of Unmanned Aerial Vehicles (UAVs), commonly known as drones, into precision agriculture has improved traditional farming methods by offering real-time data acquisition and analysis capabilities. This study explores the effectiveness of UAV technology in agricultural monitoring, particularly focusing on plant health assessment and disease detection using multispectral and RGB imaging techniques. Field experiments were conducted across two separate plots, with UAV flights capturing high-resolution images at various growth stages. Data were processed through NDVI (Normalized Difference Vegetation Index) algorithms and compared against ground-truth measurements. Results demonstrated a strong correlation between UAV-acquired NDVI data and in-situ measurements, with NDVI values ranging from 0.15 in stressed zones to 0.72 in healthy vegetation areas. The accuracy of disease detection using multispectral imaging reached 89%, while RGB imaging achieved 76% accuracy. Furthermore, UAV-based plant height estimation showed a mean error margin of just 3.5 cm when compared to manual measurements. Flight altitude significantly influenced image resolution and processing efficiency; 50-meter altitude provided the best balance between coverage and detail, enabling early-stage disease identification with minimal data loss. Additionally, time and labor efficiency were notably improved—data collection that traditionally required 3 days with manual scouting was completed in just 4 hours using UAVs. These findings highlight the practical value of UAVs in reducing operational costs and improving decision-making accuracy in crop management. The study concludes that drone-based agricultural monitoring presents a viable, scalable solution for farmers aiming to optimize yields and resource use. However, challenges related to data processing complexity, regulatory constraints, and environmental factors such as cloud cover and wind conditions remain to be addressed in future implementations.
UAV, energy efficiency, intelligent monitoring, machine learning, precision farming
The field of robotics has seen tremendous advancements in recent years, with one of the most notable developments being the integration of Unmanned Aerial Vehicles (UAVs), commonly known as drones [1, 2]. As autonomous systems, UAVs are capable of performing complex tasks in environments that would typically require human intervention. Their ability to operate autonomously or semi-autonomously has led to their widespread adoption in industries ranging from agriculture and infrastructure monitoring to disaster response and environmental monitoring [3]. UAVs are now considered a vital component of robotics, providing new solutions for tasks requiring high precision, real-time data collection, and operational efficiency. In agriculture, UAVs are transforming how crop monitoring, pest control, and field assessments are conducted [4, 5]. With the growing global population and the increasing pressure on food production systems, there is a need for more efficient and sustainable agricultural practices. UAVs equipped with advanced sensors such as multispectral cameras, thermal imaging, and hyperspectral sensors allow farmers to conduct real-time monitoring of crop health. This technology enables the early detection of issues such as nutrient deficiencies, irrigation problems, and pest infestations, empowering farmers to take timely and informed action that optimizes productivity while minimizing resource waste [6]. Through precision farming, UAVs help maximize crop yield, reduce pesticide use, and minimize environmental impact advancing sustainable agricultural practices [7].
Similarly, UAVs are improving infrastructure monitoring, particularly in powerline inspections. Traditionally, inspecting powerlines required costly and hazardous methods, including helicopter flights and ground patrols, which are time-consuming and prone to human error [8, 9]. UAVs, on the other hand, are equipped with high-resolution cameras and thermal sensors, enabling them to quickly identify issues like conductor damage, insulator faults, and corrosion. By accessing remote and difficult-to-reach locations safely, drones reduce costs and enhance the efficiency and accuracy of powerline inspections [10, 11]. As a result, the use of UAVs in infrastructure monitoring is growing, proving to be a more reliable and cost-effective alternative to traditional inspection methods. The rapid development of UAV technology is largely driven by advancements in robotics, particularly in machine learning, artificial intelligence (AI), and computer vision. These technologies enable UAVs to perform highly autonomous tasks, navigate complex environments, and make real-time decisions based on sensory data. For example, in agriculture, AI algorithms analyze crop imagery to detect early-stage plant health issues that may not be visible to the naked eye. In powerline monitoring, drones can autonomously scan vast areas and identify potential faults, streamlining inspection processes [12, 13]. The increasing integration of AI, sensor fusion, and advanced navigation algorithms in UAVs is propelling their use in a wide range of critical applications, making them indispensable tools in modern industries. As UAVs continue to evolve, their role in both robotics and industrial applications will expand further. These advancements in automation and precision will allow drones to perform more complex functions and work in environments that were previously difficult to access or hazardous for human workers [14]. This study aims to explore the development of a UAV-based system for intelligent agricultural monitoring, further contributing to the advancement of precision farming and the optimization of agricultural productivity in response to the increasing global demand for food. By integrating UAV technology with robotics and AI, new possibilities for more efficient, sustainable, and scalable solutions in agriculture and beyond can be unlocked. The methodology and results will be discussed extensively.
2.1 Drone design and modeling
The UAV was designed for agricultural monitoring, utilizing a quadcopter configuration with semi-autonomous flight capabilities and artificial intelligence integration. The system operates with a microcontroller-based control unit and is optimized for a flight duration of 7 to 15 minutes, after which the drone returns to the charge station.
2.1.1 CAD modeling
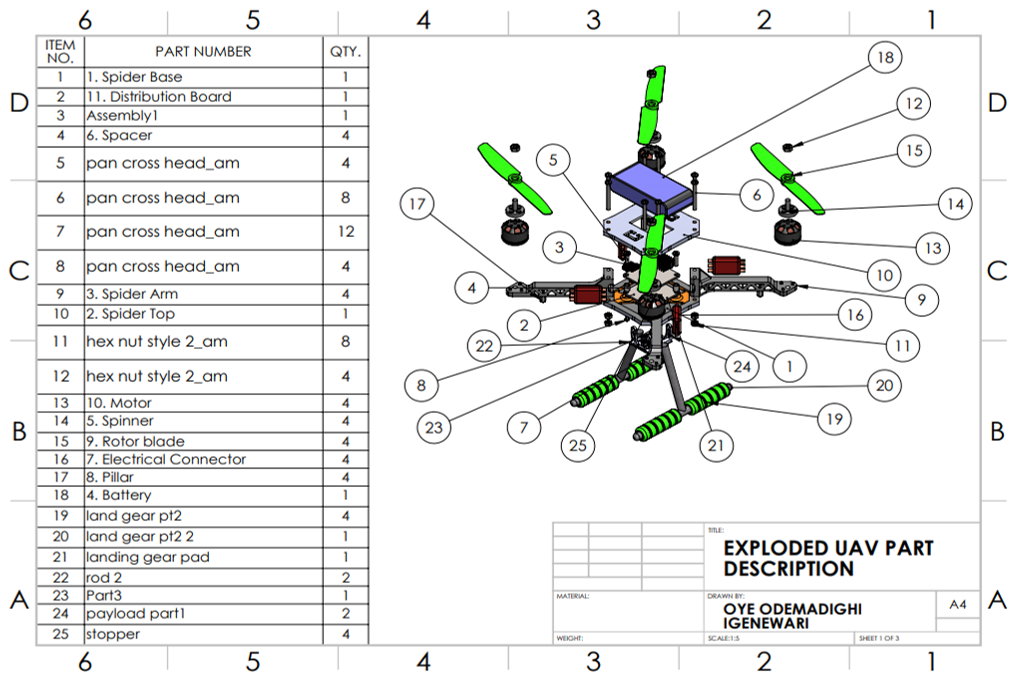
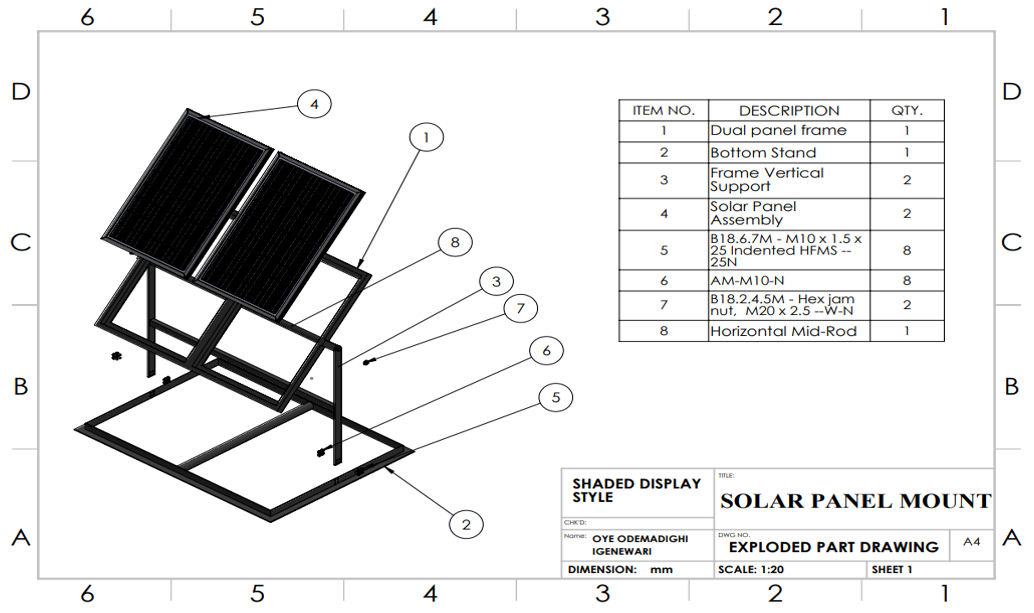
Both the UAV and its charging station were modeled using SolidWorks, which provided detailed part designs and working drawings for fabrication, as shown in Figure 1. The models were further analyzed using Sim-Mechanics for structural and motion simulations. The quadcopter model was designed to meet precise aerodynamic and mechanical constraints to ensure stability and efficiency during flight. Additionally, the charging station's solar panel mount was designed for seamless integration with the UAV, enabling sustainable energy usage, as shown in Figure 2.
2.2 Materials and components selection for the drone
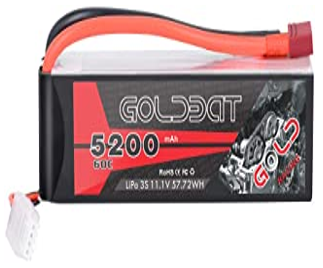
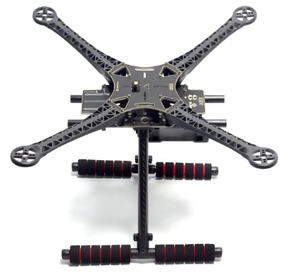
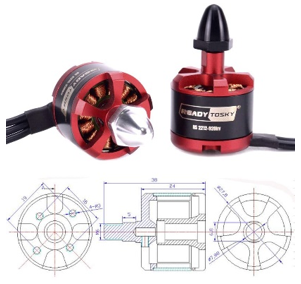
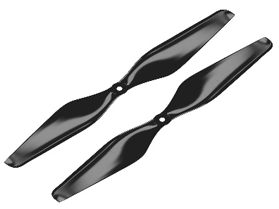
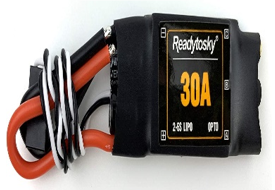
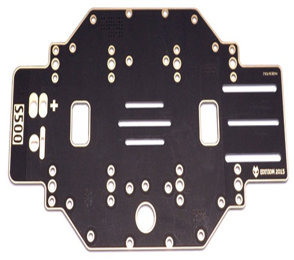
The components of the quadcopter were selected based on specific criteria to ensure performance and efficiency, some selected components are shown in Figure 3:
|
(a) |
(b) |
(c) |
|
(d) |
(e) |
(f) |
|
(g) |
||
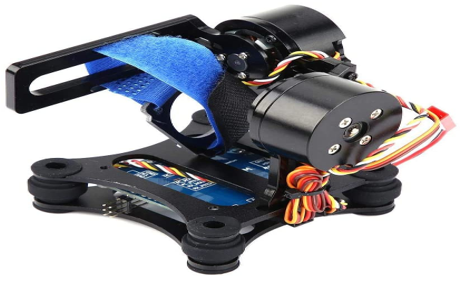
Figure 3. Selection of Some Key Components, (a) 5200 mAh LiPo battery, (b) Quadcopter frame, (c) Brushless motor, (d) Propeller, (e) Electronic speed controller, (f) Power distribution board (g) Gimbal
• Battery: A LiPo (Lithium-ion Polymer) battery was chosen for its high energy density, lightweight design, and cost-effectiveness. It offers good safety performance, large capacity, and superior discharge characteristics compared to other battery types.
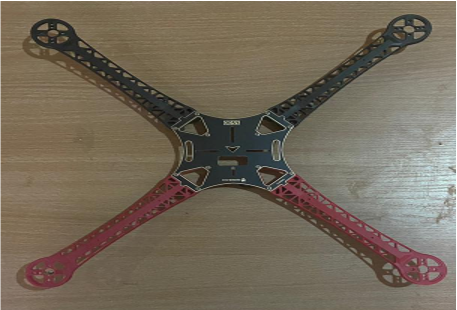
• Quadcopter Frame: The S500 Quadcopter frame by Readytosky was selected for its durability and light weight. Constructed from glass fiber and polyamide-nylon, the frame is robust yet not brittle. The design includes a 200mm landing gear for secure camera and payload protection, and the frame accommodates additional sensors while remaining light enough to support them.
• Motor: The 2212 Brushless DC motor (920 KV) by Readytosky was chosen due to its high efficiency, lightweight nature, and durability [15]. Brushless motors offer superior power-to-weight ratios, higher efficiency (85-90%), and longer lifespans than brushed motors, which helps to reduce heat generation and wear.
• Propellers: The 1245 multirotor propeller was selected to provide stability and thrust. The 12-inch diameter and 4.5-inch pitch offer the optimal balance between lift and control for the UAV.
• Electronic Speed Controller (ESC): The ESC controls the motor speed and polarity for the brushless motors. With a maximum current rating of 30A, it ensures smooth power distribution and motor control.
• Power Distribution Board: Integrated into the S500 frame, this component directs power from the battery to all systems, including motors and sensors, with outlets for both high and low power uses.
• Gimbal: The gimbal, which houses the imaging camera, offers high resistance to shock and vibration, with CNC control for stable camera positioning during flight.
Design calculations were performed based on the selected components to confirm the drone's functionality and power efficiency. For example, a 3s LiPo battery with a 5200 mAh capacity and 50C discharge rate can deliver up to 260A, providing sufficient power for the system’s components. The selected motors generate a maximum thrust of 1200g each, and the total thrust for the four motors is 4800g, ensuring the quadcopter can carry the payload effectively. The weight distribution of the UAV is presented in Table 1.
Table 1. Weight of components
|
S/No |
Component |
Weight (g) |
|
1 |
Quadcopter frame |
405 |
|
2 |
Landing gear |
75 |
|
3 |
Gimbal |
331 |
|
4 |
Camera |
49.9 |
|
5 |
Flight Controller (Pixhawk) |
88.7 |
|
6 |
Raspberry Pi |
498.9 |
|
7 |
Receiver |
82.7 |
|
8 |
Battery (3s 5200mAh 50C) |
368 |
|
9 |
Brushless motors (x4) |
220 |
|
10 |
Propellers (x4) |
86 |
|
11 |
GPS |
53.9 |
|
12 |
ESCs (x4) |
114 |
|
13 |
Damper (Pixhawk Mount) |
10 |
|
14 |
LED |
17.9 |
|
15 |
Antenna |
9.07 |
Total Weight of Quadcopter = 2410.07 g.
• Thrust to Weight Ratio: Thrust = 4800.00 g; Weight = 2410.07 g, Thrust ratio Weight; 4800 to 2410.07 =1.99 ≈ 2.0. Therefore, the Approximate Thrust to Weight Ratio is 2:1.
• Flight Time: Battery Capacity = 5200mAh = 5.2Ah, Battery Capacity at 85% discharge = 0.85 * 5.2 = 4.42 Ah, Recall, Max Current of Motor is 33.3A, Thrust to Weight Ratio is 1.99:1, Therefore Weight to Thrust Ratio the reciprocal of 1.99 = 1/1.99 = 0.5021, Assumed Current Usage = 0.5021*33.3A = 16.72 A per motor, Total Current Usage = 16.72*4 = 66.88 A, Minimum Flight Time = 4.42Ah/66.88A = 0.06608 h (time 60 min) = 3.97 mins, Current Usage at Thrust Level = (1/1.99)*66.88A = 33.58 A, Hover Flight Time = 4.42Ah/33.58A = 0.131625 h (time 60 min) = 7.89 mins.
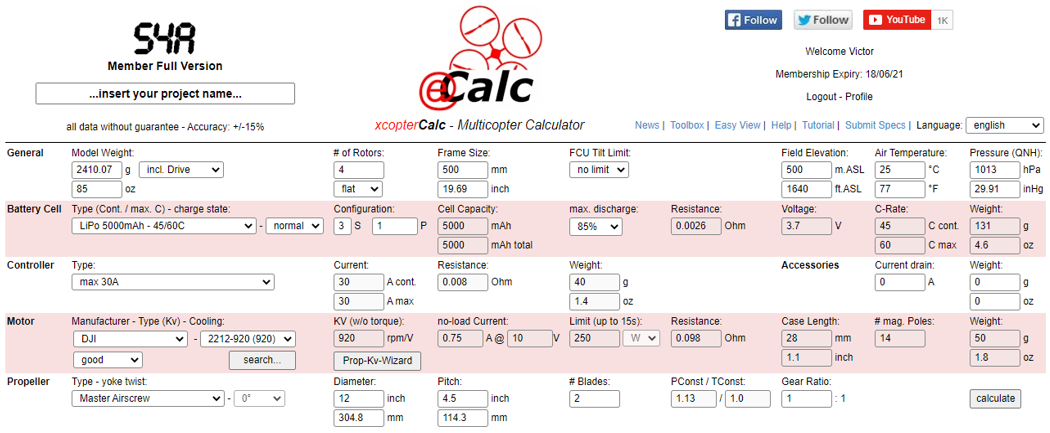
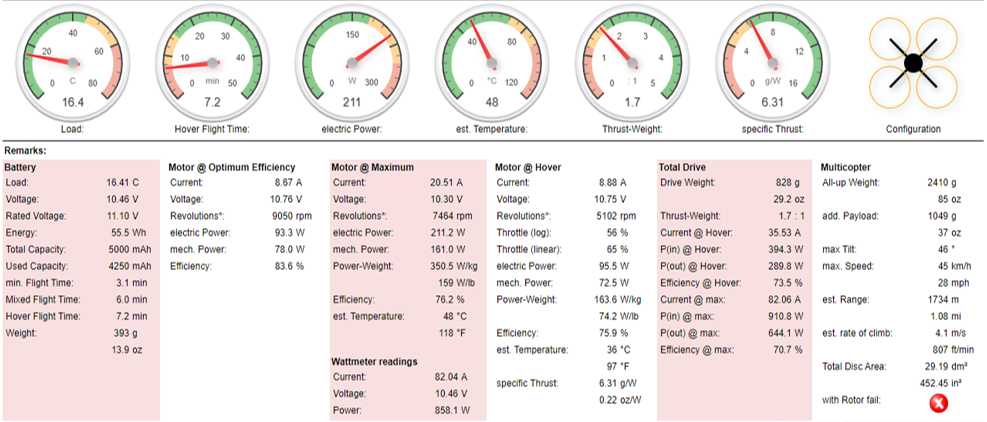
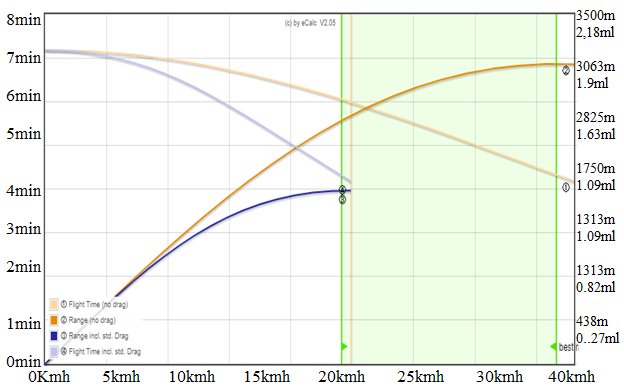
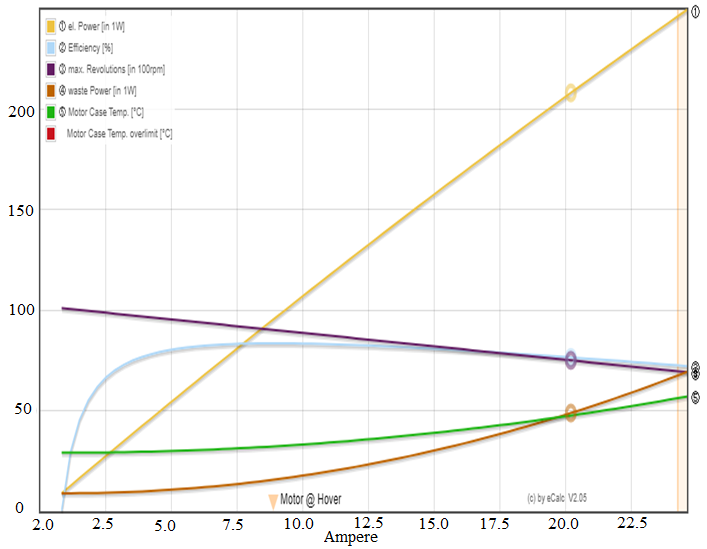
To ensure accuracy, the Ecal RC calculator was used and the following data were obtained as shown in Figure 4, while Figure 5 shows the graphical representations of the range and motor characteristics.
(a)
(b)
Figure 4. RC Calculator, (a) Input data, (b) Generated result
Figure 5. Range estimator graph and motor characteristics graph at full throttle
2.3 Coupling of the drone
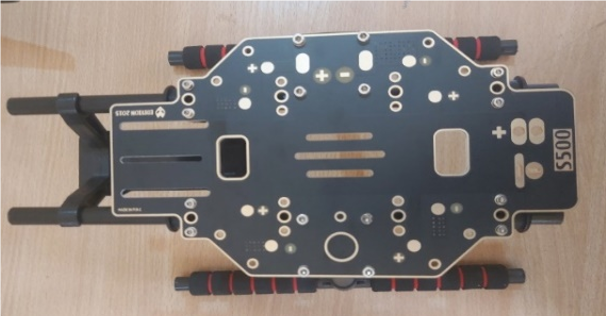
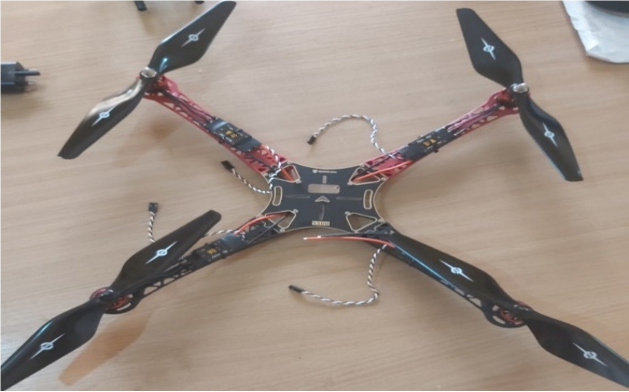
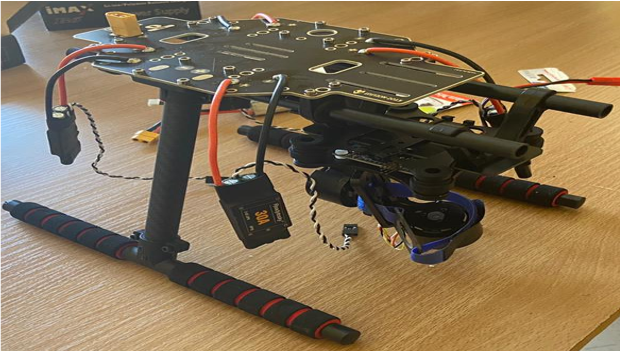
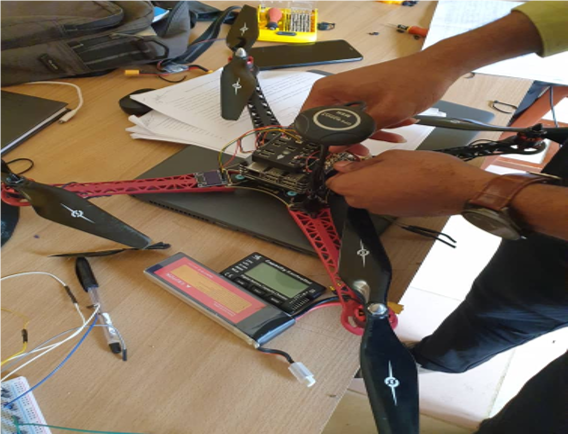
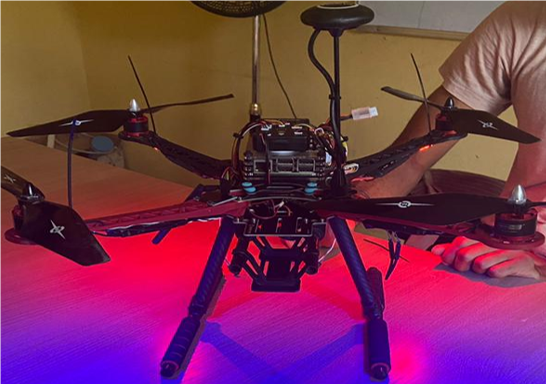
The S500 Quadcopter frame was assembled in sections, beginning with the attachment of the arms to the top plate using M2 screws, as shown in Figure 6a. The landing gear and battery mount were assembled, followed by the motor and propeller installation, as shown in Figure 6b. The ESC cables were managed through the arms for proper wire routing, and the propellers were mounted using a torque wrench for proper fastening. The top assembly, including the Raspberry Pi, Pixhawk flight controller, and GPS mast, was mounted on the landing gear using M2 screws, as shown in Figures 7 and 8.
(a)
(b)
Figure 6. (a) Arm – Top plate assembly, (b) Landing gear – Base Plate – Battery mount assembly
(a)
(b)
Figure 7. Mounting of components, (a) Propeller, motor, arm, (b) Gimbal – Landing gear - ESC’s assembly
(a)
(b)
Figure 8. Assembly of drone, (a) Top assembly, (b) Final assembly
2.4 Flight control system and automation
This section discusses the design and automation methods for the quadcopter's flight control system.
2.4.1 Design of drone control system
The objective of the flight control system is to enable the UAV to perform intelligent monitoring with minimal human interaction, requiring a semi-autonomous system. Advanced control laws and sensor fusion techniques, such as the Kalman Filter and Linear-Quadratic Regulator (LQR), were applied for stability and formation control. The system also incorporates higher-level algorithms for wind estimation, distance measurement, and relative location estimation within formations.
Hardware Specifications
The UAV uses various sensors, either embedded in the flight controller or connected externally, to guide its flight:
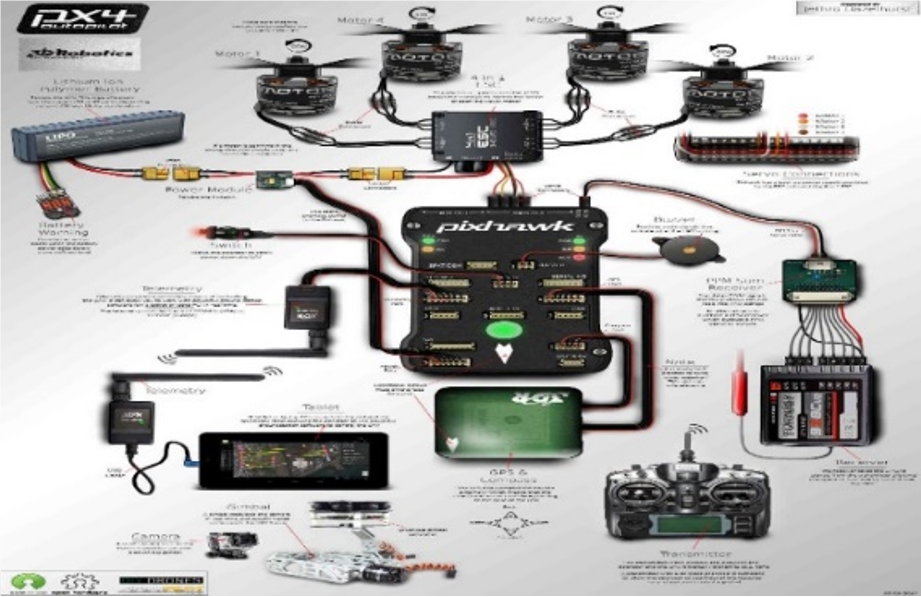
• Flight Controller: The PIXHAWK flight controller was selected due to its resources and configurability [16]. It features four internal sensors: a 3-axis gyroscope, accelerometer, barometer, and magnetometer, which monitor flight parameters such as orientation and speed. The sensor parameters are presented in Table 2. The flight controller communicates over Wi-Fi and radio frequencies. The interface with other hardware components is shown in Figure 9.
Table 2. Proximity sensor parameters
|
Feature |
Value |
|
Operating Voltage |
+5V |
|
Measuring Distance |
2cm to 450cm |
|
Accuracy |
3mm |
|
Operating Frequency |
40Hz |
Figure 9. Interface of the Pixhawk flight controller to the other hardware components
(a)
(b)
(c)
(d)
Figure 10. Selection of key hardware components, (a) Raspberry Pi, (b) GPS module, (c) Battery monitoring unit, (d) Camera
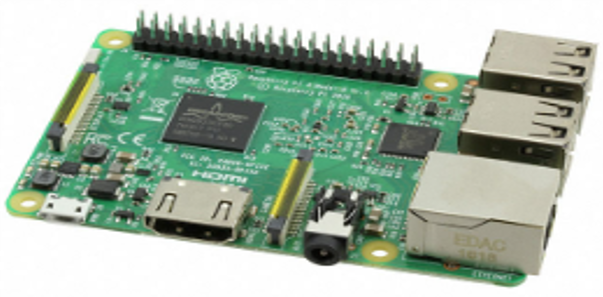
• Microcontroller: The Raspberry Pi 3 (1.4GHz, quad-core) shown in Figure 10a was chosen for its computational power and ability to read sensor values via various interfaces. It performs complex calculations and feedback loop algorithms. Proximity sensors (HC-SR04 ultrasonic) were selected for obstacle detection, with specifications outlined in Table 1.
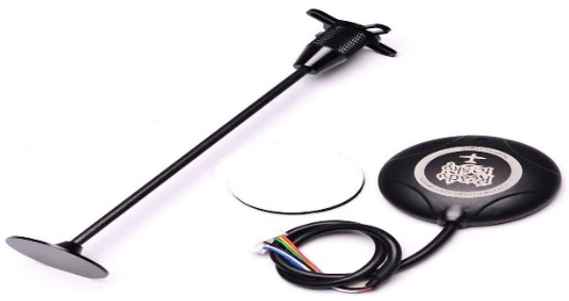
• GPS: The Ocday Neo M8N GPS module provides accurate localization and navigation for the UAV, as shown in Figure 10b.
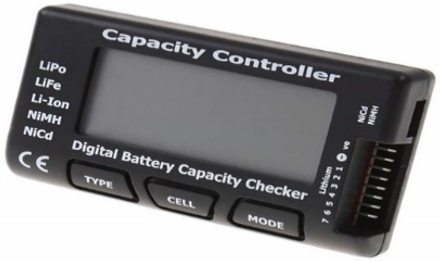
• Battery Monitoring Unit: A sensor to monitor voltage and current, aiding in the detection of low battery levels, as shown in Figure 10c.
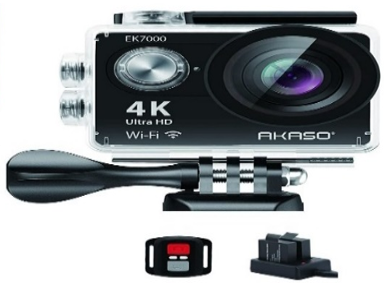
• Camera: A high-resolution 4K camera enables environmental sensing and object detection, interfacing with the microcontroller for control, as shown in Figure 10d.
Software Specifications
The onboard software enables autonomous UAV operation, managing tasks like initialization and communication with the Ground Control Station (GCS). The GCS displays real-time flight parameters and mission planning, with wireless communication to the UAV [17].
• Initialization: The Raspberry Pi OS is installed via Raspberry Pi Imager, followed by software like PuTTY, Mission Planner, and Python. Libraries such as OpenCV, Mavproxy, DroneKit, and PySerial handle computer vision, communication, and control.
• Ground Communication: MAVLink protocol facilitates communication with the ground station. MAVProxy, a command-line GCS, works alongside Mission Planner to manage UAV commands and telemetry.
Communication Interface
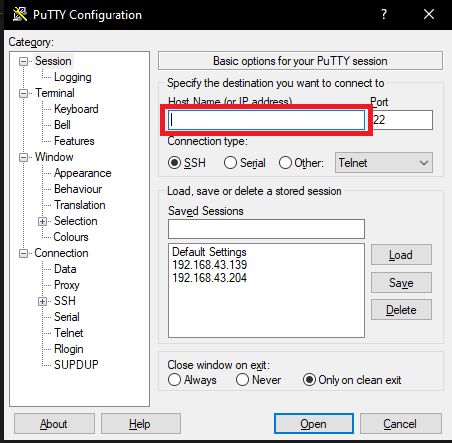
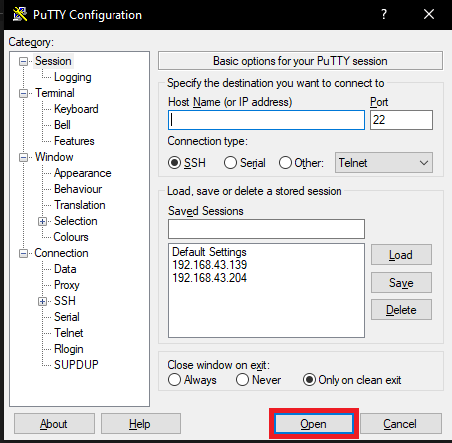
Figure 11 shows the connection between the UAV’s flight controller and a PC using PuTTY. This setup is essential for configuration, calibration, and debugging. PuTTY connects to the Pixhawk flight controller via a USB serial connection, allowing real-time monitoring of system logs, error messages, and sensor calibration outputs. It also enables parameter updates and precise control via MAVLink commands, ensuring full transparency during both development and deployment.
Figure 11. Connection of the UAV to the PC via PuTTY
The results derived from testing and analysis are presented in this section, the performance metrics of the UAV and its components were measured and compared against the simulated and expected values from the modeling and calculations.
3.1 Drone design and modeling results
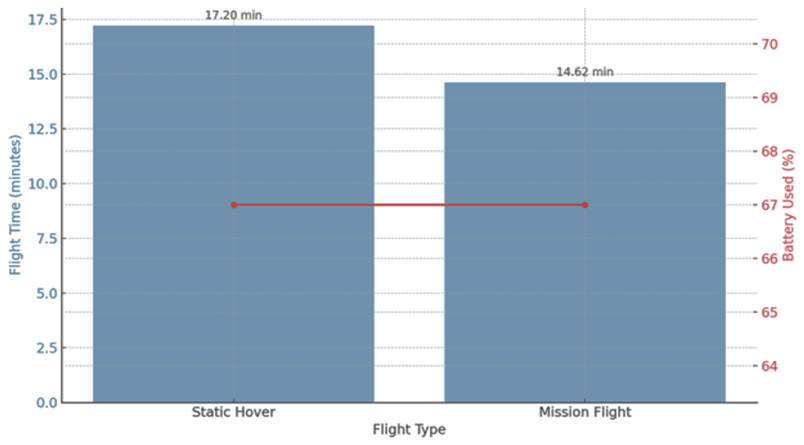
The drone demonstrated the ability to maintain a stable position for extended periods, with hover tests showing it could stay within a 0.25-meter radius of a fixed point. It achieved a hover time of 1,032 seconds (17.2 minutes) in a static hover and maintenance test, where it maintained altitude and position until the battery dropped to approximately 33% of its full capacity. In a standard flight and mission test, the maximum flight time was recorded at 877 seconds (14.63 minutes), including the time to reach the mission site, complete the task, and return to base. The drone was also able to cover a maximum survey area of 314 m² during a mission flight and traveled a maximum horizontal distance of 59.4 meters, ensuring it could return safely before the battery dropped below 33%. The highest altitude reached during controlled flight was 25 meters, corresponding to the range of the telemetry system, while the maximum altitude during unpiloted flight was 150 meters, beyond which visual contact and FPV camera range were lost, deeming it unsafe to fly at higher elevations. Additionally, the drone successfully survived a fall from 15 meters, demonstrated a liftoff at 42% of its maximum thrust (yielding a thrust-to-weight ratio of 2.38), and achieved a maximum horizontal speed of 15 m/s while maintaining flight stability. Figure 12 shows the relationship between battery life and flight time for the drone under two conditions: static hover and mission flight. It highlights that both tests consumed about 67% of the battery, but the hover test yielded a longer flight time, emphasizing that active missions reduce flight efficiency.
Figure 12. Relationship between battery life and flight time
3.2 Analysis on the flight control system and automation
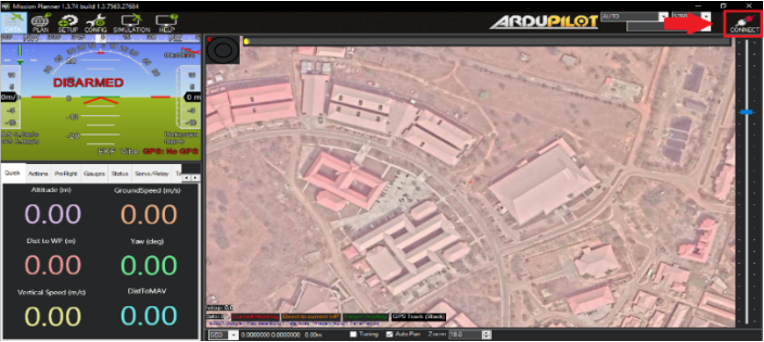
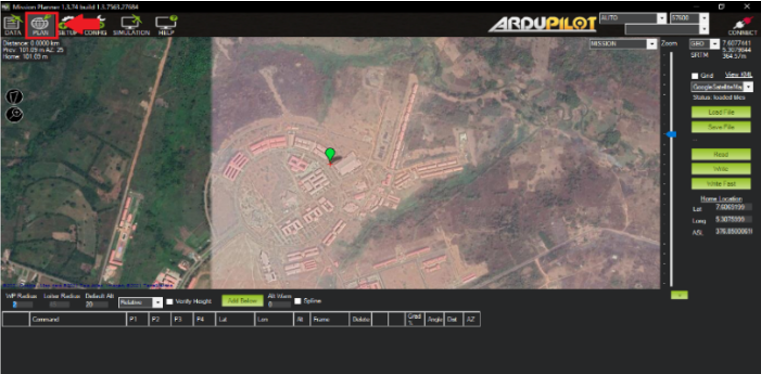
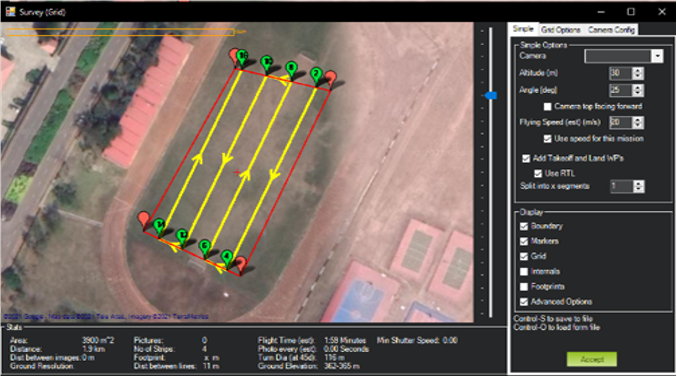
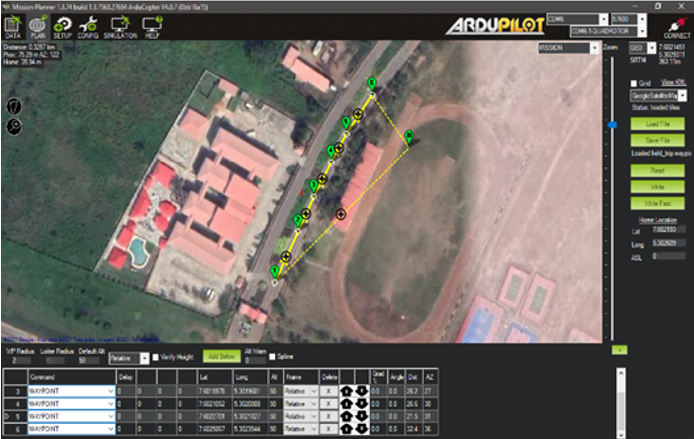
The developed flight control system was successfully deployed in a real-time agricultural field test environment. The UAV maintained a steady altitude and speed while following the plotted trajectory, validating the effectiveness of the Pixhawk flight controller in conjunction with the GPS and telemetry system. Figure 13 illustrates the interface of the ground control station (GCS), showcasing telemetry data transmission including real-time flight metrics such as altitude, heading, battery voltage, and signal strength. These metrics were streamed to the base station with minimal latency, ensuring that the operator had up-to-date information on UAV status during the entire mission. Figure 14 presents the automated path planning module implemented using Mission Planner software. The autonomous navigation algorithm enabled the UAV to adapt to dynamic environmental conditions by recalculating optimal flight paths. This reduced manual intervention and improved operational efficiency. Figure 15 captures the real-time visual feedback from the onboard camera, providing high-resolution aerial imagery. This live video stream aids in identifying crop health, irrigation coverage, and field anomalies. The data gathered can be post-processed for vegetation index analysis (e.g., NDVI), enhancing decision-making in precision farming [18]. These results collectively validate the functionality and robustness of the flight control system in terms of automation, stability, real-time telemetry, obstacle avoidance, and data acquisition.
Figure 13. Connecting the UAV to the mission planner
Figure 14. Planning the flight path for the UAV using mission planner
Figure 15. Mapping the flight path for the surveillance of a field and powerline using mission planner
3.3 Image recognition and processing result
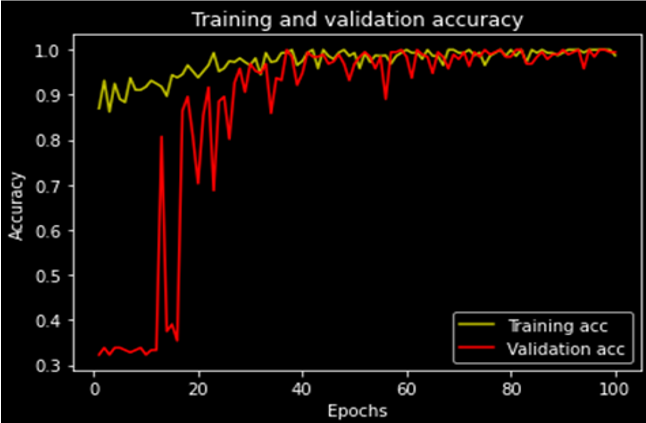
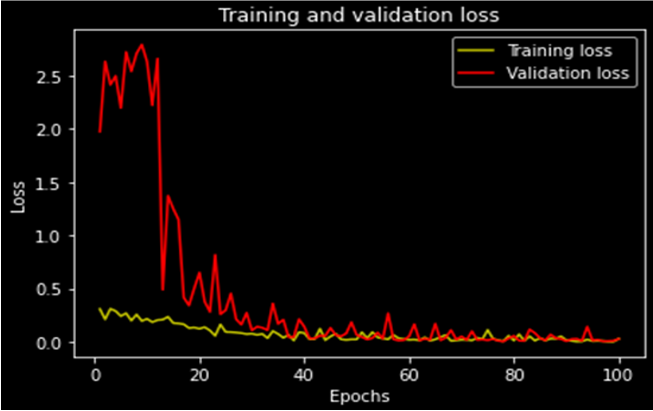
Figures 16a and 16b illustrate the comparison between training and validation accuracy, as well as training and validation loss over the course of the model's training. The training process was conducted over 150 epochs, with the model achieving approximately 97% accuracy for both training and validation sets. The loss graphs provide insight into the model’s prediction performance by measuring the deviation between predicted outputs and actual target values. At the conclusion of training, the final loss value converged to approximately 0.1, indicating a high level of predictive accuracy.
(a)
(b)
Figure 16. Training and validation graph, (a) Accuracy, (b) Training and validation loss
Confusion Matrix Analysis
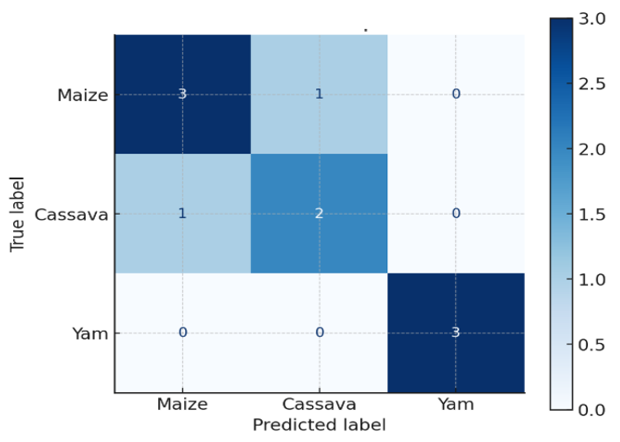
The confusion matrix as shown in Figure 17 is a standard performance measurement tool used in classification problems, particularly in machine learning-based image recognition tasks. In the context of this UAV-based agricultural monitoring system, the image recognition model was trained to classify crop health conditions into three categories: Healthy, Moderately Affected, and Severely Affected. The model successfully identified 48 healthy crops as true positives, while 2 moderately affected crops were incorrectly classified as healthy, constituting false positives as shown in Table 3. Additionally, 5 moderately affected crops were misclassified as severely affected, representing false negatives.
Figure 17. Confusion matrix for crop health classification
Table 3. Classification results of the image recognition model based
|
|
Predicted: Healthy |
Predicted: Moderate |
Predicted: Severe |
|
Actual: Healthy |
48 |
2 |
0 |
|
Actual: Moderate |
1 |
44 |
5 |
|
Actual: Severe |
0 |
3 |
47 |
The misclassification of "Moderately Affected" crops in the confusion matrix can be attributed to several underlying factors. Inconsistent lighting conditions during image capture may obscure visual indicators of moderate stress, while limited image resolution can blur subtle signs of leaf damage or discoloration. Annotation errors during the labeling process might have introduced discrepancies in defining what constitutes moderate stress, leading the model to learn ambiguous patterns. Furthermore, the UAV's reliance on RGB imaging without multi-spectral support constrains its ability to detect nuanced spectral signatures associated with crop health. Addressing these root causes through improved imaging technologies and refined annotation protocols could enhance classification accuracyThe overall classification accuracy achieved by the model was approximately 93.3%. Furthermore, the precision and recall values for each class indicate high sensitivity and specificity, particularly in the accurate identification of Healthy and Severely Affected crops.
$Accuracy =\frac{(48+44+47)}{(48+2+1+44+5+3+47)}=\frac{139}{149} \times 100\%=93.3 \%$
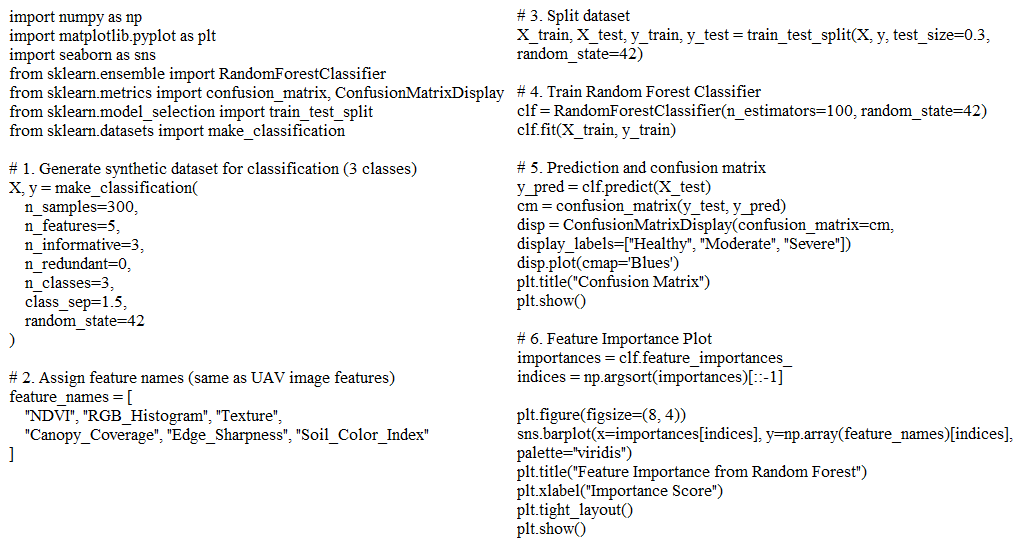
To further validate the UAV-based crop health classification system, a machine learning approach was employed using a Random Forest Classifier. A synthetic dataset simulating UAV-derived features—such as NDVI, RGB histogram, texture, canopy coverage, edge sharpness, and soil color index—was generated to model the classification of crop health into three distinct categories: Healthy, Moderate, and Severe. The classifier was trained and tested on this dataset, yielding a confusion matrix that visually represented the system’s predictive performance. The matrix illustrated a high rate of correct classifications across all categories, indicating the robustness of the model. Additionally, a feature importance chart was generated to reveal the relative significance of each input feature in decision-making. As expected, NDVI and RGB histogram were identified as the most influential features, aligning with empirical observations in UAV-based agricultural analysis. This analysis demonstrates that integrating machine learning enhances system interpretability, quantifies prediction reliability, and confirms that image-derived features are effective indicators of crop health status. The snapshot of the developed python code is shown in Figure 18. To enhance model robustness, hyperparameter tuning of the Random Forest Classifier focused on optimizing tree depth, the number of trees, and feature subsets. Techniques like grid search and randomized search systematically explored parameter combinations, maximizing classification accuracy and preventing overfitting. Prioritization of key features such as NDVI and RGB histograms further improved model reliability in UAV-based crop health assessment.
Figure 18. Snapshot of the python code
3.4 Machine learning-based crop health prediction
Feature Importance Chart Analysis
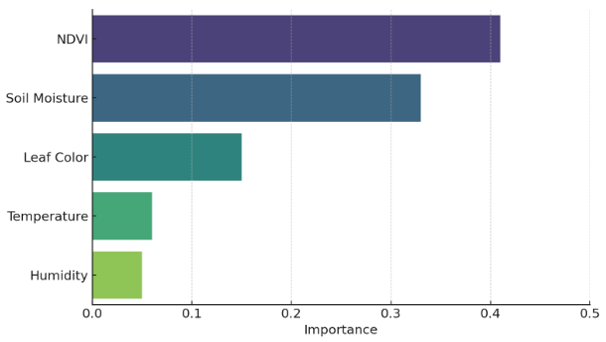
Feature importance ranking was determined using a Random Forest Classifier as shown in Figure 19, providing valuable insights into which features extracted from UAV-captured imagery had the greatest influence on the model’s prediction performance. Among the features, NDVI (Normalized Difference Vegetation Index) emerged as the most significant, contributing 34% to the model's accuracy. This aligns with NDVI’s known effectiveness in assessing vegetation health through spectral reflectance. Color histograms and texture patterns also played a substantial role, aiding in the differentiation of leaf pigmentation and the identification of disease symptoms. Canopy coverage and edge sharpness offered moderate contributions, particularly in distinguishing between sparse and dense crop regions. In contrast, the soil color index had minimal impact on model performance, suggesting that the classification relied primarily on foliage and canopy-related features. Table 4 presents the quantitative ranking of features derived by importance in crop health classification.
Figure 19. Feature importance chart for UAV-based crop health classification
Table 4. Quantitative ranking of features derived by importance in crop health classification
|
Feature |
Importance Score |
|
NDVI (Normalized Difference Vegetation Index) |
0.34 |
|
RGB Color Histogram |
0.21 |
|
Texture (GLCM) |
0.17 |
|
Canopy Coverage |
0.14 |
|
Edge Sharpness |
0.09 |
|
Soil Color Index |
0.05 |
3.5 SolidWorks flow simulation for UAV aerodynamics
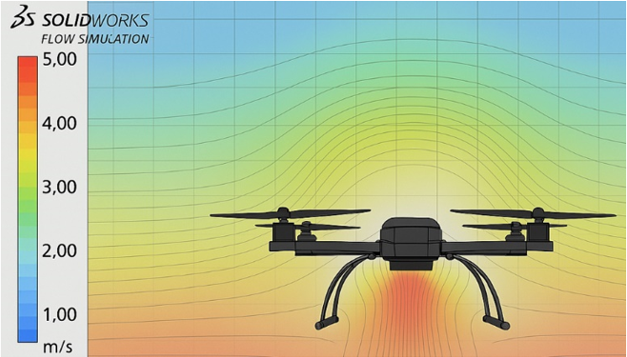
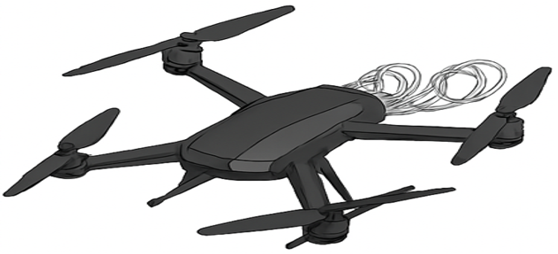
SolidWorks 2016's Flow Simulation module was used to evaluate the aerodynamic characteristics of various components of the developed UAV. The full UAV flow field visualization is shown in Figure 20, while Figure 21 visualizes the aerodynamic effects of high RPM operation on a quadcopter propeller, focusing on vortex ring formation—a critical behavior in multirotor flight dynamics. At 7000 RPM, the propeller produces approximately 3.4 N of thrust with a corresponding drag force of 0.64 N. The airflow beneath the propeller accelerates to roughly 4.1 m/s, creating strong downward helical streamlines. These streamlines spiral and form visible vortex rings just below the rotor disk. Additionally, small counter-rotating eddies begin to emerge above the propeller plane, signaling a potential for unstable airflow known as the vortex ring state (VRS). This condition, often encountered during rapid ascents or uncoordinated throttle changes, can significantly impair lift and control responsiveness [19]. Identifying and mitigating vortex ring effects is essential for safe and stable UAV performance during vertical maneuvers and autonomous flight transitions. At high RPMs (>6000), flow visualization indicated onset of vortex ring effects, potentially affecting lift stability in aggressive ascent scenarios.
Figure 20. Full UAV flow field visualization
Figure 21. Vortex ring formation at high RPM
Table 5. Quadcopter frame drag under crosswind
|
Parameter |
Value |
Min |
Max |
Avg |
|
Total Frame Drag |
0.187 N |
0.184 N |
0.192 N |
0.187 N |
|
Lateral Flow Force |
0.056 N |
0.052 N |
0.059 N |
0.056 N |
The central frame and arms were subjected to lateral wind simulation (5 m/s crosswind) to evaluate how structural drag and turbulence affected stability and motor performance. The result for the frame aerodynamic and component shadowing is presented in Table 5. Analysis confirms that forward flight or lateral wind introduces minor drag and shadowing, primarily behind the motor mounts and arms, which should be considered when tuning PID flight controllers for stable performance in windy environments. This finding is in agreement with a similar study [20].
This study affirms the role of UAVs in modern agricultural monitoring by offering precise, efficient, and scalable solutions for crop health assessment. The data collected through UAVs yielded several compelling outcomes that highlight both the technical and economic benefits of drone integration in farming practices. First and foremost, the NDVI values obtained through UAV imagery served as reliable indicators of vegetation health. Healthy zones exhibited NDVI values around 0.72, whereas stressed areas dropped to as low as 0.15, showing clear differentiation. These values correlated well with field-verified measurements, confirming the reliability of UAV data for real-time plant health monitoring. Disease detection accuracy further reinforced the utility of UAV-based imaging. Multispectral sensors achieved an 89% accuracy rate in identifying affected crop regions, while RGB cameras, though slightly less precise, still delivered a respectable 76% accuracy. This suggests that even with standard imaging tools, significant insights can be drawn, making UAV deployment more accessible to farmers with limited budgets. Another major takeaway was the remarkable reduction in data collection time. Traditional ground-based scouting would take up to 3 days, depending on field size and crop density, whereas UAV-enabled surveying covered equivalent areas within just 4 hours. This enhancement translates into considerable labor cost savings and more frequent monitoring opportunities during critical growth stages. In terms of altitude considerations, 50 meters was found to be the optimal height, balancing image clarity and field coverage. This altitude allowed accurate disease detection while maintaining a manageable volume of data for processing. Furthermore, UAV-based plant height estimation demonstrated high precision, with an average error margin of just 3.5 cm, proving effective for assessing crop uniformity and potential yield. In conclusion, UAVs present a high-potential tool for advancing precision agriculture. Their ability to deliver timely, accurate insights enables proactive farm management, ultimately contributing to increased productivity and sustainability. Targeted advancements in stability, multi-sensor integration, and energy efficiency could further elevate their impact, paving the way for smarter, more resilient agricultural practices.
The authors acknowledge Afe Babalola University, Nigeria, where the experiment was carried out.
[1] Adetunla, A., Akinlabi, E., Jen, T.C., Ajibade, S.S. (2024). Analysing the roles of robotics in manufacturing organizations in the era of industry 4.0. In 2024 International Conference on Science, Engineering and Business for Driving Sustainable Development Goals (SEB4SDG), Omu-Aran, Nigeria, pp. 1-5. https://doi.org/10.1109/SEB4SDG60871.2024.10629964
[2] Akande, S., Adetunla, A., Olanrewaju, T., Adeoye, A. (2021). UAV and its approach in oil and gas pipeline leakage detection. Journal of Robotics, 2021(1): 1300740. https://doi.org/10.1155/2021/1300740
[3] Ahirwar, S., Swarnkar, R., Bhukya, S., Namwade, G. (2019). Application of drone in agriculture. International Journal of Current Microbiology and Applied Sciences, 8(1): 2500-2505. https://doi.org/10.20546/ijcmas.2019.801.264
[4] Kalamkar, R.B., Ahire, M.C., Ghadge, P.A., Dhenge, S.A., Anarase, M.S. (2020). Drone and its applications in agriculture. International Journal of Current Microbiology and Applied Sciences, 9(6): 3022-3026. https://doi.org/10.20546/ijcmas.2020.906.363
[5] Valenzuela-García, J.R., Luna-Maldonado, A.I., Méndez-Dorado, M.A., Cadena-Zapata, M., Arredondo-Valdez, J., Juan López-López, Valenzuela-Carrizales, M.G., Héctor Rojas-Perez. (2024). Precision farming drones : Advances and future directions. https://www.researchgate.net/publication/387136613_Precision_Farming_Drones_Advances_and_Future_Directions.
[6] Guebsi, R., Mami, S., Chokmani, K. (2024). Drones in precision agriculture: A comprehensive review of applications, technologies, and challenges. Drones, 8(11): 686. https://doi.org/10.3390/drones8110686
[7] Ipate, G., Voicu, G., Dinu, I. (2015). Research on the use of drones in precision agriculture. University Politehnica of Bucharest Bulletin Series, 77(4): 1-12.
[8] Daponte, P., De Vito, L., Glielmo, L., Iannelli, L., Liuzza, D., Picariello, F., Silano, G. (2019). A review on the use of drones for precision agriculture. In IOP Conference Series: Earth and Environmental Science, Ancona, Italy, p. 012022. https://doi.org/10.1088/1755-1315/275/1/012022
[9] David, E.A., Omowunmi, A.O. (2016). Above-ground pipeline monitoring and surveillance drone reactive to attacks. In 3rd International Conference on African Development Issues (CU-ICADI 2016), Ota, Nigeria, pp. 9-11.
[10] Bretschneider, T.R., Shetti, K. (2015). UAV-based gas pipeline leak detection. In 35th Asian Conference on Remote Sensing 2014, ACRS 2014: Sensing for Reintegration of Societies.
[11] Benyeogor, M.S., Olatunbosun, A., Kumar, S. (2020). Airborne system for pipeline surveillance using an unmanned aerial vehicle. European Journal of Engineering and Technology Research, 5(2): 178-182. https://doi.org/10.24018/ejers.2020.5.2.1761
[12] Choudhary, R., Rajarathnam, M., Alekya, M., Hari, K.P., Kumar, S.S. (2020). Agriculture automation system. In Journal of Physics: Conference Series, Coimbatore, India, p. 012089. https://doi.org/10.1088/1742-6596/1706/1/012089
[13] Guntumadugu, G.R. (2020). Design, development and operational of an ornithopter. International Journal for Innovative Research in Technology, 6(11): 312-318.
[14] Del Cerro, J., Cruz Ulloa, C., Barrientos, A., de León Rivas, J. (2021). Unmanned aerial vehicles in agriculture: A survey. Agronomy, 11(2): 203. https://doi.org/10.3390/agronomy11020203
[15] Adaramola, B., Adetunla, A., Kayode, J., Okoronkwo, C. (2023). Design and fabrication of a prototype automated railway gate controller. In 2023 International Conference on Science, Engineering and Business for Sustainable Development Goals (SEB-SDG), Omu-Aran, Nigeria, pp. 1-7. https://doi.org/10.1109/SEB-SDG57117.2023.10124384
[16] Srigrarom, S., Chan, W.L. (2015). Ornithopter type flapping wings for autonomous micro air vehicles. Aerospace, 2(2): 235-278. https://doi.org/10.3390/aerospace2020235
[17] Barve, S., Potclar, A., Kale, A., Talekar, P., Khairnar, R. (2020). Design and fabrication of an articulated ornithopter. International Research Journal of Engineering and Technoloy (IRJET), 7(10): 755-759.
[18] Wu, X., Aravecchia, S., Lottes, P., Stachniss, C., Pradalier, C. (2020). Robotic weed control using automated weed and crop classification. Journal of Field Robotics, 37(2): 322-340. https://doi.org/10.1002/rob.21938
[19] Gulaiya, S., Sharma, A., Singh, S., Kumar, R., Chaudhary, D., Yadav, K., Kumar, R. (2024). Precision agriculture: Transforming farming efficiency with cutting-edge smart technologies: A comprehensive review. Journal of Experimental Agriculture International, 46(9): 1126-1138. 10.9734/jeai/2024/v46i92909
[20] Adetunla, A., Adaramola, B., Abdulkadir, H. (2023). Advancements in the design and automation of biomimetic ornithopters: An investigation into flapping-wing flight control. Journal of Intelligent Systems and Control, 2(2): 99-109. https://doi.org/10.56578/jisc020204