Rawaa Ammar Razooqi* | Hassan Jaleel Hassan | Ghaida Muttashar Abdel Saheb
© 2022 IIETA. This article is published by IIETA and is licensed under the CC BY 4.0 license (http://creativecommons.org/licenses/by/4.0/).
OPEN ACCESS
The smart factory is a concept to express the ultimate goal of digitization in manufacturing. The most common definition of a smart factory is a highly digital store floor that collects and shares data on a continuous basis through connected devices and production systems. the proposed system focuses on reducing the delay by using hybrid computing, cloud, and edge servers. The purpose of this study is to investigate Real-time requirements using the Selection Algorithm. The factory is represented by a group of sensors that send data to three servers. (Two are edge servers with the same copies of data and rules, and the third is the cloud). When the sensor's reading reaches the edge servers, scheduling time an selection algorithm is implemented through which a single edge server receives data selecting the least delay the highest priority. Alternatively, if there is any problem or malfunction affects one of the edge servers, the second can complete its work without the need to stop the factory. In turn, the delay is reduced, and the factory performance is improved. When the delay time is reduced, the response time is improved and the service quality will be enhanced.
smart factory, edge server, selection algorithm
Parallel to the advancement of information and communication technology, such as the Internet, cellular networks, and production networks, developed and industrial production underwent significant and significant changes [1]. Factories have been more adaptable than ever to the volatility of modern markets. The cornerstone of new conditions, a drastic shift in the mode of production by German industrialists known as Industry 4.0 is laid by this integration. Manufacturers today face growing demands for product flexibility (i.e., personalization), smaller lot sizes, and volatile markets [2].
Manufacturers would need to incorporate new technology and manufacturing theories to help them rapidly adjust to changing conditions and improve product quality while reducing energy and resource consumption. Manufacturing via water and steam power, mass production via assembly lines, and automation via information technology have all resulted in paradigm shifts in the manufacturing arena so far [3].
In a smart factory, the real-time feature of data flow throughout the whole industrial system, which has a direct impact on production efficiency and system normal functioning, is crucial [4].
The traditional methods adopted the use of cloud computing to receive and process data coming from factories, but it causes many problems, the most important of which is congestion on cloud computing and increased delay because the location of cloud computing is far from the data source [5]. Instead of sending all the IoT devices data to far located cloud DC, some data can be processed in local distributed edge servers. This can reduce the load on the cloud DC and ensures better latency, link utilization, and more efficient energy consumption. Thus, Hybrid computing is the most efficient organization technique in using delay reduction, as many algorithms are proposed using (cloud-edge servers) Hybrid computing for the purpose of saving time.
Smart Manufacturing (SM) is a technology-driven method that monitors the manufacturing process using Internet-connected machines. The objective of SM is to find ways to automate processes and enhance manufacturing performance using data analytics [6]. Moreover, the Smart manufacturing is a concept that refers to a set of technologies and solutions that, when combined, form a manufacturing ecosystem [7, 8]. The main components of the manufactured prototype are:
1. The Arduino Nano is an electronic board that has a small processor installed, similar to what is found in computers, but with less capabilities. Is a little, complete, and breadboard-friendly board based on the ATmega328 (Arduino Nano 3.x).
2. Gas Sensor (300 ppm to 10,000 ppm): Gas sensors (too known as gas finders) are electronic gadgets that distinguish and recognize diverse sorts of gasses. MQ-2 Smoke Liquefied petroleum Gas (LPG) Butane Hydrogen Gas Sensor Detector.
3. Pressure Sensor (300 to 1100hPa): The BMP180 is one of the BMP XXX family of sensors. The sensor detects the absolute pressure of the surrounding air and has a measurement range of 300 to 1100 hPa with a 0.02 hPa accuracy.
4. Ultrasonic Sensor (2cm to 400cm): Ultrasonic Sensor HC-SR04 could be a sensor that has separate degree.
5. DS18B20 temperature sensor (-55℃ ~ 125℃): The DS18B20 is one sort of temperature sensor and it supplies 9-bit to 12-bit readings of temperature accurate sensor and does not require external components to operate.
6. Pyroelectric / Passive Infra-Red sensor (up to 7 meters): PIR sensors permit you to sense movement, by and large utilized to identify whether a human has moved in or out of the sensors extend.
7. The Raspberry Pi 3 It is a small device, the size of a credit-card measured that plugs into a computer screen and employments a standard console and mouse. Raspberry pi 3 show b includes remote LAN and Bluetooth network making it the perfect arrangement for effective associated designs.
The requirements to represent the manufactured prototype with a set of sensors (temperature, pressure, gas, level and proximity). All of them are connected to the Arduino so that it sends the sensor values to the Raspberry Pi via the serial port. The Smart Factory Prototype of the proposed system shown in Figure 1.
Figure 1. The smart factory prototype
The following are some of the most significant enablers in the current business scenario:
1. Artificial intelligence (AI).
2. Block chain in Manufacturing (BIM).
3. Internet of things (IoT).
4. Robotic.
5. Condition monitoring (CM).
6. Cyber security (CS).
When examined enablers closely, they either generate data, embrace data, or do both. The use of data analysis would aid in making the manufacturing process more reliable, transparent, and adaptable [9]. Furthermore, data scientists and other analysts might utilize the information to perform simulations of various processes in order to find the most efficient methods [10, 11].
Data will tell us "what to do" and "when to do it," which is at the core of smart manufacturing. Since smart factories are based on data, cyber security will play a critical role in the smart manufacturing ecosystem [12]. When introducing these enablers, data protection is a major concern. Manufacturing data is used at several stages of the data lifecycle based Integration of multiple CPS and requires a development approach that considers several methods for interconnecting and interoperating heterogeneous components. The IoT concept allows each device to be managed as a thing via web technologies [13, 14]. Moreover, component-based software engineering concepts can be used to manage a "thing" as an encapsulated component. Figure 2 shows the integration of IoT and CPS.
Figure 2. The integration of IoT and CPS [15]
Technologies into manufacturing systems has given rise to new capabilities, allowing for the management of complex and scalable systems that can respond to rapid changes in production volumes and customization [16, 17]. New technologies enable efficient virtual and real-world manufacturing systems, enhancing context knowledge to aid people and machines in performing their tasks flawlessly [18].
Predictive maintenance improves the system's transparency and the performance of the machines. Thus, increasing the production system's reliability [19]. Furthermore, the transparency of manufacturing processes and machine status will assist industrialists in gaining access to essential information that can help them make better decisions. The IoT cloud platform provides a global view of points in manufacturing processes where humans/machines interact with machines. This serves as a bridge for self-adjustment inside a virtual layer of manufacturing processes [20-22].
In the beginning, the proposed factory is represented by five types of sensors connected to the Arduino, and the sensor values are sent to the proposed edge servers by making a request for PHP to one of the edge servers or the cloud server after the selection algorithm is executed.
After receiving the sensor values from the Arduino at the proposed factory the time required to send, receive, wait and process sensor values in the cloud server, first edge server, and second edge server are calculated using the ping library in Python tool. This library calculates the sending time, waiting time, processing time, and receiving time. But it has been modified to collect all times and put them in the name of the runtime.
● Assume total time (ping value) of the proposed first edge server = x
● Assume total time (ping value) of the proposed second edge server= y
● Assume total time (ping value) of the proposed cloud server = c
$x=T_{\text {trans }}(x)+T_{\text {process }}(x)+T_{\text {re }}(x)+T_{\text {que }}(x)$
$y=T_{\text {trans }}(y)+T_{\text {process }}(y)+T_{\text {re }}(y)+T_{\text {que }}(y)$
$c=T_{\text {trans }}(c)+T_{\text {process }}(c)+T_{\text {re }}(c)+T_{\text {que }}(c)$
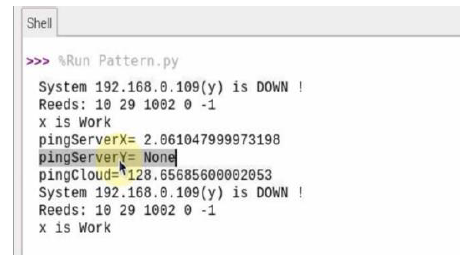
Then, the comparison is made between x and y if no ping for edge servers the reading sensors go to the cloud server. There are Steps work on Raspberry (python) and Selection algorithm.
1. Call the libraries used in python code. Using the Import command to call the libraries and tools.
2. Defines the address of the first edge server, address of the second edge server. And define the service provider for the cloud and saving these addresses because will need them when sending sensors readings.
3. Define variables for sensor values called (level, temp, and press, infra, pro) and give it an initial value of zero.
4. Define the variables (r1, r2, r3, r4, r5) to store the decision values, where a certain value is placed inside it and sent to the Arduino to translate the decision state into taking a specific action such as turning on an alert LED for a specific case.
5. The loop began to read the sensors value (temperature, pressure, gas, level and proximity). from the Arduino at the factory.
6. Flash works to unload the repeated readings and takes the last reading of the data after unpacking to balance the speed between sending in the Arduino and receiving in the Raspberry Pi.
7. Receive data on the sensor values from the Arduino via the serial port.
8. Converting received data into integer values because it came from Arduino in string form. The reason is that Arduino is programmed in C++ and Raspberry is programmed in Python.
9. Check server is on and gets response time using ping function on (tcpping2.ping) custom library.
10. Return to step 5 to Reed Sensor data from Arduino Nano by using Serial port.
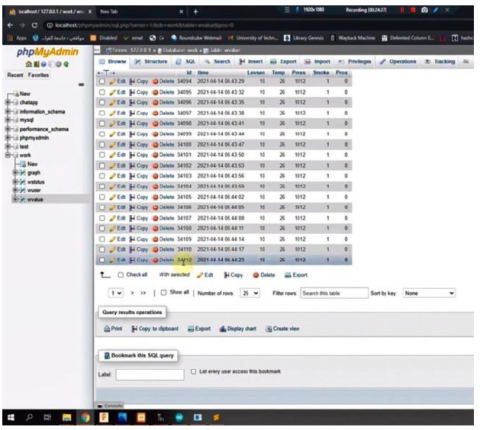
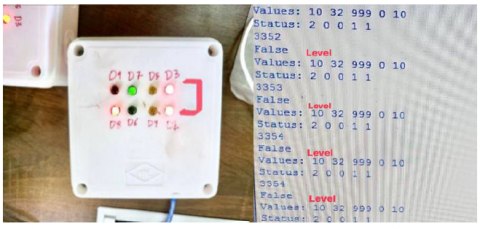
In the proposed system, each edge server is represented by a computer on which an XAMPP is installed. The data reading sensors value coming from the factory, it stored in the database tables of the edge servers. These tables are accessed by making a request to the PHP page of each server. The link is configured to call PHP for each server to add the value of the sensors to the MySQL database table in each server. The sensor values are sent via Raspberry Pi, where they are stored in the table. The database consists of a column for each sensor value, with an id for each row of values, as shown in Figure 3.
Figure 3. Database tables in proposed edge server
Different authors [23, 24] tried to use hybrid computing. The system architecture for factory computing, employs a variety of computer resources to complete the task. Cloud servers, of course, have the advantages of data storage and computing power. But edge servers are close to industrial devices and equipment, providing real-time performance. Device computing units can directly drive the mechanical structure, and Software-defined networking (SDN) can simply provide the cooperation of different network devices. To achieve the latency requirement, all computing resources are incorporated into the hybrid computing architecture from a network standpoint. From the task-node perspective (such as manufacturing devices), this hybrid architecture consists of four parts: Device computing layer, Edge computing layer, Cloud server, and SDN layer are the four layers. The industrial networks (wired/wireless networks) collect all of these elements. Thus, Servers are primarily used at the cloud layer to resolve computing-intensive activities, in which AI models are developed based on various information and large data, as shown in Figure 4.
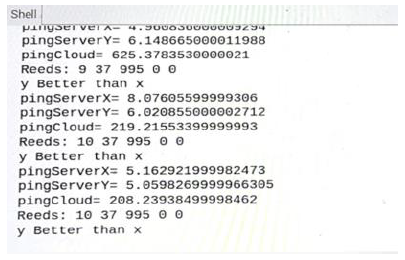
As a result, the traditional intelligent manufacturing framework can be moved to the hybrid computing architecture after adding smart networks nodes, agent devices with restricted computing capability, cloud-computing servers, and fog-computing servers. But there are some drawbacks in traditional industrial systems, which are limited in terms of processing speed on complex tasks, are unsuitable for complex manufacturing processes and big data analysis. To solve these problems, the proposed system relied on the use of edge servers to reduce delays as they are closer to the factory. As a result of the proposed system. When comparing the time calculation values for each Edge server with the time in the cloud server, the difference appears very large and clear. The time spent on the first edge server (x = 8ms) and the second edge serve (y = 6ms), but the time spent in the cloud is much more equal to 219ms, as shown in Figure 5.
Figure 4. Architecture for hybrid computing system [25]
Figure 5. Reducing latency in Edge servers
In the proposed system, the factory performance is monitored through state values (r1, r2, r3, r4, r5). Each condition is set for all sensor values based on the measurement range for each sensor. However, the level sensor takes a condition from 1 to 10 cm, because the length of the tube used in the proposed system is 10 cm. Moreover, the condition taken for the PIR sensor based on the proposed system is that the number of people allowed to enter the proposed factory is 5, as shown in Table 1.
Table 1. Condition and state of each sensor value
|
Sensor |
Condition |
Decision |
|
Level sensor |
>=10cm |
R1=2 |
|
Level sensor |
>=5cm and <10cm |
R1=1 |
|
Level sensor |
>=1cm and <5 cm |
R1=0 |
|
temperature sensor |
>70℃ |
R2=2 |
|
temperature sensor |
>=50℃ and <70℃ |
R2=1 |
|
temperature sensor |
>=1℃ and <50℃ |
R2=0 |
|
Pressure Sensor |
>500 hPa |
R3=0 |
|
Pressure Sensor |
<=500 hPa |
R3=1 |
|
Gas Sensor (Smoke) |
undetected |
R4=0 |
|
Gas Sensor (Smoke) |
detected |
R4=1 |
|
Pyroelectric / Passive Infra-Red sensor (up to 7 meters) |
>5 (detect 5 human to test) |
R5=1 |
|
Pyroelectric / Passive Infra-Red sensor (up to 7 meters) |
<5 |
R5=0 |
The value is set and sent from the proposed edge servers to the Arduino to be translated and converted to take a specific action in an alert to the user in case the sensor value reading is normal or not. The alarm appears in the form of turning off or turning on a certain LED for each sensor value. The LEDs are connected to the Arduino board with a digital bin.
This algorithm is important to reduce the delay in the factory. The proposed system adopts the choice to determine the server to which receives the sensor reading values from the raspberry in the factory to fulfil several conditions.
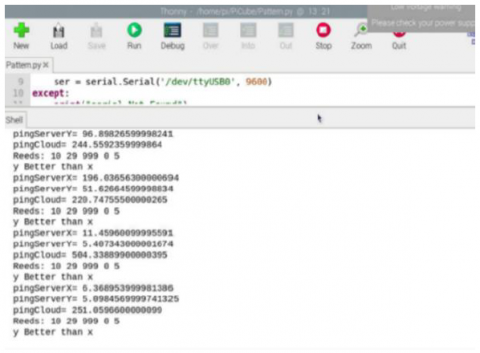
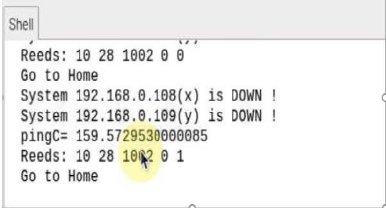
Figure 6. Two edge servers are running
Figure 7. If one of the edge servers is running
Figure 8. No one edge servers running
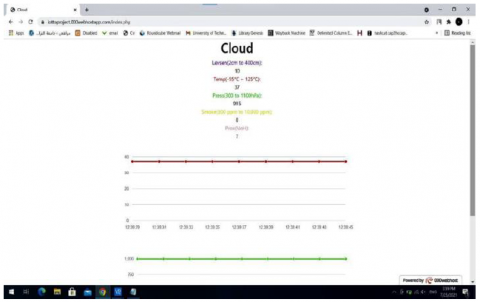
The value of sensors coming from the factory is sent to the cloud server by submitting a request to the PHP page, where the values are displayed in the cloud as a value placed under the name of the sensor and represented in a graph. The vertical axis includes the sensor value and the horizontal axis the time which has the value.
The sensor values are displayed in the cloud. Moreover, the red line is stable with a value of 37℃ representing the value of the temperature sensor and the green line represents the pressure sensor values as shown in Figure 9.
When take the value of the temperature sensor for a specific time, for example at 12:50, the red line several points representing the value of the temperature sensor specifically at this period, as shown in Figure 10.
Figure 9. Sensors value in the cloud server with (52℃ temp)
Figure 10. Change the value of the temperature sensor in the cloud server
In addition, a chart of the pressure sensor values can be displayed in the Different time period, where the green line represents the sensor value, date and time, as shown in Figure 10.
In addition, a chart of the pressure sensor values can be displayed in the Different time period, where the green line represents the sensor value, date and time, as shown in Figure 11.
Figure 11. The values of the sensors with date in the cloud
Reducing delays and reaching real-time requirements using hybrid computing has been studied extensively in the past two decades and is still under development. Reducing of the delay is one of the most important challenges in developing the performance of factories due to the effects on other important factors such as cost and increased productivity. Thus, there are many attempts by researchers to reduce the delay and in different ways, as shown in Ref. [24, 25]. but, are contain some disadvantages because it focuses only on reducing the delay and does not care about other criteria such as, performance monitoring, and error handling. To solve the problem in previous studies, the current study focused on performance monitoring in the smart factory.
The factory is monitored through the values of the states (r1, r2, r3, r4, r5) representing values placed after making a special decision for each sensor to show whether it is in a normal condition or not. Based on Table 1.
A value is placed in r1 to represent a state after a decision is made in the level sensor. As for r2, it represents the temperature sensor after making a decision. Moreover, r3 represents the state of the pressure sensor [26].
The proposed system is determined whether there is smoke in the factory or not by using r4. If the value of the sensor is checked in the presence of gas, 1 is placed in r4 and sent to the Arduino to turn off a LED to alert the user that there is a problem. But, if the gas sensor value is checked, and it turns out that there is no smoke, 0 is placed in r4 and sent to the Arduino to turn on the LED.
Additionally, when a person entered the factory, it is shown using a Passive Infra-Red sensor (up to 7 meters) where the result is placed in r5.
The LEDs are connected to the digital bin on the Arduino. Moreover, The Arduino is connected with the edge servers. It receives the status values from the servers and triggers an alert to the user by turning on and off the LEDs. Each LED is responsible for displaying the state of a specific sensor, where D2 and D3 are about the level sensor. D4 and D5 are responsible for the condition of the temperature sensor. The D6 is also responsible for displaying the status of the pressure sensor. The D7 is responsible for the gas sensor. As for the PIR sensor, its status is displayed in D8.
When the temperature value is Equal to 29℃ (less than 50℃). LED4 (D4) and LED 5(D5) do not glow, as shown in Figure 12.
When the temperature sensor value increases to 59°C, led (D4) will glow to alert the user that there is a problem that occurred in the factory which caused the temperature to rise, as shown in Figure 13.
The LEDs in (D7 and D8) are glowing because r4 of the gas sensor is Equal to 1 which causes D7 to glow. As for D8, the reason for its glow is that r5 of the PIR sensor is equal to 1 when a value of PIR sensor greater than 5. But, the LED in D6 remains off because the pressure sensor value is greater than 500 and r3 equal to 0.
When the value of the level sensor is equal to 10cm and r1 equal to 2 indicating that the tank is empty. LED No. 2(D2) and LED No. 3(D3) will glow, as shown in Figure 14.
When the value of the level sensor changes to 5 cm and r1 equal to 1. LED3 (D3) will turn off and LED 2(D2) will remain glow to indicate to the user that the tank is half full, as shown in Figure 15.
Figure 12. Temperature value 29 and turn off LEDs (D4 and D5)
Figure 13. Temperature value 59 and turn on LED (D4)
Figure 14. Level sensor value 10cm and turn on LEDS (D2&D3)
Figure 15. Level sensor value 5cm and turn on LED (D2)
Figure 16. Level sensor value 3cm and turn off LEDS (D2&D3)
When the value of the level sensor changes to 3 cm and r1 equal to 0. Led2 (D2) and led3 (D3) will turn off to alert the user that the tank in the factory contains more than half. Led2 (D2) and led3 (D4) are off, as shown in Figure 16.
There are evaluation criteria that have been taken into consideration:
The proposed system is the most efficient and successful to reduce the delay by using hybrid computing. When comparing the total time for sending, receiving, and processing data in the cloud with the total time in the edge servers, where the time in the cloud computing was 128ms, while the time using the edge server was 2ms.
The proposed system is considered more flexible because the factory was represented by several sensors that can be added to other devices.
Time is a fundamental factor, and it is considered an approach to improve the performance of factories. This paper focuses on reducing time and reaching real-time requirements. Edge servers are used to reduce the time because they are closer to the factory than cloud computing and can complete data processing without the need to stop the factory when any failure occurs. The factory is represented by five types of sensors connected to the Arduino, which sends the readings of a sensor to the raspberry pi. A better path is chosen from the edge servers that have the least time of the highest priority. It sends to servers by making requests to the PHP of each server to add value.
This proposed system also monitors the performance of the smart factory by sending status after making a decision to the Arduino to be translated by turning off or turning on a specific LED for each state.
This work has come to significantly reduce the delay by using selection algorithm with the Edge servers. When comparing the total time of the Edge servers with the total time of cloud computing, we notice a significant difference in the total time of sending and receiving reading sensor values. But this work focuses on reducing the delay and does not care about the principles of safety. This point is considered as disadvantage in the work that can be solved in the future by using encryption and security technology for the factory data.
[1] Witkowski, K. (2017). Internet of things, big data, industry 4.0–innovative solutions in logistics and supply chains management. Procedia Engineering, 182: 763-769. https://doi.org/10.1016/j.proeng.2017.03.197
[2] Kröll, M. (2021). Coordination between learning locations in the context of digital transformation. Proceedings of the Conference on Learning Factories (CLF) 2021. https://dx.doi.org/10.2139/ssrn.3868448
[3] Thoben, K.D., Wiesner, S., Wuest, T. (2017). “Industrie 4.0” and smart manufacturing-a review of research issues and application examples. International Journal of Automation Technology, 11(1): 4-16. https://doi.org/10.20965/ijat.2017.p0004
[4] Qi, Q., Tao, F. (2019). A smart manufacturing service system based on edge computing, fog computing, and cloud computing. IEEE Access, 7: 86769-86777. https://doi.org/10.1109/ACCESS.2019.2923610
[5] Cao, H., Wachowicz, M. (2019). An edge-fog-cloud architecture of streaming analytics for internet of things applications. Sensors, 19(16): 3594. https://doi.org/10.3390/s19163594
[6] Lee, C.K.M., Zhang, S.Z., Ng, K.K.H. (2017). Development of an industrial Internet of things suite for smart factory towards re-industrialization. Advances in Manufacturing, 5(4): 335-343. https://doi.org/10.1007/s40436-017-0197-2
[7] Lee, J. (2015). Smart factory systems. Informatik-Spektrum, 38(3): 230-235. https://doi.org/10.1007/s00287-015-0891-z
[8] Schmal, J.P. (2020). The role of advanced process modeling in smart manufacturing. Smart Manufacturing, pp. 167-212. https://doi.org/10.1016/B978-0-12-820027-8.00007-1
[9] Flores-Cerrillo, J., Hu, G., Megan, L. (2020). Implementing smart manufacturing across an industrial organization. Smart Manufacturing, pp. 27-57. https://doi.org/10.1016/B978-0-12-820027-8.00002-2
[10] Herrmann, F. (2018). The smart factory and its risks. Systems, 6(4): 38. https://doi.org/10.3390/systems6040038
[11] Behera, A., Pan, J., Behera, A. (2021). Temperature nanosensors for smart manufacturing. Nanosensors for Smart Manufacturing, pp. 249-272. https://doi.org/10.1016/B978-0-12-823358-0.00013-7
[12] Chen, C.H., Lin, M. Y., Liu, C.C. (2018). Edge computing gateway of the industrial internet of things using multiple collaborative microcontrollers. IEEE Network, 32(1): 24-32. https://doi.org/10.1109/MNET.2018.1700146
[13] Li, H., Ota, K., Dong, M. (2018). Learning IoT in edge: Deep learning for the Internet of Things with edge computing. IEEE Network, 32(1): 96-101. https://doi.org/10.1109/MNET.2018.1700202
[14] Mir, M.H., Ravindran, D. (2017). LETISA: latency optimal edge computing technique for IoT based smart applications. International Journal of Scientific Research in Computer Science, Engineering and Information Technology, 2(4): 688-694. https://doi.org/10.13140/RG.2.2.15141.55527
[15] Tao, F., Qi, Q., Liu, A., Kusiak, A. (2018). Data-driven smart manufacturing. Journal of Manufacturing Systems, 48: 157-169. https://doi.org/10.1016/j.jmsy.2018.01.006
[16] Deng, D.J., Lien, S.Y., Lin, C.C., Hung, S.C., Chen, W.B. (2017). Latency control in software-defined mobile-edge vehicular networking. IEEE Communications Magazine, 55(8): 87-93. https://doi.org/10.1109/MCOM.2017.1601165
[17] Trappey, A.J., Trappey, C.V., Fan, C.Y., Hsu, A.P., Li, X.K., Lee, I.J. (2017). IoT patent roadmap for smart logistic service provision in the context of Industry 4.0. Journal of the Chinese Institute of Engineers, 40(7): 593-602. https://doi.org/10.1080/02533839.2017.1362325
[18] Jiang, H., Shen, F., Chen, S., Li, K. C., Jeong, Y.S. (2015). A secure and scalable storage system for aggregate data in IoT. Future Generation Computer Systems, 49: 133-141. https://doi.org/10.1016/j.future.2014.11.009
[19] Lee, C.K. M., Cao, Y., Ng, K.H. (2017). Big data analytics for predictive maintenance strategies. In Supply Chain Management in the Big Data Era, pp. 50-74. https://doi.org/10.4018/978-1-5225-0956-1.ch004
[20] Ahmadi, R., Newby, M. (2011). Maintenance scheduling of a manufacturing system subject to deterioration. Reliability Engineering & System Safety, 96(10): 1411-1420. https://doi.org/10.1016/j.ress.2011.05.004
[21] Wu, D., Rosen, D. W., Schaefer, D. (2014). Cloud-based design and manufacturing: status and promise. In Cloud-based design and manufacturing (CBDM). https://doi.org/10.1007/978-3-319-07398-9_1
[22] Yousefpour, A., Ishigaki, G., Gour, R., Jue, J.P. (2018). On reducing IoT service delay via fog offloading. IEEE Internet of Things Journal, 5(2): 998-1010. https://doi.org/10.1109/JIOT.2017.2788802
[23] Celesti, A., Fazio, M., Galletta, A., Carnevale, L., Wan, J., Villari, M. (2019). An approach for the secure management of hybrid cloud–edge environments. Future Generation Computer Systems, 90: 1-19. https://doi.org/10.1016/j.future.2018.06.043
[24] Kang, H.S., Lee, J.Y., Choi, S., et al. (2016). Smart manufacturing: Past research, present findings, and future directions. International Journal of Precision Engineering and Manufacturing-Green Technology, 3(1): 111-128. https://doi.org/10.1016/j.ifacol.2017.08.2548
[25] Li, X., Wan, J., Dai, H.N., Imran, M., Xia, M., Celesti, A. (2019). A hybrid computing solution and resource scheduling strategy for edge computing in smart manufacturing. IEEE Transactions on Industrial Informatics, 15(7): 4225-4234. https://doi.org/10.1109/TII.2019.2899679
[26] Merdj, F., Drid, S. (2022). Electromagnetic forces effects of MHD micropump on the blood movement. Journal Européen des Systèmes Automatisés, 55(1): 147-153. https://doi.org/10.18280/jesa.550116