Noor S. Farhan* | Matheel E. Abdulmunim | Hasanen S. Abdullah | Musheer Ahmad
© 2026 The authors. This article is published by IIETA and is licensed under the CC BY 4.0 license (http://creativecommons.org/licenses/by/4.0/).
OPEN ACCESS
Automatic detection of harmful spoken content remains less studied than text-based moderation, particularly for Arabic dialects and acoustic-only multi-class settings. This study investigates whether complementary acoustic representations can discriminate harmful and non-harmful speech in Iraqi Arabic voice messages without using lexical transcripts. A dataset of 1,268 naturally produced voice-message clips, totaling approximately 1.75 h, was annotated by three Iraqi annotators into four categories: bullying, toxic, neutral, and positive speech. Annotation reliability was assessed using Fleiss’ kappa and pairwise Cohen’s kappa. Fifteen configurations constructed from Mel-frequency cepstral coefficients (MFCCs), log-Mel spectrograms, spectral contrast, and prosodic features were evaluated with random forest (RF), logistic regression (LR), k-nearest neighbors (KNN), and support vector machine (SVM) classifiers under a common 70/30 sample-level split. The strongest single-run result was obtained by combining MFCCs, log-Mel spectrogram, and spectral contrast with an SVM, yielding 96.59% accuracy and a macro F1-score of 96.46%. Across five random splits, this configuration achieved an average accuracy of 95.96% ± 0.30%, indicating limited run-to-run variation under the adopted protocol. Spectral representations consistently outperformed prosodic-only features, while adding all available features did not further improve classification. These findings establish a strong acoustic baseline for Iraqi Arabic harmful-speech classification, although speaker-independent generalization remains to be examined because persistent speaker identifiers were not retained.
Iraqi Arabic speech, harmful speech classification, acoustic feature fusion, mel-frequency cepstral coefficients, spectral features, support vector machine, speech toxicity detection
Hate speech and offensive language represent significant social issues as they can have inhibiting effects on public participation and result in increases in tension and physical violence between different groups, which has spurred substantial research on the automatic detection of hate, offensive, and toxic content [1]. The task is further complicated in Arabic by the dialectal variation, informal idioms, and context-dependent usage, which make modeling and evaluation difficult [2]. At the same time, online communication is not confined to written text. In messaging applications, short voice messages have become a widespread mode of contact, in which speech encodes not only lexical content but also paralinguistic information such as prosody, intensity, rhythm, and speech tempo. These cues might alter the perceived harmfulness of a statement, especially when the spoken content is vague, indirect, or context-dependent [3, 4]. Within this study, hate speech detection is operationalized as an acoustic-based multi-class classification task involving four predefined categories: bullying, toxic, neutral, and positive, with the first two representing harmful speech categories. Accordingly, the study focuses on acoustic discrimination among these categories rather than a comprehensive interpretation of the broader lexical, semantic, or social context of spoken hate speech.
1.1 Motivation and research gap
Research in the field of Natural Language Processing (NLP) has extensively explored the detection of offensive language and hate speech in texts and images. In contrast, this area has received little attention in the field of voice communication, especially in the context of Arabic dialects. These limitations are not limited to modeling problems, but also include a lack of reliable datasets for fair analysis and comparison [5]. Privacy restrictions and the inability to share voice data also hinder cumulative progress and make comparisons among studies difficult [6]. The Arabic language further complicates these restrictions due to the multiplicity of its dialects, the diversity of its speakers, and the different recording conditions; therefore, realistic databases and transparent experiments are essential [7, 8]. Furthermore, many toxicity detection models in related studies use Automatic Speech Recognition (ASR) or transcript-based methods, in which quasi-linguistic information such as tone, intensity, rhythm, and emphasis may not be explicitly represented. In addition, there is still a lack of real-world Arabic dialectal speech datasets specifically designed for multi-class hate speech analysis, particularly resources that distinguish multiple harmful and non-harmful categories rather than relying solely on binary labeling systems. Therefore, there is a need for speech data in Arabic dialects that has been realistically collected and clearly explained and that supports multi-class hate speech analysis, along with systematic acoustic-only evaluation to examine the discriminative contribution and integration between spectral and prosodic representations without relying on textual transcription.
1.2 Contributions
To address these challenges, this research paper presents an experimental acoustic framework for detecting multi-class hate speech in Arabic dialects, with a focus on the Iraqi dialects as a case study. The constructed dataset includes annotated real-world speech samples that can be divided into four categories: bullying, toxic, neutral, and positive. For ethical reasons, the dataset is not publicly available; however, information related to the dataset, including statistics, the annotation process, and features, is provided.
The main contributions of this research can be summarized in three parts. Firstly, the research constructs a realistic dataset developed according to ethical standards, mimicking the Iraqi Arabic dialect, to classify hate speech into multiple categories, including four predefined harmful and non-harmful categories. Secondly, the research uses annotation criteria to increase label consistency and differentiate between categories of harmful and non-harmful speech. Thirdly, the research establishes a systematic acoustic evaluation framework by examining fifteen configurations of spectral and prosodic features, individually and in fusion, across four machine-learning classifiers under consistent experimental conditions. This assessment determines the discriminative and integrative ability of different acoustic representations and provides comparative evidence on the relative effectiveness of the feature configurations that were evaluated. The reported results provide an acoustic reference point that supports the subsequent development and evaluation of more advanced learning techniques within the Arabic dialectal speech environment investigated.
The remainder of this research paper is divided as follows. Section 2 presents an analysis of related work. Section 3 describes the dataset and annotation process, while Section 4 presents the proposed methodology. Section 5 presents and discusses the experimental results, while Section 6 presents the general conclusions.
The detection of hate speech has evolved significantly in the field of NLP when processing textual data [9]. Previous studies have addressed challenges such as contextual ambiguity, slang, and multilingualism [10]. Subsequent approaches evolved from rule-based systems to supervised machine learning approaches, including Naïve Bayes (NB) and support vector machines (SVMs), to enhance their ability to handle explicit insults. Deep learning models, including convolutional neural networks (CNNs), Long Short-Term Memory (LSTM), and Transformer, have enabled more efficient processing of complex and noisy sets of text [11]. In Arabic, recent studies have more comprehensively addressed dialectal variation using social media data and dedicated hate speech resources, including Instagram-based datasets [12] and Arabic and multi-dialectal language collections [13, 14].
With the increasing use of multimodal communication on the internet, research in hate speech detection has progressed from text to images, videos, and even multimodal data. Datasets such as MultiOFF [15] and Hateful Memes [16] have supported offensive-content analysis using image-text combinations, while multimodal video resources such as Multimodal Hate Speech Detection System (HateMM) [17] and Multimodal Hate Speech Detection System for Videos (MM-HSD) [18] incorporate visual, auditory, and textual information. However, in such multimodal settings, audio is typically analyzed as one component alongside visual and textual information rather than being evaluated independently as an acoustic representation. Consequently, such multimodal settings provide limited evidence about the discriminative contribution of the acoustic signal when evaluated independently.
Recent studies in speech toxicity detection have increasingly followed two main directions: text-based approaches that apply linguistic models to texts generated by ASR, and direct speech approaches that model information from the speech signal. Within real audio contexts, DeToxy [19] provides an important example by comparing an ASR→Bidirectional Encoder Representations from Transformers (BERT) approach with an end-to-end Wav2Vec model, illustrating the growing role of pretrained speech representations in speech toxicity detection. These representation learning methods differ from conventional acoustic modeling, where predefined spectral and prosodic descriptors are extracted from the speech signal and subsequently processed by a classifier. MuTox and ADIMA [20, 21] also expanded the scope of speech toxicity detection to include multilingual settings using speech-based and transcript-supported representations. In addition to these approaches, the role of prosody in the perception of hate speech was investigated in the study [22], showing that prosodic characteristics were systematically related to how spoken content was evaluated in terms of hate speech. However, the study focused on prosodic characteristics in read-aloud hate speech stimuli and their relationship to human perception, rather than developing an automated speech classification model. Recently, an acoustic-only approach [23] studied abusive-speech detection using acoustic and prosodic features on the multilingual ADIMA dataset, and demonstrated the possibility of distinguishing between abusive and non-abusive speech without relying on textual representations. Nevertheless, the task remained binary and was evaluated across Indic languages. These results support the discriminative potential of non-lexical speech information, while the classification of multi-class hate speech using only acoustic features in Arabic dialects remains an under-studied area.
Due to the sensitivity and difficulty of disseminating audio abuse data, other work has turned to synthetic speech: Audio Hate Xplain [24] offered an interpretive framework based on Text-to-Speech (TTS) to identify justifiable time segments within the signal, validated on human recordings. However, its evaluation remains centered on English and includes speech generated from prepared textual content. With the rise of deepfake threats, SynHate [25] introduced a four-category scheme (real/fake × hate/normal) by generating fake audio from texts using the TTS component of the Massively Multilingual Speech (MMS model. Similarly, small TTS sets [26] have been used as a controlled solution for labeling and experimentation. Although these datasets are useful for controlled experiments, their ability to reflect real-world platform conditions, dialect variations, speaker variability, and recording noise remains limited.
In the context of Arabic speech, ARAOFFENSE [27] represents an important resource for detecting offensive speech across multiple Arabic dialects. It contains 2,146 labeled audio clips, collected from written television and film content, and formulates the task into a binary classification of offensive versus non-offensive speech. Its evaluation includes acoustic speech models as well as configurations that include textual information derived from ASR. Although ARAOFFENSE provides an important benchmark for abusive Arabic speech, its written media source and binary label structure differ from the real-world, multi-class voice-message settings investigated in this study.
With the increasing diversity of speech-toxicity data sources and labeling settings, annotation quality becomes a critical factor. Thus, clear definitions, consistent guidelines, and consensus among annotators are essential.
The studies [28, 29] confirm that differing guidelines and biases weaken generalization and comparability, while the study [30] provides a framework for analyzing the characteristics and biases of datasets and reinforces the need for a transparent description of the data collection and classification process.
Acoustic-only modeling remains challenging because it seeks to discriminate harmful and non-harmful speech categories directly from the speech signal without relying on lexical transcripts. Such modeling must account for speaker variability, dialectal pronunciation, short clip duration, and real-world recording noise while preserving potentially discriminative spectral and prosodic information that may not be explicitly represented in transcript-based approaches. The reviewed studies reveal several limitations relevant to the present research setting, including reliance on ASR or text-based representations in several systems, the use of synthetic, media-based, or controlled speech sources, the limited availability of Arabic dialectal speech resources, and the predominance of binary labeling schemes. Collectively, these limitations indicate that real-world, multi-class Arabic dialectal speech remains insufficiently investigated from an acoustic-only perspective.
In this section, we discuss the construction of the new Iraqi ToxSpeech (ITS) dataset. ITS is an Iraqi dialectal speech dataset constructed using real-world voice messages. The dataset contains 1,268 audio samples (around 6,305 seconds, 1.75 hours) and is annotated into four classes: bullying, toxic, neutral, and positive speech. Full statistics and details of the annotation process to support reproducibility are summarized in the next subsections.
3.1 Label definitions
The boundaries between hate-related and offensive categories may vary across studies [31, 32]. This work defines the labels based on speech intent and target direction. Directed personal attacks toward a specific individual were assigned to the bullying class, whereas offensive or abusive expressions that were not directed at a specific person were grouped under the toxic class. In contrast, neutral and positive classes were introduced to cover instances of non-abusive communication that may range from simple conversations with factual statements to supportive or encouraging expressions. This is further detailed in Table 1.
Table 1. Label definitions and audio intent interpretation
|
Label |
Definition (Short) |
Example (Iraqi) |
Audio Interpretation |
|
Bullying (Targeted Abuse) |
Direct abusive or aggressive speech addressed to a specific person (by name or by direct pronoun), including insult, humiliation, or threat. |
" تصرفاتك مضحكة ومرات مزعجة، محد يتحمل وجودك مثل البهلوان شكلك" |
Spoken with a mocking and aggressive tone directed at a specific person. The utterance indicates personal humiliation and targeted verbal abuse. |
|
Toxic (General abuse) |
Abusive, offensive, or aggressive speech not directed at a specific individual; may target a group or be expressed in a general form. |
"همجيين رعاع الى يوم القيامة يبقى تخلفهم سرمدي" |
Uttered with a hostile tone expressing general contempt, disparagement, and abuse, without addressing a specific person. |
|
Neutral |
Non-abusive and non-supportive content such as factual statements, questions, routine conversation, or informational talk. |
"شنو صاير اريد افتهم التعليقات؟" |
Spoken in a normal conversational tone, reflecting a routine request for interaction without abusive, hostile, or supportive intent. |
|
Positive |
Clearly supportive, appreciative, empathetic, or constructive speech with an explicitly positive tone. |
"شي يشرح القلب، شبابنا يشتغلون بصدق وحب للبلد، بارك الله بيكم" |
Spoken with a warm and encouraging tone, expressing appreciation, support, and positive social interaction. |
3.2 Data collection and audio standardization
All audio samples were acquired from instant messaging applications such as Telegram, WhatsApp, Messenger, and group chats with clear participant consent. The participants provided consent for their recordings to be used for academic purposes only and not for public distribution. To preserve confidentiality, explicit identity information and persistent speaker identifiers were not retained. Recordings were obtained from group voice interactions in which participants discussed general topics and produced utterances representing different harmful and non-harmful instances. The resulting recordings reflect informal voice-message communication with natural variation in pronunciation, speaking style, emotional expression, and recording conditions. The collection procedure was designed to preserve the characteristics of naturally produced short voice-message communication without relying on scripted reading or synthetically generated speech. Contributors were not restricted to a single speech category, and recordings from the same contributor could represent different classes. This collection design reduces direct speaker–label association, in which a particular speaker would systematically correspond to a single class.
The collected files were originally available in various audio formats, such as M4A, Ogg, and MP3. All files were standardized before annotation by converting them to single-channel WAV format with a sampling rate of 16 kHz. Each complete voice message was treated as one audio sample. Clips containing overlapping voices, heavy background noise, or unintelligible speech were excluded.
3.3 Annotation guidelines and process
To enable consistent and reliable annotation, we developed the following standards, which define the criteria for labeling and the processes for resolving ambiguities. Thus, each audio clip was annotated with one of the four established classes.
3.3.1 Target-based criterion
A key difference between bullying and toxic behavior is whether the abusive content is directed at a particular individual.
3.3.2 Speech level assessment
The overall communicative intent and target direction were considered together with vocal expression and acoustic cues such as pitch, volume, and apparent anger. These acoustic cues served as supporting indicators rather than standalone criteria for assigning the final label, particularly when the distinction depended on whether the abusive content was directed toward a specific target.
3.3.3 Priority rule
When multiple cues appeared in the same clip, the final label was assigned according to the following priority (bullying > toxic > positive > neutral).
3.3.4 Ambiguity
Ambiguous clips were adjudicated and resolved.
3.3.5 Audio quality monitoring
Any sample with overlapping speech or background noise that made the speech difficult to understand or completely unintelligible was excluded.
3.3.6 Consistency
Annotators were instructed to be consistent in their judgment across the dataset and not to make subjective judgments not covered by the criteria.
Figure 1. Annotation process with uncertainty-guided review
The annotation was performed by three Iraqi annotators with academic backgrounds in computer science, artificial intelligence, pattern recognition, and Arabic language. Before performing the actual annotation, the annotators examined the coding guidelines and conducted a pilot study to align their understanding through calibration using a subset of the clips. All three annotators subsequently annotated each clip with one of the four specified labels. The final label was generated through majority voting. Label unanimity was reached if all three annotators assigned the same label. When two out of three annotators agreed, the majority label was taken. A case was considered ambiguous when no clear majority was reached. The case was then either dropped or adjudicated. This process, along with the ambiguity resolution phase, is illustrated in Figure 1.
3.4 Agreement and reliability
The consistency of the annotation process was evaluated using Fleiss’ Kappa for overall agreement among the three annotators and pairwise Cohen’s Kappa for agreement between individual annotator pairs. As shown in Table 2, Fleiss’ Kappa reached 0.8099, while pairwise Cohen’s Kappa values ranged from 0.7556 to 0.8397. These agreement levels indicate a high degree of consistency in applying the predefined annotation criteria, including the target-based distinction between bullying and toxic speech, despite the interpretive nature of communicative intent and vocal expression.
Table 2. Inter-annotator agreement results
|
Agreement Metric |
Value |
|
Fleiss’ Kappa |
0.8099 |
|
Cohen’s Kappa: Annotator 1 vs. Annotator 2 |
0.7556 |
|
Cohen’s Kappa: Annotator 1 vs. Annotator 3 |
0.8397 |
|
Cohen’s Kappa: Annotator 2 vs. Annotator 3 |
0.8347 |
3.5 Uncertainty-guided annotation review
In order to increase the reliability of the annotation results, an uncertainty-guided review procedure was conducted after the first stage of annotation was completed manually. This stage was inspired by active learning, but it was not used as an automatic relabeling mechanism or as a final classification model. Instead, it was used to identify low-confidence samples that may require additional expert inspection.
This stage included the extraction of acoustic Mel-frequency cepstral coefficient (MFCC) features and the training of an initial SVM classifier using the predefined training set. Based on that classifier, prediction confidence was estimated for the test cases. Cases with confidence below the chosen threshold of 0.65 were recognized as low-confidence cases and prioritized for expert re-checking. Finally, the decisions were made manually for all samples, which could be accepted, corrected, or rejected based on expert opinion. As can be seen from Table 3, some samples fell below the confidence threshold. High-confidence samples also showed higher accuracy. These findings indicate that the uncertainty score was effective in highlighting difficult or borderline speech cases. Therefore, this stage was used only to support annotation reliability and guide expert review rather than to replace human annotation.
Table 3. Uncertainty-guided annotation review and confidence-based prediction analysis
|
Metric |
Value |
|
Feature representation |
MFCC |
|
Preliminary classifier |
SVM |
|
Test samples |
381 |
|
Correct predictions |
366 |
|
Wrong predictions |
15 |
|
Accuracy |
96.06% |
|
Mean confidence |
0.9081 |
|
Mean uncertainty |
0.0919 |
|
Confidence threshold |
0.65 |
|
Low-confidence samples |
22 / 381 (5.77%) |
|
High-confidence samples |
359 / 381 (94.23%) |
|
Low-confidence accuracy |
54.55% |
|
High-confidence accuracy |
98.61% |
Note: MFCC = Mel-Frequency Cepstral Coefficients; SVM = support vector machine.
3.6 Dataset analysis
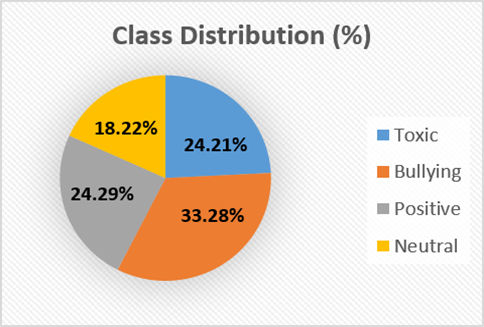
The final data collection contains 1268 labeled audio clips, which are categorized into four classes. Figure 2 shows a substantial difference in the class distribution of the dataset, where the bullying class has the highest percentage, followed by the toxic, positive, and neutral classes.
The audio clips are relatively short in duration, with a median duration of approximately 4 seconds across the dataset, which is consistent with the nature of voice chats. Differences in duration and file size across categories are due to natural variation in styles of speech and in recording environments. The detailed information for each category is presented in Table 4, and Figure 3 shows the cumulative duration per class.
Table 4. Statistical characteristics of the Iraqi ToxSpeech (ITS) audio dataset
|
Label |
Bullying |
Toxic |
Positive |
Neutral |
|
Clips (n) |
422 |
307 |
308 |
231 |
|
Percent |
33.28% |
24.21% |
24.29% |
18.22% |
|
Total duration (sec) |
2119 |
1430 |
1566 |
1190 |
|
Median duration (sec) |
4 |
4 |
4 |
4 |
|
Mean duration (sec) |
5.02 |
4.66 |
5.08 |
5.15 |
|
Min duration (sec) |
1 |
1 |
1 |
2 |
|
Max duration (sec) |
34 |
27 |
33 |
30 |
Figure 2. Percentage distribution of classes in the Iraqi ToxSpeech dataset
Figure 3. Cumulative duration (seconds) of audio clips per class
At the sample level, the dataset contains 587 clips from male contributors and 681 clips from female contributors. The age-group distribution comprises 763 adult, 444 young-adult, and 61 child clips. These statistics represent the demographic distribution of the collected audio samples and do not correspond to the number of unique speakers.
This section presents the proposed speech-based hate speech classification task and describes the main stage of the adopted acoustic learning framework.
The task in this work is framed as a supervised multi-class classification problem for the detection of hate speech in dialectal Arabic speech. Given an input speech clip xi $\in \mathrm{X}$, the goal is to assign it to one of four classes: bullying, toxic, neutral, or positive. Since the audio clips have variable durations, each clip is converted into a one-dimensional feature vector with a fixed number of elements using a feature extraction function F().
${{z}_{i}}=F\left( {{x}_{i}} \right)$ (1)
where, $z_i$ denotes the extracted feature vector of clip $x_i$. The classifier then predicts the final class label according to the following equation:
${{y}_{i}}=C\left( {{z}_{i}} \right)$ (2)
where, C() is the classifier and yi is the predicted label. Therefore, the general framework follows a structured path that includes dataset preparation, signal preprocessing, acoustic feature extraction, feature standardization and classification, which is illustrated in Figure 4.
Figure 4. Architecture of the proposed dialectal Arabic hate speech detection framework
4.2 Signal preprocessing
After audio standardization was achieved in the dataset-building phase, the signal-level preprocessing in this work was limited to two lightweight operations: silence trimming and amplitude normalization. We applied silence trimming to remove low-energy non-speech regions at the boundaries of each clip and retain the effective speech portion only. This helped to eliminate unnecessary samples before feature extraction, which is a widely used practice in speech preprocessing techniques [33]. This procedure is especially useful for real-life recordings, since audio clips often contain pauses or silence before or after the actual speech sound. We also employed amplitude normalization to scale each waveform to a standard range, around (−1, 1), to minimize the influence of the recording loudness and microphone gain, thus providing more comparable waveforms before acoustic feature extraction. No explicit noise reduction or filtration stage was implemented; rather, the preprocessing path was deliberately kept to a minimum to preserve the natural characteristics of real-world dialectal Arabic speech while minimizing only the most obvious sources of variation. Figure 5 shows an example of a speech clip before and after preprocessing.
Figure 5. Example waveform before and after signal preprocessing. The example illustrates the effect of standardization and preprocessing, including resampling to 16 kHz, trimming low-energy boundary regions, reducing the duration from 47.08 s to 39.39 s, and normalizing the waveform amplitude
4.3 Acoustic feature extraction
Speech clips are inherently variable in duration and acoustic structure; therefore, the direct use of raw waveform is less suitable for the lightweight machine learning setting adopted in this study. After signal preprocessing, each audio clip was converted into a fixed-length one-dimensional acoustic feature vector. The adopted feature design aimed to represent complementary spectral and prosodic characteristics of the speech signal, capturing information related to spectral structure, energy distribution, pitch variation, and other aspects of vocal delivery. This design is consistent with Arabic speech studies that commonly use MFCC, log-Mel spectrogram, spectral contrast, pitch, energy, and zero-crossing rate (ZCR) to represent informative acoustic characteristics [34]. The alternative feature extraction paths are shown in Figure 6.
Three spectral feature groups were extracted to characterize complementary aspects of the acoustic structure of each speech clip:
1. Mel-Frequency Cepstral Coefficients (MFCCs): provide a compact representation of the spectral envelope of speech and characterize spectral patterns related to speech production and phonetic structure. In this work, they represent the overall spectral shape of the speech signal while reducing detailed spectral information to a compact set of coefficients [35].
2. Log-Mel spectrogram features: represent how the signal energy is distributed across Mel-scaled frequency bands and how this distribution changes over time. In this work, they characterize the frame-level time-frequency energy structure of the speech signal, providing information about variations in spectral energy across the clip.
3. Spectral contrast: describes the relative differences between spectral peaks and valleys across frequency sub-bands, thereby characterizing variations in the distribution of spectral energy. It complements the overall spectral-envelope information represented by MFCCs by describing the contrast between dominant and weaker spectral regions.
Figure 6. Alternative feature extraction paths
To complement the spectral representations, a compact prosodic feature set was extracted to characterize aspects of vocal delivery. In this set, root mean square (RMS) energy represents variations in signal energy, pitch describes changes in fundamental frequency associated with vocal intonation, and ZCR characterizes the rate of waveform sign changes. Together, these features provide complementary information about energy, intonation, and signal dynamics that is not explicitly represented by the spectral descriptors alone.
Since the raw acoustic features are calculated at the frame level, temporal aggregation was applied to obtain clip-level fixed-length representations, as is common in speech representation methods. For a feature trajectory ${{f}_{t}}$ over $T$ frames, where $t$ is the frame index, the mean and standard deviation are calculated as follows [36]:
$\mu =\frac{1}{T}\underset{t=1}{\overset{T}{\mathop \sum }}\,{{f}_{t}}$ (3)
$\sigma =\sqrt{\left[ \frac{1}{T}\underset{t=1}{\overset{T}{\mathop \sum }}\,{{\left( {{f}_{t}}-\mu \right)}^{2}} \right]}$ (4)
and the final clip-level representation is formed as:
$z=\left[ \mu \left( f \right),~\sigma \left( f \right) \right]$ (5)
where, $z$ denotes the resulting one-dimensional feature vector. This aggregation is applied independently to each feature dimension, converting variable-length clips into fixed-size numerical representations suitable for classification. To improve reproducibility, the main feature-extraction configurations and derived feature dimensions are summarized in Table 5.
Table 5. Acoustic feature extraction configurations and derived feature dimensions
|
Raw Feature |
Configuration |
Number of Derived Features |
Category |
Total Number of Features per Category |
|
MFCC |
n_mfcc=20, n_fft=512, win_length=400 samples / 25 ms, hop_length=160 samples / 10 ms |
40 |
Spectral |
134 |
|
Log-Mel spectrogram |
n_mels=40, n_fft=512, win_length=400 samples / 25 ms, hop_length=160 samples / 10 ms, fmin=0 Hz, fmax=8000 Hz (sr/2), power=2.0 |
80 |
||
|
Spectral contrast |
n_bands=6, fmin=200 Hz, n_fft=512, hop_length=160 samples / 10 ms, quantile=0.02 |
14 |
||
|
ZCR |
frame_length=512, hop_length=160 samples / 10 ms |
2 |
Prosodic |
6 |
|
RMS Energy |
frame_length=512, hop_length=160 samples / 10 ms |
2 |
||
|
Pitch |
YIN method, fmin=50 Hz, fmax=500 Hz, frame_length=512, hop_length=160 samples / 10 ms |
2 |
Note: MFCC = Mel-Frequency Cepstral Coefficients; ZCR = zero-crossing rate; RMS = root mean square; FFT = fast Fourier transform; Hz = hertz; ms = millisecond; sr = sampling rate.
4.4 Data splitting and feature standardization
After creating the clip-level acoustic feature vectors, the dataset was separated into training and test subsets using a 70/30 sample-level split, where 70% of the samples were used for training and the remaining 30% were used for testing. Each complete voice message was treated as a single classification sample, with no within-clip segmentation performed before partitioning. This avoided distributing segments derived from the same audio recording across the training and test subsets. Speaker identity was not used as a partitioning criterion because persistent speaker identifiers were not retained in the anonymized dataset. Therefore, the partition was defined at the level of complete voice-message samples, and the reported performance represents evaluation under this sample-level protocol rather than a speaker-level partitioning protocol. To ensure a fair comparison under the same experimental settings, the same predefined partitioning was used for all feature and classifier configurations. Table 6 shows the class-wise distribution of the resulting subgroups.
Prior to classification, the extracted feature vectors were standardized using StandardScaler. The scaling was applied exclusively to the training set, and then to the test set using the measurement parameters derived from the training. This step reduces bias associated with the scale, provides more consistent input to classification models, and prevents test set information from affecting the feature standardization process.
Table 6. Class-wise distribution of the training and testing subsets
|
Class |
Total Instances |
Training Instances (70%) |
Testing Instances (30%) |
|
Bullying |
422 |
295 |
127 |
|
Toxic |
307 |
215 |
92 |
|
Positive |
308 |
215 |
93 |
|
Neutral |
231 |
162 |
69 |
|
Total |
1268 |
887 |
381 |
4.5 Classification models
One-dimensional acoustic feature vectors, obtained after feature extraction and standardization, were used as inputs to train four machine learning classifiers: namely, logistic regression (LR), k-nearest neighbors (KNN), random forest (RF), and SVM [37]. This combination was chosen because of the variety of decision-making processes that suit the resulting acoustic feature space, including linear, distance-based, margin-based, and cluster tree-based decision strategies. LR was considered as a simple linear classifier, while SVM was chosen for its ability to handle complex decision boundaries, KNN was included to exploit the similarity of speech signals through local distance metrics, and RF was included as a tree-based classifier capable of handling heterogeneous acoustic variation. Together, these classifiers allow the study to examine how different decision-making strategies respond to extracted speech representations. All classifiers were implemented using the scikit-learn library [38]. Table 7 summarizes the adopted hyperparameters.
The classifier hyperparameters were fixed across all acoustic feature configurations to maintain a consistent comparative setup. The adopted experimental design focused on evaluating the contribution and integration of the acoustic representations under common classification settings rather than improving the performance of each classifier individually. Therefore, no model-specific hyperparameter optimization was applied during the comparative evaluation. This approach avoids introducing tuning as an additional experimental factor and allows for the interpretation of observed performance differences primarily in light of the evaluated acoustic representations.
Table 7. Hyperparameter settings of the machine learning classifiers
|
Classifier |
Main Hyperparameters |
Setting Used |
|
RF |
n_estimators, max_depth, class_weight, criterion |
100, 5, balanced, gini |
|
LR |
solver, penalty, C, max_iter, class_weight |
saga, L2, 1.0, 500, balanced |
|
KNN |
n_neighbors, metric, weights |
5, minkowski / Euclidean, uniform |
|
SVM |
kernel, C, gamma, class_weight |
RBF, 1.0, scale, None |
Note: RF = random forest; LR = logistic regression; KNN = k-nearest neighbors; SVM = support vector machine; RBF = radial basis function.
4.6 Metrics
We evaluate our models using accuracy, precision, recall, and F1-score. This is done using a confusion matrix, which includes four distinct predictive classes: true positive (TP), true negative (TN), false positive (FP), and false negative (FN). The equations for these evaluation metrics are shown below [39, 40].
$\text{Accuracy}=\frac{TP+TN}{TP+TN+FP+FN}$ (6)
$\text{Precision}=\frac{\text{TP}}{\text{TP}+\text{FP}}$ (7)
$\text{Recall}=\frac{TP}{TP+FN}$ (8)
$\text{F}1-\text{Score}=2\times \frac{\text{Precision}\times \text{Recall}}{\text{Precision}+\text{Recall}}$ (9)
These metrics were chosen to provide a more comprehensive evaluation than mean accuracy and to better reflect effectiveness across the four target categories.
This section describes the experimental evaluation and analytical discussion of the suggested acoustic-based framework for multi-class hate speech categorization in Arabic dialectal speech. Different configurations of the acoustic features and machine learning classifiers were evaluated to assess the effectiveness of individual and fused acoustic representations.
5.1 Experimental setup
The experiments were conducted on 1,268 samples of Arabic dialectal speech, classified into four classes: bullying, toxic, neutral, and positive. The dataset was split 70% for training and 30% for testing, with 887 training samples and 381 testing samples.
The fifteen acoustic feature configurations were defined before model evaluation based on the four feature groups considered in this study: MFCC, log-Mel spectrogram, spectral contrast, and prosodic features. The configurations comprise all non-empty combinations of these groups, including four individual representations, six pairwise fusions, four three-feature fusions, and one full fusion. All fifteen configurations were evaluated and reported under the same predefined train–test partition and with the same set of four classifiers. Thus, no configuration was added or excluded based on its observed test performance. The best-performing configurations were identified only after completing this comparative evaluation for subsequent detailed analysis.
Experiments were run on a Lenovo ThinkPad E16 laptop powered by Intel®Core™ i7-1355U, 16 GB of RAM, 512 GB SSD, 2 GB NVIDIA®GeForce MX550 GPU, and running Windows (64-bit). The experiments were implemented using Python 3.6 (64-bit) in the Integrated Development and Learning Environment (IDLE) environment.
5.2 Results and discussion
The performance of all fifteen predefined acoustic feature configurations was evaluated using four machine learning classifiers. This design allows comparison among individual acoustic features and fused representations for the categorization of dialectal Arabic hate speech. Table 8 shows the aggregate accuracy results of all the acoustic feature combinations across the four machine learning classifiers.
As shown in Table 8, several configurations exceeded 90% accuracy, indicating that the extracted acoustic features contain discriminative information for this task.
Among the individual features, MFCC achieved the best performance of 95.28% with SVM and 93.44% with RF, indicating its effectiveness in capturing the global spectral envelope and speech-related frequency structure. Log-Mel spectrogram features also produced competitive results, reaching 88.98% with both RF and SVM. Spectral contrast achieved moderate performance. Prosodic characteristics gave the lowest results, indicating that pitch, energy, and zero-crossing cues alone were not sufficient to discriminate all classes.
Table 8. Accuracy (%) for all acoustic feature configurations
|
ID |
Feature Configuration |
Dimension |
RF |
LR |
KNN |
SVM |
|
Individual acoustic features |
||||||
|
1 |
MFCC |
40 |
93.44 |
60.37 |
85.56 |
95.28 |
|
2 |
Mel |
80 |
88.98 |
71.39 |
79.79 |
88.98 |
|
3 |
Spectral Contrast |
14 |
86.61 |
45.93 |
83.99 |
81.89 |
|
4 |
Prosodic |
6 |
79.00 |
46.98 |
73.23 |
64.57 |
|
Pairwise feature fusion |
||||||
|
5 |
MFCC + Mel |
120 |
91.60 |
79.00 |
85.30 |
93.44 |
|
6 |
MFCC + Contrast |
54 |
95.01 |
69.03 |
86.09 |
95.54 |
|
7 |
MFCC + Prosodic |
46 |
92.65 |
69.02 |
83.98 |
95.53 |
|
8 |
Mel + Contrast |
94 |
90.03 |
75.33 |
80.05 |
89.76 |
|
9 |
Mel + Prosodic |
86 |
92.13 |
77.95 |
82.68 |
90.81 |
|
10 |
Contrast + Prosodic |
20 |
87.66 |
55.64 |
80.84 |
85.04 |
|
Three-feature fusion |
||||||
|
11 |
MFCC + Mel + Contrast |
134 |
93.70 |
85.04 |
84.51 |
96.59 |
|
12 |
MFCC + Mel + Prosodic |
126 |
92.39 |
83.73 |
85.83 |
91.34 |
|
13 |
MFCC + Contrast + Prosodic |
60 |
92.91 |
71.92 |
86.61 |
95.80 |
|
14 |
Mel + Contrast + Prosodic |
100 |
90.81 |
81.63 |
82.94 |
92.13 |
|
Full feature fusion |
||||||
|
15 |
MFCC + Mel + Contrast + Prosodic |
140 |
96.33 |
90.81 |
83.99 |
94.23 |
Note: RF = random forest; LR = logistic regression; KNN = k-nearest neighbors; SVM = support vector machine; MFCC = Mel-Frequency Cepstral Coefficients.
Table 9. Class-wise performance of the best configurations from each feature group
|
MFCC + SVM |
MFCC + Contrast + SVM |
||||||
|
Class |
Precision (%) |
Recall (%) |
F1-score (%) |
Class |
Precision (%) |
Recall (%) |
F1-score (%) |
|
Positive |
92.08 |
97.89 |
94.90 |
Positive |
93.27 |
97.00 |
95.10 |
|
Toxic |
96.34 |
94.05 |
95.18 |
Toxic |
95.60 |
94.57 |
95.08 |
|
Neutral |
97.14 |
90.67 |
93.79 |
Neutral |
98.04 |
86.21 |
91.74 |
|
Bullying |
96.09 |
96.85 |
96.47 |
Bullying |
96.30 |
99.24 |
97.74 |
|
Macro average |
95.41 |
94.86 |
95.09 |
Macro average |
95.80 |
94.25 |
94.92 |
|
Weighted average |
95.35 |
95.28 |
95.27 |
Weighted average |
95.60 |
95.54 |
95.49 |
|
MFCC + Mel + Contrast + SVM |
MFCC + Mel + Contrast + Prosodic + RF |
||||||
|
Class |
Precision (%) |
Recall (%) |
F1-score (%) |
Class |
Precision (%) |
Recall (%) |
F1-score (%) |
|
Positive |
95.10 |
100.00 |
97.49 |
Positive |
92.71 |
97.80 |
95.19 |
|
Toxic |
97.75 |
94.57 |
96.13 |
Toxic |
98.06 |
98.06 |
98.06 |
|
Neutral |
95.83 |
94.52 |
95.17 |
Neutral |
98.39 |
96.83 |
97.60 |
|
Bullying |
97.46 |
96.64 |
97.05 |
Bullying |
96.67 |
93.55 |
95.08 |
|
Macro average |
96.54 |
96.43 |
96.46 |
Macro average |
96.46 |
96.56 |
96.48 |
|
Weighted average |
96.62 |
96.59 |
96.58 |
Weighted average |
96.38 |
96.33 |
96.33 |
Note: SVM = support vector machine; MFCC = Mel-Frequency Cepstral Coefficients; RF = random forest.
Pairwise fusion was most effective when MFCC was combined with another complementary feature group. The best paired outcome was achieved using MFCC + spectral contrast with SVM, reaching an accuracy of 95.54%. This indicates that spectral contrast complements MFCC by providing complementary information about spectral variation. In the absence of MFCC, the pairwise combinations were often weaker, demonstrating that MFCC served as a more stable core feature.
In the case of three-feature fusion, the highest accuracy of 96.59% was achieved using a combination of MFCC, log-Mel spectrogram, and spectral contrast with the SVM classifier. This combination provides robust acoustic fusion because it incorporates three complementary types of information: global spectral envelope information, Mel-scale distribution of energy, and spectral variation information. This combination provided the highest classification performance among the evaluated feature configurations.
The full feature fusion also performed strongly, with RF achieving 96.33%, but it did not outperform the best three-feature spectral fusion. This indicates that adding all available features does not necessarily improve classification performance. The overall performance pattern further shows that the high accuracy was not uniform across all experimental settings. Prosodic-only features and LR produced substantially lower results, whereas the highest accuracy was achieved only when complementary spectral features were fused. This suggests that the improvement was mainly related to the discriminative quality of the evaluated acoustic representations rather than simply increasing the number of features.
The performance pattern also provides insight into the acoustic information associated with the assigned categories. In particular, the weaker results for prosodic-only features compared with spectral representations indicate that discrimination was not driven solely by general differences in pitch, energy, or speaking dynamics. Instead, the results indicate that complementary spectral characteristics contributed substantially to distinguishing the four classes. Since lexical content was not explicitly modeled, these features should be interpreted as capturing discriminative acoustic patterns associated with the predefined categories rather than directly encoding their lexical or semantic meaning.
For a more detailed class-wise analysis, the best-performing configuration from each feature group is analyzed in Table 9.
This class-wise analysis shows whether the increase in accuracy is uniform across classes or dominated by certain classes. MFCC alone with SVM achieved strong F1-scores across all classes, ranging from 93.79% to 96.47%, indicating balanced individual-feature performance. The pairwise fusion of MFCC + spectral contrast improved the identification of toxic and bullying, with F1-scores of 95.08% and 97.74%, respectively, suggesting that the additional spectral variation captured by spectral contrast provided complementary discriminative information for these classes. The best three-feature configuration achieved the strongest class-wise performance, with macro and weighted F1-scores of 96.46% and 96.58%, respectively. These results further indicate that the fusion of MFCC, Mel, and spectral contrast provides complementary acoustic information for discriminating across both harmful and non-harmful classes.
To further examine the consistency of this best-performing configuration, the MFCC + log-Mel spectrogram + spectral contrast representation with SVM was evaluated over five runs using different random 70/30 sample-level splits. Table 10 presents the results as mean ± standard deviation (SD) for accuracy, weighted precision, weighted recall, weighted F1-score, and macro F1-score. The configuration consistently maintained high performance across repeated evaluations, achieving an accuracy of 95.96% ± 0.30% with similarly low variance across the remaining metrics, while the 95% confidence interval for average accuracy was 95.59%–96.33%. The small standard deviations across the reported metrics and the relatively narrow confidence interval indicate limited variability from run to run, supporting the stability of the chosen configuration under the approved sample-level evaluation protocol.
Table 10. Performance stability of the best-performing configuration across five runs
|
Metric |
Mean ± SD (%) |
|
Accuracy |
95.96 ± 0.30 |
|
Weighted Precision |
96.06 ± 0.28 |
|
Weighted Recall |
95.96 ± 0.30 |
|
Weighted F1-score |
95.95 ± 0.31 |
|
Macro F1-score |
95.91 ± 0.40 |
|
Accuracy 95% CI |
95.59 – 96.33 |
Note: SD = standard deviation; CI = confidence interval.
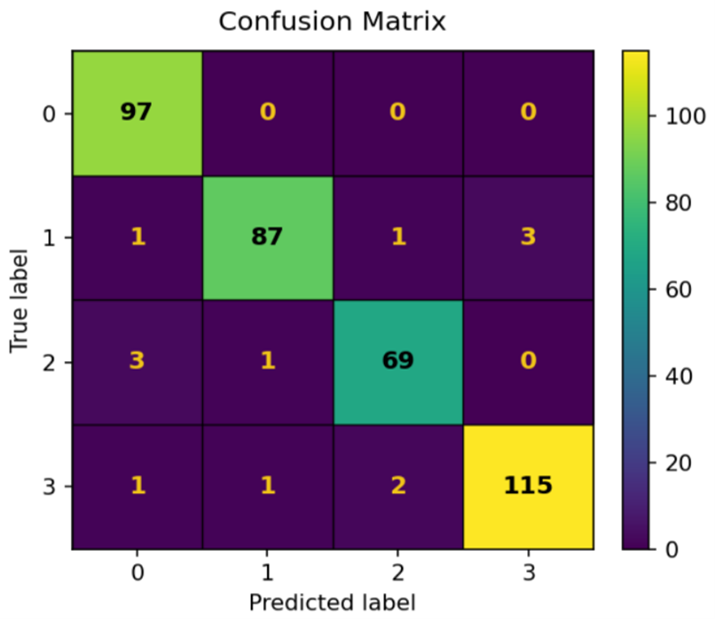
Figure 7 illustrates the confusion matrix for the best-performing configuration, which is MFCC + log-Mel spectrogram + spectral contrast with SVM, providing a class-level view of the remaining classification errors. The model correctly classified 97 positive samples, 87 toxic samples, 69 neutral samples, and 115 bullying samples. The most prominent error pattern was among the harmful categories, with three Toxic samples classified as bullying. This confusion may reflect the overlap of acoustic features between these categories, while their annotation distinction relies substantially on communicative intent and whether the offensive content is directed at a specific target, information that is not explicitly represented by the adopted acoustic features. Another noticeable error pattern included three Neutral samples classified as Positive, suggesting some acoustic similarity between non-harmful utterances. Other misclassifications were comparatively limited. In general, the confusion matrix indicates strong class separation between classes, while the residual errors mainly reflect acoustic overlap between specific class pairs.
Figure 7. Confusion matrix for the support vector machine (SVM) classifier using the Mel-frequency cepstral coefficients (MFCC) + log-Mel spectrogram + spectral contrast feature fusion
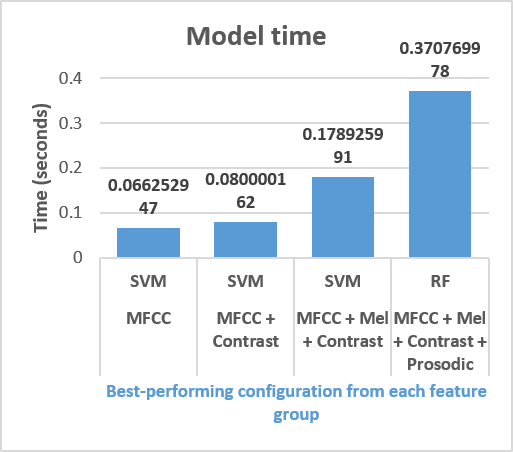
Figure 8. Model execution time of the best-performing configurations from each feature group
Figure 8 shows the model execution time of the selected best configurations from each feature group. The reported time includes both training and prediction time. The best-performing feature set, MFCC + log-Mel spectrogram + spectral contrast, required only 0.1789 seconds using SVM. This indicates that the selected feature fusion achieved high classification performance without introducing substantial computational cost. Therefore, this configuration provides a strong balance between accuracy and efficiency.
Finally, paired t-tests were performed as a complementary statistical study to analyze the significance of the differences in performance of the classifiers while using the identical acoustic feature configurations. The test was applied to the accuracy vectors obtained by each classifier using the 15 feature configurations, where each paired value corresponded to the same feature configuration under the same predetermined train/test split. Statistical significance was set at a threshold of 0.05, and p-values < 0.05 were considered to indicate statistically significant differences. According to Table 11, no statistically significant difference was detected between SVM and RF (p = 0.4790) across the evaluated feature configurations. In contrast, the comparisons between SVM and KNN, SVM and LR, RF and KNN, RF and LR, and KNN and LR were statistically significant. These results indicate that SVM and RF generally provided stronger performance than KNN and LR across the considered feature configurations. Since the paired comparison was based on the accuracy values obtained across the 15 feature configurations under the original train–test partition, rather than on repeated runs of each classifier–feature configuration, the statistical results are interpreted as a complementary comparison of classifier performance across the evaluated feature sets.
Table 11. Paired t-test comparison among classifiers
|
Comparison |
t-Statistic |
p-Value |
Significant at 0.05 |
|
SVM vs. RF |
−0.7273 |
0.4790 |
No |
|
SVM vs. KNN |
4.9006 |
0.0002 |
Yes |
|
SVM vs. LR |
7.4977 |
<0.0001 |
Yes |
|
RF vs. KNN |
13.4448 |
<0.0001 |
Yes |
|
RF vs. LR |
7.1352 |
<0.0001 |
Yes |
|
KNN vs. LR |
3.7873 |
0.0020 |
Yes |
Note: RF = random forest; LR = logistic regression; KNN = k-nearest neighbors; SVM = support vector machine.
This study demonstrates the potential of acoustic information for multi-class hate speech detection within the evaluated Arabic dialectal speech setting. Instead of relying on textual transcription, the study investigated whether acoustic representations extracted directly from voice messages can discriminate among the predefined bullying, toxic, neutral, and positive speech categories. Experiments were performed on a real-world annotated dataset of Iraqi dialectal speech, evaluating fifteen acoustic feature configurations using four machine learning classifiers. The results indicated that spectral representations were more discriminative than prosodic-only features, with MFCC providing the strongest individual representation. The best performance was obtained by combining MFCC, log-Mel spectrogram, and spectral contrast with SVM, achieving an accuracy of 96.59%. The fact that this spectral combination outperformed the full feature fusion further indicates that adding prosodic information did not provide additional improvement to the best-performing representation. Overall, these findings suggest that the observed classification performance is not driven solely by general prosodic characteristics such as pitch, energy, or speaking dynamics, but benefits substantially from complementary spectral information. However, because lexical content is not explicitly modeled, the extracted representations should be interpreted as capturing discriminative acoustic patterns associated with the predefined categories rather than directly encoding their lexical or semantic meaning. Class-wise results indicated strong discrimination across the four categories, in particular for bullying and toxic speech. The confusion matrix further showed that the remaining errors included confusion between toxic and bullying and between Neutral and Positive, suggesting some overlap in their acoustic representations. The statistical analysis indicated that SVM and RF generally provided stronger performance than KNN and LR across the evaluated feature configurations. Although the obtained results are encouraging, the current study is limited by the relatively small dataset and the absence of persistent speaker identifiers in the anonymized data. Consequently, possible speaker-related effects cannot be completely excluded, and strict speaker-independent generalization could not be directly assessed under the current evaluation protocol. The evaluation is also limited to a single Iraqi dialectal speech dataset without external validation; therefore, the reported findings should not be interpreted as evidence of generalization across Arabic dialects or deployment settings. Future work will expand the dataset, increase speaker diversity, retain anonymized speaker-level identifiers for controlled speaker-independent evaluation, include additional Arabic dialects, and evaluate learned and pretrained speech representations, including Wav2Vec-based and transformer-based approaches, alongside phonetic, lexical, and multimodal information.
The authors wish to convey their profound gratitude to Shaimaa Hameed Shaker (Ph.D. in Computer Science/Pattern Recognition), Nada Hussain Ali (Ph.D. in Computer Science/Artificial Intelligence), and Mohammed Zghair Nafil (B.A. in Arabic Language) for their indispensable support in the manual classification of the speech dataset, which significantly contributed to improving the reliability of the dataset used in this study. The authors also express their sincere gratitude to the volunteers who participated in the creation of the speech dataset.
[1] Saumya, S., Kumar, A., Singh, J.P. (2024). Filtering offensive language from multilingual social media contents: A deep learning approach. Engineering Applications of Artificial Intelligence, 133: 108159. https://doi.org/10.1016/j.engappai.2024.108159
[2] Al-Saqqa, S., Awajan, A., Hammo, B. (2024). A survey of hate speech detection for Arabic social media: Methods and datasets. Procedia Computer Science, 251: 224-231. https://doi.org/10.1016/j.procs.2024.11.104
[3] König, K. (2024). Transmodal messenger interaction–Analysing the sequentiality of text and audio postings in WhatsApp chats. Discourse, Context & Media, 62: 100818. https://doi.org/10.1016/j.dcm.2024.100818
[4] Passetti, R.R., Madureira, S., Barbosa, P.A. (2022). Voice perception on a voice messaging app: Implications for Forensic Phonetics. In Speech Prosody 2022, pp. 490-494. https://doi.org/10.21437/SpeechProsody.2022-100
[5] Do, H.B., Huynh, V.L.P., Nguyen, L.T. (2025). ViToSA: Audio-based toxic spans detection on Vietnamese speech utterances. In Interspeech 2025, ISCA, pp. 4013-4017. https://doi.org/10.21437/Interspeech.2025-1958
[6] Bäckström, T. (2025). Privacy in speech technology. Proceedings of the IEEE, 113(7): 668-692. https://doi.org/10.1109/JPROC.2025.3632102
[7] Besdouri, F.Z., Zribi, I., Belguith, L.H. (2024). Arabic automatic speech recognition: challenges and progress. Speech Communication, 163: 103110. https://doi.org/10.1016/j.specom.2024.103110
[8] Sullivan, P., Elmadany, A., Abdul-Mageed, M. (2023). On the robustness of Arabic speech dialect identification. arXiv preprint arXiv.2306.03789. https://doi.org/10.48550/arXiv.2306.03789
[9] Jahan, M.S., Oussalah, M. (2023). A systematic review of hate speech automatic detection using natural language processing. Neurocomputing, 546: 126232. https://doi.org/10.1016/j.neucom.2023.126232
[10] Yuan, S.Z., Maronikolakis, A., Schütze, H. (2022). Separating hate speech and offensive language classes via adversarial debiasing. In Proceedings of the Sixth Workshop on Online Abuse and Harms (WOAH), Seattle, Washington, pp. 1-10. https://doi.org/10.18653/v1/2022.woah-1.1
[11] Abdelsamie, M.M., Azab, S.S., Hefny, H.A. (2024). A comprehensive review on Arabic offensive language and hate speech detection on social media: Methods, challenges and solutions. Social Network Analysis and Mining, 14: 111. https://doi.org/10.1007/s13278-024-01258-1
[12] ALBayari, R., Abdallah, S. (2022). Instagram-based benchmark dataset for cyberbullying detection in Arabic text. Data, 7(7): 83. https://doi.org/10.3390/data7070083
[13] Ahmad, A., Azzeh, M., Alnagi, E., et al. (2024). Hate speech detection in the Arabic language: Corpus design, construction, and evaluation. Frontiers in Artificial Intelligence, 7: 1345445. https://doi.org/10.3389/frai.2024.1345445
[14] Charfi, A., Besghaier, M., Akasheh, R., Atalla, A., Zaghouani, W. (2024). Hate speech detection with ADHAR: A multi-dialectal hate speech corpus in Arabic. Frontiers in Artificial Intelligence, 7: 1391472. https://doi.org/10.3389/frai.2024.1391472
[15] Suryawanshi, S., Chakravarthi, B.R., Arcan, M., Buitelaar, P. (2020). Multimodal meme dataset (MultiOFF) for identifying offensive content in image and text. In Proceedings of the Second Workshop on Trolling, Aggression and Cyberbullying, Marseille, pp. 32-41. https://doi.org/10.13025/21394
[16] Kiela, D., Firooz, H., Mohan, A., et al. (2020). The hateful memes challenge: Detecting hate speech in multimodal memes. In Proceedings of the 34th International Conference on Neural Information Processing Systems, Vancouver, BC, Canada, pp. 2611-2624. https://dl.acm.org/doi/10.5555/3495724.3495944.
[17] Das, M., Raj, R., Saha, P., Mathew, B., Gupta, M., Mukherjee, A. (2023). HateMM: A multi-modal dataset for hate video classification. Proceedings of the International AAAI Conference on Web and Social Media, 17(1): 1014-1023. https://doi.org/10.1609/icwsm.v17i1.22209
[18] Céspedes-Sarrias, B., Collado-Capell, C., Rodenas-Ruiz, P., Hrynenko, O., Cavallaro, A. (2025). MM-HSD: Multi-modal hate speech detection in videos. In Proceedings of the 33rd ACM International Conference on Multimedia, Dublin, Ireland, pp. 2546-2555. https://doi.org/10.1145/3746027.3754558
[19] Ghosh, S., Lepcha, S., Sakshi, S., Shah, R.R., Umesh, S. (2022). DeToxy: A large-scale multimodal dataset for toxicity classification in spoken utterances. In Interspeech 2022, pp. 5185-5189. https://doi.org/10.21437/Interspeech.2022-10752
[20] Costa-jussà, M.R., Meglioli, M.C., Andrews, P., et al. (2024). MuTox: Universal multilingual audio-based toxicity dataset and zero-shot detector. In Findings of the Association for Computational Linguistics: ACL 2024, Bangkok, Thailand, pp. 5725-5734. https://doi.org/10.18653/v1/2024.findings-acl.340
[21] Gupta, V., Sharon, R., Sawhney, R., Mukherjee, D. (2022). ADIMA: Abuse detection in multilingual audio. In ICASSP 2022 - 2022 IEEE International Conference on Acoustics, Speech and Signal Processing (ICASSP), Singapore, Singapore, pp. 6172-6176. https://doi.org/10.1109/ICASSP43922.2022.9746718
[22] Niebuhr, O. (2022). Prosody in hate speech perception: A step towards understanding the role of implicit prosody. In Proceedings of the 11th International Conference on Speech Prosody, Lisbon, Portugal, pp. 520-524. https://doi.org/10.21437/SpeechProsody.2022-106
[23] Spiesberger, A.A., Triantafyllopoulos, A., Tsangko, I., Schuller, B.W. (2023). Abusive speech detection in Indic languages using acoustic features. In Interspeech 2023, pp. 2683-2687. https://doi.org/10.21437/Interspeech.2023-789
[24] An, J., Lee, W., Jeon, Y., Ok, J., Kim, Y., Lee, G.G. (2024). An investigation into explainable audio hate speech detection. In Proceedings of the 25th Annual Meeting of the Special Interest Group on Discourse and Dialogue, Kyoto, Japan, pp. 533-543. https://doi.org/10.18653/v1/2024.sigdial-1.45
[25] Ranjan, R., Pipariya, K., Vatsa, M., Singh, R. (2025). SynHate: Detecting hate speech in synthetic deepfake audio. In Interspeech 2025, pp. 5623-5627. https://doi.org/10.21437/Interspeech.2025-2659
[26] Bhesra, K., Shukla, S.A., Agarwal, A. (2024). Audio vs. text: Identify a powerful modality for effective hate speech detection. Tiny Papers at ICLR 2024.
[27] Nafea, Y., Shehata, S., Talat, Z., Aboeitta, A., Sharshar, A., Nakov, P. (2024). AraOffense: Detecting offensive speech across dialects in Arabic media. In Interspeech 2024, Kos, Greece, pp. 4303-4307. https://doi.org/10.21437/Interspeech.2024-2077
[28] Vidgen, B., Derczynski, L. (2020). Directions in abusive language training data, a systematic review: Garbage in, garbage out. PLoS ONE, 15(12): e0243300. https://doi.org/10.1371/journal.pone.0243300
[29] Seemann, N., Lee, Y.S., Höllig, J., Geierhos, M. (2023). The problem of varying annotations to identify abusive language in social media content. Natural Language Engineering, 29(6): 1561-1585. https://doi.org/10.1017/S1351324923000098
[30] Wich, M., Eder, T., Al Kuwatly, H., Groh, G. (2022). Bias and comparison framework for abusive language datasets. AI and Ethics, 2: 79-101. https://doi.org/10.1007/s43681-021-00081-0
[31] Fortuna, P., Dominguez, M., Wanner, L., Talat, Z. (2022). Directions for NLP practices applied to online hate speech detection. In Proceedings of the 2022 Conference on Empirical Methods in Natural Language Processing, Abu Dhabi, United Arab Emirates, pp. 11794-11805. https://doi.org/10.18653/v1/2022.emnlp-main.809
[32] Almohaimeed, S., Shafin, A.A., Carbunar, B., Bölöni, L. (2023). THOS: A benchmark dataset for targeted hate and offensive speech. arXiv preprint arXiv.2311.06446. https://doi.org/10.48550/arXiv.2311.06446
[33] Negroni, V., Salvi, D., Comanducci, L., et al. (2026). LJ-TTS: A paired real and synthetic speech dataset for single-speaker TTS analysis. Electronics, 15(1): 169. https://doi.org/10.3390/electronics15010169
[34] Horkous, H. (2025). Speech emotion recognition in Arabic language: A review. Vietnam Journal of Computer Science, 1-18. https://doi.org/10.1142/S2196888825300029
[35] Al-Latief, S.T.A., Yussof, S., Ahmad, A., Khadim, S.M., Alkhayyat, A. (2025). WAR strategy algorithm-based hybrid optimization for accurate and rapid speech recognition. Iraqi Journal for Computer Science and Mathematics, 6(1): 169-184. https://doi.org/10.52866/2788-7421.1243
[36] Kaloub, A., Abed Elgabar, E. (2025). Speech-based techniques for emotion detection in natural Arabic audio files. The International Arab Journal of Information Technology, 22(1): 139-156. https://doi.org/10.34028/iajit/22/1/11
[37] Farhan, N.S., Abdulmunim, M.E., Abdullah, H.S. (2025). Hate speech detection using optimized feature representation via spiral-grey wolf optimizer-based machine learning approaches. Journal of Soft Computing and Computer Applications, 2(2): 1020. https://doi.org/10.70403/3008-1084.1020
[38] Alshammari, A.H., Bencsik, G., Ali, A.H. (2026). A survey of six classical classifiers, including algorithms, methodological characteristics, foundational variants, and recent advances. Algorithms, 19(1): 37. https://doi.org/10.3390/a19010037
[39] Alfarhany, A.A.R., Abdullah, N.A.Z. (2023). Iraqi sentiment and emotion analysis using deep learning. Journal of Engineering, 29(9): 150-165. https://doi.org/10.31026/j.eng.2023.09.11
[40] Saadi, Z.M., Sadiq, A.T., Akif, O.Z., Eid, M.M. (2024). Enhancing image classification using a convolutional neural network model. Journal of Soft Computing and Computer Applications, 1(2): 1010. https://doi.org/10.70403/3008-1084.1010