Sebastián Ramos-Cosi | Brigitte Torres-Pinedo | Ana Huamani-Huaracca*
© 2026 The authors. This article is published by IIETA and is licensed under the CC BY 4.0 license (http://creativecommons.org/licenses/by/4.0/).
OPEN ACCESS
Driver drowsiness and fatigue can impair alertness and increase crash risk, yet many monitoring systems rely on computationally intensive models or hardware unsuitable for low-cost embedded deployment. This study develops and evaluates a real-time vision-based driver monitoring prototype using eye aspect ratio (EAR) and yawning metric (YAWN) features implemented on a Raspberry Pi 4 Model B. Facial regions are detected from live video, eye and mouth landmarks are analyzed, and threshold-based decisions are used to identify visual signs associated with prolonged eye closure and yawning. Thresholds of EAR = 0.26 and YAWN = 8.33 were established during preliminary calibration. The prototype was evaluated under controlled laboratory conditions with 30 participants and 200 manually labeled events. It correctly identified 86 hazardous events and 96 normal states, with 8 false positives and 10 false negatives, yielding 91.0% accuracy, 91.5% precision, 89.6% recall, and a 90.5% F1-score. On the embedded platform, the system processed video at an average of 22.4 frames per second, with 44.6 ms processing time per frame and 320 ms mean alert latency. Expert assessment produced an overall functional suitability score of 95.4% with an intraclass correlation coefficient (ICC) of 0.885. The results indicate that the prototype can provide low-cost, local, real-time monitoring of visual drowsiness and fatigue cues, although validation under natural driving, variable illumination, occlusion, and longer-duration use remains necessary.
driver monitoring system, driver drowsiness detection, eye aspect ratio, yawning detection, embedded vision, Raspberry Pi, real-time computer vision
Road traffic accidents are considered one of the most significant public health problems worldwide. The World Health Organization (WHO) estimates that between 1.19 and 1.35 million deaths and between 20 and 50 million injuries occur each year as a result of road traffic accidents, many of which lead to permanent disabilities [1]. Furthermore, globally, road traffic-related deaths rank approximately 8th to 10th and account for between 2% and 2.5% of all fatalities [2, 3]. Consequently, it is extremely concerning that road traffic accidents are also the leading cause of death among people aged 5 to 29 (children, adolescents, and young adults), and that the majority of fatalities are male [4, 5].
One of the most significant contributing factors to traffic accident injuries is driving under the influence of alcohol. International studies indicate that between 6% and 7% of all traffic accident injuries can be attributed to driving under the influence of alcohol, and that in some countries, alcohol-related fatal accidents account for between 10% and 60% [6]. Research has also shown that people who drive with a blood alcohol level above the legal limit are 18 times more likely to be involved in fatal accidents than a sober driver [7, 8].
Research has shown that driver fatigue, more than driving under the influence of alcohol, contributes to a higher rate of accidents with injuries, between 30% and 35% [9]. Furthermore, the combination of drowsiness and alcohol consumption increases both the number of accidents caused by drowsy drivers and their severity. Consequently, interest in developing intelligent driver monitoring systems has grown in recent years. Recent technological advances in computer vision and image analysis enable existing facial and emotional recognition technologies to detect fatigue, drowsiness, or impaired abilities resulting from alcohol consumption [10-12]. These systems can provide real-time analysis of facial expressions, head movements, and other visual indicators of the driver's condition; therefore, they represent an excellent opportunity to improve road safety, justifying the approach of this study.
Notably, alcohol consumption is not being considered as a condition diagnosed directly by the system, but as one of the causes of visually observable changes in driver behavior. In addition, these changes manifest themselves in prolonged eye closure, decreased visual attention, frequent yawning (YAWN), and other signs such as reduced alertness. So the system proposed in the study does not measure blood alcohol concentration or replace specialized devices that already measure alcohol level. Therefore, the purpose of the system is to recognize visual cues from the driver through analysis of the eyes and mouth using eye aspect ratio (EAR) and YAWN. Therefore, the main contribution of the study is the development of a low-cost prototype for intelligent monitoring, capable of locally processing a video stream and issuing warnings when signs of fatigue, drowsiness, or reduced ability to drive safely are detected.
In summary, this study aims to develop an intelligent driver-state monitoring system for the detection of visual signs of drowsiness, fatigue, and possible impaired driving ability in real time through analysis of the eyes and mouth region. The proposed system uses a camera positioned in front of the driver to capture and analyze facial expressions, eye activity, mouth movements, and head position, enabling the timely generation of alerts when a potentially hazardous state is detected.
2.1 Background studies
The growth of computer vision and deep learning technologies in the last few years has led to an increase in the precision of facial expression recognition (FER). These technologies are used in many areas, including security, human-computer interaction, and intelligent transportation systems. Driver behavior analysis is one of the areas where attention is being focused on the use of FER. The fact that a person's face represents how they feel/are emotionally or physically creates a lot of potential for using this information to identify fatigue, drowsiness, and/or emotional instability while behind the wheel.
Multiple research studies provide proof that deep learning techniques are successful in accomplishing this. Convolutional neural networks (CNNs) have been used to establish how accurately facial expression analyses can predict driver behavior through visual observations of various facial expressions in real time [13]. Overall accuracy was over 98%, showing that when using this technique to monitor the driver's use of their face; therefore, one can conclude that it is a valid methodology. Multiple other investigations have evaluated ways to determine if a driver is fatigued by monitoring their eye and/or mouth movements. On this topic, results show that detecting whether a driver is fatigued using typical performance measures of 96% for eye movement analyses and 94% for mouth movement analyses indicates the applicability of employing this type of biometric data [11].
Various studies have shown the importance of developing lightweight models that can be used on embedded systems. For example, one study focuses on creating a model system to detect real-time driver eyelid closure levels and provide timely alerts for drowsiness [14]. Likewise, many of the other studies included in the current review demonstrated high performance using modern deep learning architectures that have limited computational resources [15]. Accordingly, there is now sufficient evidence from the literature to support that early detection of driver drowsiness and fatigue using deep learning techniques can positively impact overall road safety.
2.2 Computer vision methods for driver monitoring
Current FER methodology primarily uses CNNs for image analysis. These tools automatically detect important image features, such as eye shape, mouth position, and head angle. Furthermore, they can efficiently process image data and produce high classification accuracy at very high speeds, including real-time results [16]. Therefore, they are an ideal choice for driver monitoring, where speed is a critical factor.
When measuring fatigue detection, using more than one method to find out about fatigue at the same time can help create a higher level of accuracy. For instance, combining the head position, facial expression, and eye movement data can drastically increase fatigue detection ability. A study [15] provided a model for measuring driving behavior using facial feature analysis and physiological measures that improved driver-state measurement ability significantly in a highly controlled environment. Much of the present-day technology available to help determine fatigue may be very complicated or require large amounts of processing power in order to take place accurately and in real-time. In this regard, one of the key goals of modern research is to develop effective yet lightweight systems capable of operating in real time and providing timely warnings to drivers about potentially dangerous situations.
The method chosen to create a prototype driver monitoring system is Extreme Programming (XP). This methodology is part of the agile software development methodologies created by Kent Beck. It allows for rapid response to changes in requirements, fosters close collaboration between developers and clients, utilizes iterative development, and promotes rapid software development through continuous client feedback and constant testing of the developed software [17-19].
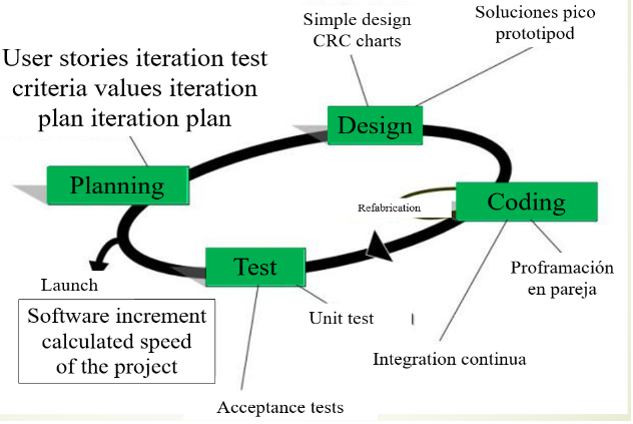
The use of the XP methodology enabled the development of a driver FER system prototype through iterations. Furthermore, the prototype development was carried out in a series of iterations, each of which included the four phases: planning, design, coding, and testing. The iterative method of prototype development allowed for continuous improvement of the system and the adaptation of its functional requirements throughout the development process.
During the planning phase, the needs of potential users were analyzed through user stories, which described the system's main features (face detection, facial analysis, and alert mechanism). Once these features were identified and prioritized, they were organized into small groups of development cycles called iterations. In the next stage of system architecture development, the overall architecture for the computer vision system was defined (face detection module, facial expression analysis module, and alert signal generation module), and the technologies to be used for implementing each module were determined. The Python programming language, the Open-Source Computer Vision Library (OpenCV) computer vision library, and the Raspberry Pi hardware platform were selected.
The software development processes described in the previous section followed the initial system architecture and allowed for the incremental development of its features. Throughout development, the software was developed using standardized coding principles and clean coding to ensure the system would be easy to maintain and develop in the future. Finally, the software underwent various tests, including functional tests of the face detection and facial feature analysis functions, to verify that the scientists' software development yielded the expected results. The system was then subjected to integration testing to confirm that all its components worked together as a complete and fully integrated system. The complete software development process is illustrated in Figure 1, created using the XP methodology.
Figure 1. Extreme Programming (XP) development cycle used in the proposed system
3.1 Application of Extreme Programming methodology in the proposed system
3.1.1 Planning
During this planning phase, we collected and analyzed the requirements for the new system. In addition, we distributed a questionnaire to a group of 20 people with sufficient knowledge and/or experience regarding traffic accidents resulting from driving under the influence of alcohol. This questionnaire allowed us to determine the most important functional requirements for the project and create user stories describing the main tasks the prototype will perform. The user stories are presented in Table 1.
Table 1. User stories
|
No. |
User Stories |
|
1 |
The system must use a database of facial images to recognize a person detected by the camera. |
|
2 |
The system must analyze previously collected images to identify facial features, facial expressions, and gestures. |
|
3 |
The system must compare the image received from the camera with images in the database to determine whether facial expressions match. |
|
4 |
The system must calculate the percentage of similarity between an image from the database and the image detected by the camera. |
|
5 |
The system shall generate a warning if signs of facial expressions associated with a potentially dangerous driver condition are detected. |
3.1.2 Design
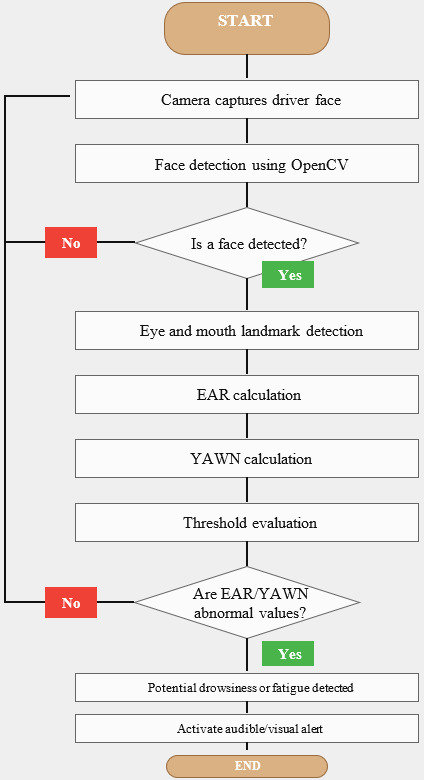
At the beginning of the facial feature analysis design phase, a logical framework was developed for the step-by-step procedures of analyzing a driver's face. This procedure consists of an algorithm represented by a flowchart that describes the required operations. The flowchart also shows all the main processes that occur when an image passes through the system and illustrates the interrelationship between the functions of the facial feature analysis. The system will first capture an image of the face using an electronic camera. Once the image is captured, the facial feature analysis will begin processing it by identifying the location of key facial features within the image space. The key facial features to be identified are the location of the eyes, eyebrows, mouth, and other distinctive facial features. Once these features are identified, they will be used to create a combined set of characteristics that reflects the person's facial expression.
After taking the photograph, the system checks if it has been uploaded correctly and finishes processing. If not, it continues trying to collect and analyze the data until it succeeds. This process reduces errors in facial feature detection and analysis, resulting in more reliable performance. Once a face is detected, the facial feature analysis algorithm identifies the eye and mouth regions and extracts the visual features required to calculate the EAR and YAWN.
When detecting an identified face, the system records its unique characteristics. Then those characteristics are compared with all other facial expressions stored in the database. This will determine how closely similar the identified expression was to each of those stored expressions. Finally, data collected based on facial expressions is interpreted to identify when someone has exhibited facial expressions indicating a risk to themselves while driving, such as exhibiting signs of drowsiness, fatigue, or reduced alertness; at which point an alert will be sent to the driver to help enable safer driving (see Figure 2).
Figure 2. Facial feature analysis
3.2 Development tools
The proposed driver monitoring system requires various software and hardware resources to implement and develop an interface. The resources are selected based on their capabilities to process images quickly and easily integrate with embedded computer systems/electronic devices. The list below details the resources selected:
•The development environment/training system used to design the software for the driver monitoring system was the PyCharm integrated development environment (IDE). The PyCharm IDE is very common for writing software in the Python programming language. It has many excellent tools for writing, debugging, and testing the program code.
•The OpenCV library was used to develop the computer vision algorithms for the driver monitoring system. OpenCV is one of the most widely used cross-platform libraries for image and video processing. It provides extensive functions for face detection, image processing, and facial feature analysis, making it suitable for real-time driver monitoring.
•An image-capturing device (the webcam) will be used as a means of instantaneously capturing images of the driver for facial monitoring (the driver image will be sent to the Raspberry Pi for facial feature processing). The webcam will be mounted in front of the driver and directed toward the driver's face in the car and aimed directly at the driver's face, allowing continuous monitoring of the driver's facial expressions and the driver's actions or behavior out of the car window.
•A Raspberry Pi single-board computer is used as the overall computer system to run the driver/vehicle monitoring application. The Raspberry Pi is small in size and has very low power requirements, making it an ideal device to be integrated into a vehicle-based driver monitoring system. The Raspberry Pi will process the driver images from the webcam and perform facial feature processing on the images.
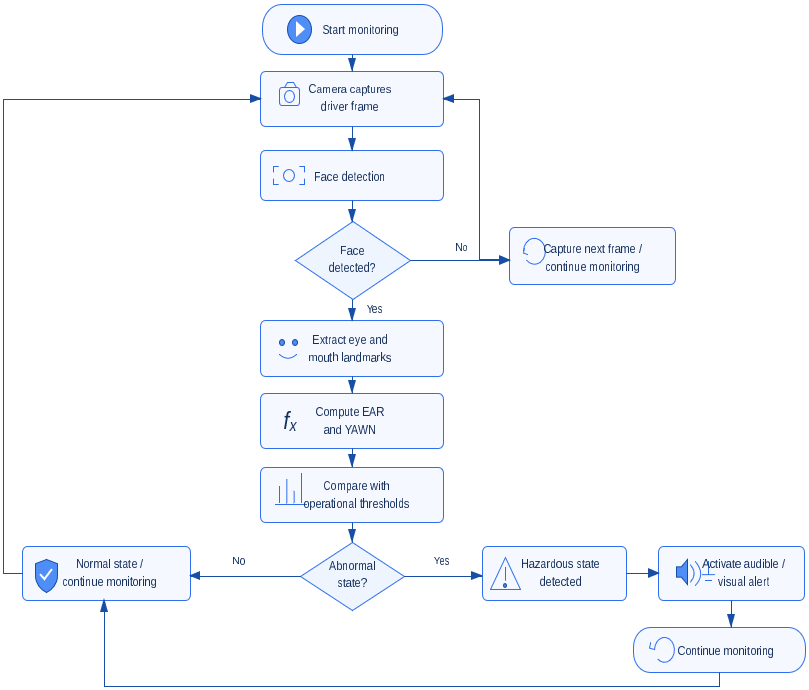
Using these technologies, a prototype has been created that analyzes the driver's facial expression immediately after capturing an image of their face in real time. Once the image is captured, the system uses face detection and feature analysis tools to identify and analyze relevant regions of the driver's face. With this information, the system detects whether the driver shows signs of fatigue, drowsiness, or another potentially hazardous driver state. If so, it activates an alert mechanism that emits a sound in the vehicle to warn the driver of the potential danger. This gives them enough time to react and, hopefully, avoid an accident. A general description of the system's operation is shown in Figure 3.
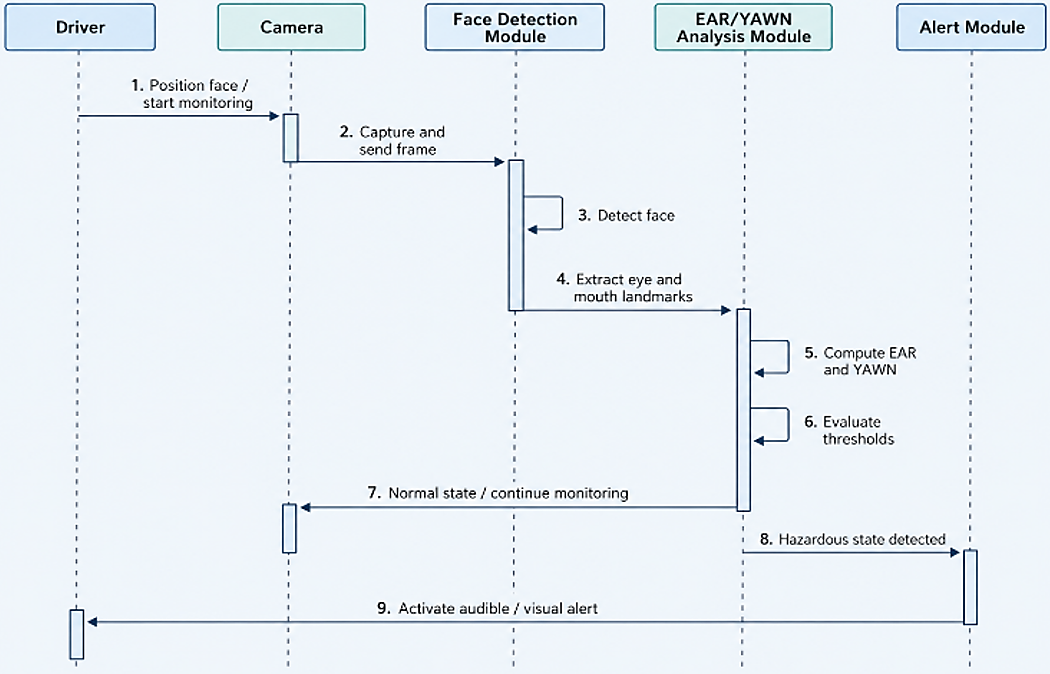
The architecture of the driver monitoring system consists of multiple layers, as depicted in Figure 4. The architecture has been developed to achieve a logical separation of all system component groups while minimizing the coupling between different modules or component libraries. All layers of the system have been designed to function independently, thus providing a greater degree of flexibility, reliability, and overall capability for operation across the entire system.
Figure 3. Operation flow of the proposed driver monitoring system
Figure 4. Sequence diagram of the proposed driver monitoring system
The architecture is divided into five main components: the driver, the camera, the face detection module, the EAR/YAWN analysis module, and the alert module. As displayed, the camera continuously captures frames of the driver's face, and this information is sent to the face detection module. Once the face is detected, the relevant regions of the eyes and mouth are identified and processed to obtain the facial reference points necessary for further analysis.
The EAR/YAWN analysis module calculates the EAR and YAWN values and compares them to the operating thresholds established during the calibration phase. If the detected values remain within the normal range, the monitoring process continues. However, if the system identifies values related to a potentially dangerous condition, the alert module is activated to generate an audible and visual warning for the driver. Therefore, this architecture makes it easier for the system to monitor the driver's condition in real time without having to rely on facial image databases, stored expression templates, or identity recognition.
3.3 Implementation of the EAR/YAWN-based analysis algorithm
To implement the image processing algorithm designed to detect a driver's face and analyze their expression, the primary goal is to receive visual data from the camera and obtain the facial features required for driver-state analysis. To obtain this feature set, the first step is to capture and process facial images for feature detection and analysis. The OpenCV library provides the necessary tools to detect the driver's face within these images. Face detection is performed using the OpenCV library's 'cv2.CascadeClassifier' method along with the pre-trained cascade classifier 'face.xml' to identify the region of the image containing the driver's face (the facial region). Therefore, face detection is crucial to this process, as it is the area of the image containing the most important elements needed to analyze the driver's facial expression.
Furthermore, in the preliminary calibration phase of the prototype, the EAR and YAWN thresholds were determined under controlled laboratory conditions. Twenty students from the Universidad de Ciencias y Humanidades participated voluntarily in this phase. During the preliminary tests, the values of both metrics were analyzed during normal eye opening, prolonged eye closure, and simulated yawning. For the EAR, values during normal eye opening were approximately 0.30–0.40, while during prolonged eye closure they decreased to approximately 0.20–0.26. Similarly, for the YAWN, values above 8.33 represented a normal oral region, while values equal to or below 8.33 were associated with simulated yawning. Based on these preliminary observations, EAR = 0.26 and YAWN = 8.33 were selected as operating thresholds, because they provided the clearest visual distinction between the normal state and simulated states related to drowsiness or fatigue.
The accuracy of face detection is enhanced by using the eye detector with cascaded classifiers, which will then be applied to the detected eye regions to enhance the accuracy of image analysis for that region, as well as to highlight the driver's most significant facial features. Additionally, the HoughCircles function is used to locate each pupil, which works by searching for circular shapes to identify the pupils' positions in the image.
The EAR and YAWN were also used in the study as visual indicators of alertness for the driver. The EAR was used for the assessment of the ocular opening based on the geometric link between the key points of the eye area. The YAWN was used to evaluate the oral cavity and thus identify potential signs of yawning. The EAR and YAWN metrics were evaluated using the operating thresholds established during the preliminary calibration phase. Furthermore, a combined analysis of the EAR and YAWN allowed for the identification of visual signs of drowsiness, fatigue, or decreased alertness in the driver. Therefore, the results of the algorithm were interpreted as the detection of a potentially dangerous driving state.
3.4 Experimental setup and objective performance assessment
The system was experimentally evaluated in a laboratory with controlled lighting. Thirty participants aged 20–40 years took part in the experiments, including 22 men and 8 women. Each participant completed one five-minute experimental session, resulting in 30 sessions and 150 minutes of recorded data. It should be mentioned that the tests were carried out under simulated conditions using a fixed camera mounted in front of the participant. No real vehicle was used.
On the other hand, the system ran on a Raspberry Pi 4 Model B single-board computer with a 1.5 GHz quad-core Cortex-A72 processor and 4 GB of random-access memory (RAM). In addition, 64-bit Raspberry Pi OS was used as the operating system. Video acquisition was from a Universal Serial Bus (USB) webcam with 1080p resolution, while processing was done at a resolution of 640 × 480 pixels with an input frame rate of 30 frames per second. The system was developed in the Python language in version 3.11 using the OpenCV 4.8 library.
During the experimental sessions, study participants simulated a normal state, prolonged eye closure and simulated yawning. After recording the video, 200 events were identified and tagged independently. For each event, the participant's actual state was compared with the system output. From this, it was possible to determine the true positives, the true negatives, the false positives and the false negatives.
A true positive was defined as cases in which the system correctly activated an alert when prolonged eye closure or yawning occurred. A true negative was recorded when the system correctly produced no alert during a normal driver state. A false positive was defined as an alert that was triggered in the normal state, while a false negative was when the system failed to detect a dangerous visual signal.
The system's metrics of accuracy, precision, recall, F1-score, and false-positive rate were calculated using the confusion matrix. Also, the evaluation of the system's computational performance was measured by the average frame processing speed, the time taken to process a single frame, the processor load, the use of RAM and the delay in both recognizing a potentially dangerous condition and triggering an alert.
3.5 Expert validation
As part of the evaluation of the proposed system, a validation was carried out by five experts (E1–E5) in systems engineering and software development. These experts have professional experience in the design and implementation of intelligent systems, as well as in computer vision and data analysis. It should be noted that all the experts hold a master's degree or a doctorate, which guarantees a high level of competence and the reliability of the results obtained. In addition, all experts have hands-on experience as software developers, which is especially important when evaluating the applicability of the system under real-world conditions.
The expert evaluation included six items corresponding to established criteria: usability, accuracy in detecting the driver's condition, efficiency in real-time data processing, system reliability and stability, applicability under real-world operating conditions, and potential to reduce the risk of traffic accidents. Each criterion was evaluated independently on a scale of 0% to 100%. Furthermore, the arithmetic mean of the five experts' scores was calculated for each criterion. Therefore, the final system score was determined as the average of the 30 individual scores received for the six criteria from the five experts, according to Eq. (1).
$S_{global}=\frac{\sum_{i=1}^6 \sum_{j=1}^5 S_{i j}}{6 \times 5}$ (1)
As shown in Eq. (1), $S_{i j}$ represents the score assigned by expert j to criterion i. Therefore, the sum of the 30 evaluations was calculated, resulting in 2862 points. Thus, the overall system evaluation was 2862/30 = 95.4%. Furthermore, to assess the agreement among the five experts, the intraclass correlation coefficient (ICC) was used, which resulted in 0.885, indicating a high degree of agreement.
3.6 Ethical aspects
The study participants signed an informed consent form for the use of the information collected from the pilot test of the system, indicating that the information was going to be collected for research purposes. In consideration of the bioethical principles established for the preservation of the autonomy, beneficence, non-maleficence and justice of human beings, the research has the approval of the Ethics Committee of the Universidad de Ciencias y Humanidades, in accordance with Law Code 219-2025, issued on November 18, 2025.
4.1 Driver-state detection results
This section presents the results obtained during the development and evaluation of the proposed driver monitoring system based on facial feature analysis. The objective of the experiments was to determine whether the system could perform real-time face detection and analysis of the driver's face.
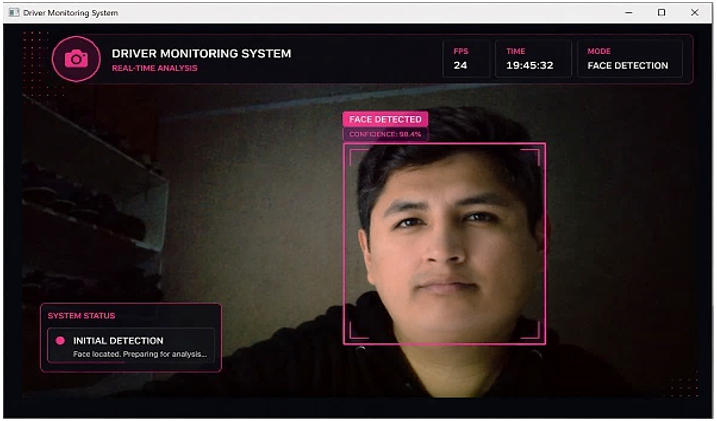
Phase 1 of this evaluation consisted of testing the face detection module with images captured by a webcam. The results indicate that the system correctly detects the driver's face from live video images (i.e., the video signal) by extracting a bounding box (see Figure 5). This demonstrates that the OpenCV-based face detection algorithm produced the expected (and correct) results.
Furthermore, the system was also found to be capable of accurately detecting faces under changing lighting conditions and with the driver's head movements. However, there are limitations regarding the speed at which these changes can occur. Under changing lighting conditions (i.e., when the scene brightness suddenly changes) or when only parts of the face are visible (e.g., when the driver has something in front of their face), the detection error margin is likely to increase. These are typical limitations of traditional machine vision methods. Based on these results, it was determined that the prototype developed for driver face detection was capable of performing the essential function of detecting the driver's face for analyzing facial expressions and determining their condition.
Next, the system's ability to assess the driver's eye condition and identify fatigue is analyzed. More specifically, it examines whether the system detects if the driver's eyes are open (characterized by the degree of eye opening) and if they have shown signs of fatigue (such as yawning) through their gaze.
The system analyzes the driver's eye condition and calculates the EAR, which measures the degree of eye opening based on the geometric relationship between a limited number of facial points [16, 20, 21]. When the EAR was measured with the eyes open, the value remained within the normal range. The system also detects possible yawning by analyzing the shape and degree of mouth opening. The YAWN is interpreted according to the operational threshold established during the calibration phase, with deviations from the normal range indicating a potential visual sign of fatigue.
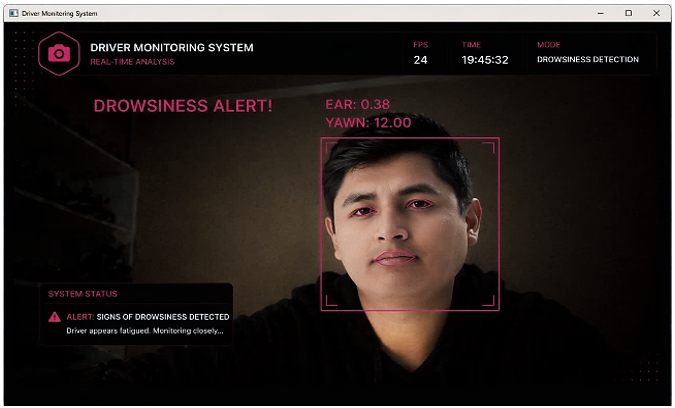
The implementation of the above is successfully demonstrated in Figure 6, where the system was able to calculate the driver's facial condition based on their eyes (i.e., eye position) and mouth (i.e., the degree of mouth opening). Furthermore, the normal driver state can be observed, with EAR = 0.38 and YAWN = 12.00. Since the observed YAWN value exceeds the established threshold of 8.33, the algorithm interprets it as a normal mouth state without signs of yawning. At the same time, the EAR value indicates an open-eye state. Therefore, the combined results show no visual signs of drowsiness or fatigue.
The final phase of testing confirmed the system's ability to detect hazardous driving conditions, such as drowsiness or fatigue. This phase differed from the previous one because the driver kept their eyes closed during the tests to detect movements associated with drowsiness or fatigue. Specifically, the EAR and YAWN parameters were used to determine the state of the driver's eyes and mouth, respectively. Therefore, if the EAR value falls below a predetermined threshold, it indicates the possibility that the driver has their eyes closed (a sign of drowsiness). Similarly, the YAWN parameter also simultaneously reports any yawning (a sign of fatigue).
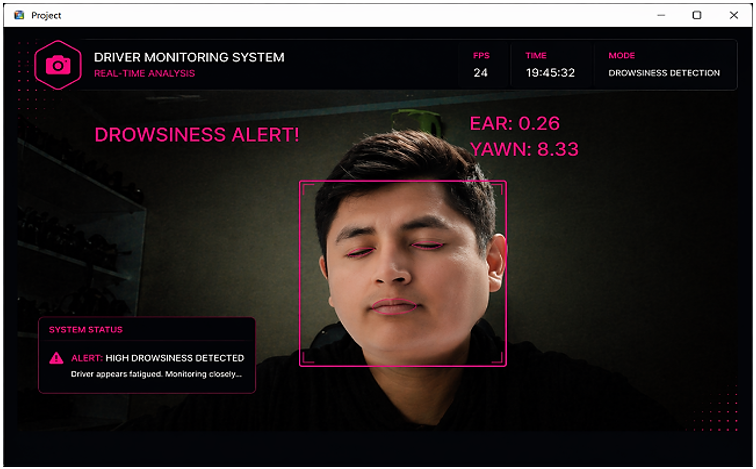
Figure 7 illustrates a potentially dangerous situation for the driver. An EAR value of 0.26 reached the threshold for detecting prolonged eye closure, while a YAWN value of 8.33 reached the threshold for detecting a possible yawn. According to the implemented algorithm, YAWN values equal to or less than 8.33 are considered a possible visual indicator of yawning. Therefore, when these conditions are met, the system activates a visual and audible warning for the driver.
Figure 5. Face detection by camera
Figure 6. Face detection with eyes open
Figure 7. Face detection with eyes closed
4.2 Objective performance results
During the experimental evaluation in the study, 200 labeled events were analyzed. The system managed to correctly detect 86 dangerous events and correctly recognized 96 normal states. However, 8 false positives and 10 false negatives were registered.
According to the confusion matrix, the system achieved an accuracy of 91.0%, a precision of 91.5%, a recall of 89.6%, and an F1-score of 90.5%. The false-positive rate was 7.7%. Therefore, these metrics provide a quantitative characterization of the algorithm's objective performance, and these results differ from the expert assessment of its functional suitability.
Table 2. Objective performance results of the proposed system
|
Performance Indicator |
Result |
|
Evaluated events |
200 |
|
True positives |
86 |
|
True negatives |
96 |
|
False positives |
8 |
|
False negatives |
10 |
|
Accuracy |
91.0% |
|
Precision |
91.5% |
|
Recall |
89.6% |
|
F1-score |
90.5% |
|
False-positive rate |
7.7% |
|
Processed frame rate |
22.4 FPS |
|
Processing time per frame |
44.6 ms |
|
Average alert latency |
320 ms |
Note: FPS = frames per second.
The input frame rate was 30 frames per second; therefore, the prototype did the processing at an average of 22.4 frames per second. In addition, the average processing time per frame was 44.6 ms. The average central processing unit (CPU) utilization managed to reach 68%, the maximum utilization was 83%, and the RAM usage was approximately 1.2 GB.
The average delay interval between confirmation of a potentially hazardous condition and activation of the alert was 320 ms. Likewise, the individual measurements recorded values of 290, 320 and 350 ms, while the maximum delay observed during the entire series of tests was 510 ms. Therefore, the results that were obtained demonstrate that the system was capable of continuously processing the video stream under the evaluated laboratory conditions. The summary results are shown in Table 2.
4.3 Results of the expert validation
The results obtained from the validation by five experts demonstrate a high degree of effectiveness for the proposed system. The final overall score was 95.4%, calculated as the average of 30 individual scores across the six criteria. Furthermore, the ICC was 0.885, indicating a high level of consistency among the evaluators. Table 3 shows that the mean values for each criterion ranged from 93.4% to 97.4%. It is also important to note that the 95.4% value represents the expert evaluation of the prototype's functionality and not the objective accuracy of the algorithm, which was assessed separately using the confusion matrix.
Table 3. Results of the expert validation of the proposed system
|
Evaluation Criteria |
E1 |
E2 |
E3 |
E4 |
E5 |
Average Value (%) |
|
Ease of use |
96% |
94% |
95% |
97% |
95% |
95.4% |
|
Accuracy in determining the driver's condition |
97% |
95% |
96% |
98% |
96% |
96.4% |
|
Real-time processing efficiency |
94% |
92% |
93% |
95% |
93% |
93.4% |
|
System reliability and stability |
95% |
93% |
94% |
96% |
94% |
94.4% |
|
Applicability in real-world operating conditions |
96% |
94% |
95% |
97% |
95% |
95.4% |
|
Potential to reduce traffic accidents |
98% |
96% |
97% |
99% |
97% |
97.4% |
|
Overall final evaluation of the system |
|
|
|
|
|
95.4% |
The results obtained from the objective experimental evaluation showed that the prototype achieved an accuracy of 91.0%, a precision of 91.5%, a recall of 89.6%, and an F1-score of 90.5%. Unlike the average score obtained by the experts, which was 95.4%, these metrics were calculated based on the actual decisions of the algorithm for 200 tagged events. Consequently, the expert scores and the objective scores served different functions: the former assessed the system's perceived functional suitability, while the latter reflected its actual ability to distinguish between normal and potentially dangerous visual states.
The recall value of 89.6% indicates that the system was able to detect most of the events of eye closure and yawning. However, the 10 false-negative results indicate that some potentially hazardous events were not detected by the system. This error type is particularly relevant in a driver-warning application because an undetected event may prevent the timely activation of an alert. Therefore, the subsequent optimization of the algorithm should focus only on increasing sensitivity without significantly increasing the false alarm rate.
The processing speed of 22.4 frames per second and the processing time of 44.6 ms per frame confirmed the feasibility of continuous analysis of local video streams on a Raspberry Pi 4 Model B. On the other hand, the average alert latency of 320 ms demonstrated how fast the system responds after the event is confirmed. The technical benefit of the system proposed in the study lies in the combination of an accessible hardware platform, local data processing, and the elimination of the need for a constant connection to a remote server.
However, the results were obtained under laboratory conditions using a fixed camera and controlled lighting. On the other hand, vibrations, night lighting, changes in the position of the camera, use of glasses, partial facial occlusion, and prolonged use can affect the stability of face detection and feature analysis. In addition, the EAR and YAWN values allow us to characterize the visual signs of drowsiness and fatigue, but do not confirm the presence of alcohol intoxication.
The results of the designed prototype indicated that it effectively performs basic driver monitoring functions, such as face detection, facial feature analysis, and fatigue detection, using a combination of metrics with EAR = 0.26 and YAWN = 8.33. Furthermore, it was able to detect open and closed eyes, as well as generate alerts for potentially dangerous events with stable performance. Additionally, the average rating of 95.4% obtained by five experts indicates that the expert evaluation supported the perceived functional suitability and ease of use of the prototype. Nevertheless, these findings should be interpreted as complementary subjective evidence rather than proof of real-world effectiveness.
Compared with recent deep learning studies, differences can be observed in accuracy and implementation complexity. For example, FER accuracy of 98% and fatigue detection accuracy above 90% have been reported in a previous study [13]. In contrast, the system proposed in this study is not designed to achieve maximum accuracy, which would complicate its usability, but rather aims to create a low-cost, low-power solution. Nevertheless, the results of this study demonstrate the effectiveness of detecting important indicators of driver status using classic computer vision techniques. More specifically, the EAR metric allowed for reliable and distortion-free detection of eye status, as well as the detection of yawns, which includes the validated YAWN measurement in previous studies.
Furthermore, unlike other current solutions with complex interpretations, models, and hardware, such as those referenced in works [14, 15], this approach was implemented through the direct application of inexpensive and readily available technologies, such as OpenCV and Raspberry Pi. These characteristics will facilitate the practical implementation of the system and the sustainability of resources, which can improve both accuracy and stability.
In order to offer a more structured comparison of the developed prototype with existing driver monitoring systems, Table 4 presents the key characteristics of the most relevant studies. Likewise, this comparative analysis considers the detection method used, the hardware platform, the dataset or experimental sample, and the key performance indicators. In addition, this analysis facilitates a more understandable evaluation of the position of the proposed solution in the study among modern approaches, taking into consideration not only the accuracy of the detection, but also the computational complexity, the type of hardware used, and the experimental evaluation conditions.
The results obtained in the study confirm the system's ability to detect changes in the eyes and mouth related to drowsiness and fatigue. Prolonged eye closure and yawning can be due to lack of sleep, medication, stress, or long continuous periods of driving. Therefore, the proposed system should be considered a user support tool for risk monitoring. The main advantage of the system is that it has the capacity for continuous monitoring of the driver without the need for contact, using available equipment and local data processing.
It is worth noting that some limitations were detected in the experimental results obtained with this system. In particular, overall accuracy decreased during rapid changes in lighting and when facial features were partially obscured. Therefore, these results confirm previous research indicating that recognition stability is highly correlated with the quality of the input data [13]. Nevertheless, the available comparative analysis indicates that the proposed system falls between basic algorithmic solutions and advanced deep learning applications with greater potential. While less accurate than deep learning solutions, from an operational perspective, it is more accessible, implementable, and viable for use in everyday environments. Future development of the system may focus on increasing accuracy through the application of deep learning, as well as further developing the training dataset or conducting tests with a larger group of participants. Furthermore, the aim is for this prototype to be able to connect to a mobile application to facilitate its use and deployment under real-world conditions.
Table 4. Comparison with previous driver monitoring approaches
|
Study |
Detection Method |
Hardware/Platform |
Dataset/Sample |
Reported Performance |
|
Essahraui et al. [12] |
Facial analysis using KNN, SVM, CNN, YOLOv5, YOLOv8 and Faster R-CNN |
Computer-based ML/CV implementation |
NTHU-DDD, YawDD and UTA-RLDD public datasets |
KNN: accuracy 98.89%, precision 99.27%, F1-score 98.86%; YOLOv5/YOLOv8: Precision and Recall 100%, mAP@0.5 99.5% |
|
Li et al. [13] |
Lightweight CNN (LGN) for eye-closure, blink rate and PERCLOS detection |
Wearable glasses, RGB/IR camera and Raspberry Pi Zero W |
Experimental eye recordings compared with an EyeLink eye tracker |
Blink detection showed high consistency with the EyeLink reference system |
|
Uddin [14] |
Dual Attention Lightweight Deep Learning (DALDL), based on SqueezeNext with HCA and CSA |
AMD Ryzen 7-5800HS CPU; NVIDIA GeForce RTX 4060 GPU |
KMU-FED and CK+ datasets |
Up to 8.51% higher accuracy and 8.40% higher F1-score than baseline on CK+; inference Time 3.9 ms/image |
|
Yu et al. [15] |
LSTM integrating PPG, facial features and head posture |
PPG sensor, video acquisition and MATLAB-based processing |
30 drivers; 3,600 samples (2,880 training / 720 testing) |
Accuracy 97.36%, precision 97.4%, Recall 97.4%, F1-score 97% |
|
Proposed system |
OpenCV-based facial feature analysis using EAR and YAWN thresholds |
Raspberry Pi 4 Model B, USB webcam, Python 3.11 and OpenCV 4.8 |
30 participants; 200 labeled events under controlled laboratory conditions
|
Accuracy 91.0%, precision 91.5%, recall 89.6%, F1-score 90.5%; 22.4 FPS; alert latency 320 ms
|
This research developed a driver-state monitoring prototype designed to support the prevention of traffic accidents associated with drowsiness, fatigue, or reduced driver alertness. The system uses computer vision algorithms to achieve this, based on two observations: eye state, defined by the EAR, and facial state, defined by the YAWN. Both were collected in real time, and effective values were obtained. These findings confirm that the driver monitoring system is capable of detecting both users' facial features and eye state, allowing it to send alerts when the system detects a potential risk or danger. Furthermore, the high level of functional suitability assessed by experts indicates that the prototype shows potential for future application in real-world driving environments, although further validation under actual driving conditions is required.
While these findings are encouraging, it should be noted that this technology is in the early stages of development, and there are challenges to overcome before this solution can have a substantial impact on society. In this regard, although the prototype demonstrated adequate functionality under controlled laboratory conditions, further testing is required before its use in everyday driving environments. The system needs to incorporate adjustment parameters and be complemented by an integrated mobile application. This will allow for measurable benefits in both the short and long term.
In conclusion, this research demonstrates that effective methods exist for improving road safety through the use of relatively low-cost computer vision technologies. This generates significant potential for ongoing research and development in the field of road safety, as well as driving the development of more advanced, robust, and general-purpose driver monitoring devices. Therefore, this study opens numerous avenues for improving image recognition technologies and warrants further exploration in this area.
The authors would like to express their sincere gratitude to the Universidad de Ciencias y Humanidades (UCH) in Lima, Peru, for its support of this research, and to the systems engineering experts who participated in the expert validation of this study for their valuable comments and professional evaluation of the proposed system.
[1] Pérez-Sala, L., Curado, M., Tortosa, L., Vicent, J.F. (2023). Deep learning model of convolutional neural networks powered by a genetic algorithm for prevention of traffic accidents severity. Chaos, Solitons & Fractals, 169: 113245. https://doi.org/10.1016/j.chaos.2023.113245
[2] Febres, J.D., García-Herrero, S., Herrera, S., Gutiérrez, J.M., López-García, J.R., Mariscal, M.A. (2020). Influence of seat-belt use on the severity of injury in traffic accidents. European Transport Research Review, 12: 9. https://doi.org/10.1186/s12544-020-0401-5
[3] Ahmed, S.K., Mohammed, M.G., Abdulqadir, S.O., et al. (2023). Road traffic accidental injuries and deaths: A neglected global health issue. Health Science Reports, 6(5): e1240. https://doi.org/10.1002/hsr2.1240
[4] Yasin, Y.J., Grivna, M., Abu-Zidan, F.M. (2021). Global impact of COVID-19 pandemic on road traffic collisions. World Journal of Emergency Surgery, 16(1): 51. https://doi.org/10.1186/s13017-021-00395-8
[5] Chauhan, R., Obohwemu, K., Sharma, S. (2025). Vision, vulnerability, and vehicular safety: Bridging policy gaps in road traffic regulation to mitigate global disparities in fatalities. International Journal of Medical Science and Public Health Research, 6(1): 35-38. https://doi.org/10.37547/ijmsphr/volume06issue01-05
[6] Peličić, D., Ristić, B., Radević, S. (2024). Epidemiology of traffic traumatism. Sanamed, 19(2): 233-238. https://doi.org/10.5937/sanamed0-51914
[7] Wright, N.A., Lee, L.T. (2021). Alcohol-related traffic laws and drunk-driving fatal accidents. Accident Analysis & Prevention, 161: 106358. https://doi.org/10.1016/j.aap.2021.106358
[8] Yadollahi, M., Pazhuheian, F. (2020). Relative risk of injury due to alcohol consumption in car and motorcycle drivers. Eastern Mediterranean Health Journal, 26(12): 1525-1531. https://doi.org/10.26719/emhj.20.057
[9] Gjerde, H., Frost, J. (2023). Prevalence of alcohol and drugs among drivers killed in road traffic crashes in Norway during 2011–2020. Traffic Injury Prevention, 24(3): 256-261. https://doi.org/10.1080/15389588.2023.2174801
[10] Borges, G., García-Pacheco, J.Á., Familiar-Lopez, I. (2021). Global estimates of the attributable risk of alcohol consumption on road injuries. Alcoholism: Clinical and Experimental Research, 45(10): 2080-2089. https://doi.org/10.1111/acer.14689
[11] Zaman, K., Khan, R., Zengkang, G., et al. (2026). Accurately recognizing driver emotions through using CNN fused features and NasNet-large model. Alexandria Engineering Journal, 134: 177-196. https://doi.org/10.1016/j.aej.2025.12.010
[12] Essahraui, S., Lamaakal, I., El Hamly, I., et al. (2025). Real-time driver drowsiness detection using facial analysis and machine learning techniques. Sensors, 25(3): 812. https://doi.org/10.3390/s25030812
[13] Li, Y., Zhang, S., Zhu, G., Huang, Z., Wang, R., Duan, X. (2023). A CNN-based wearable system for driver drowsiness detection. Sensors, 23(7): 3475. https://doi.org/10.3390/s23073475
[14] Uddin, J. (2025). A novel lightweight deep learning approach for drivers’ facial expression detection. Designs, 9(2): 45. https://doi.org/10.3390/designs9020045
[15] Yu, L., Yang, X., Wei, H., Liu, J., Li, B. (2024). Driver fatigue detection using PPG signal, facial features, head postures with an LSTM model. Heliyon, 10(21): e39479. https://doi.org/10.1016/j.heliyon.2024.e39479
[16] Quiles-Cucarella, E., Cano-Bernet, J., Santos-Fernández, L., Roldán-Blay, C., Roldán-Porta, C. (2024). Multi-index driver drowsiness detection method based on driver’s facial recognition using Haar features and histograms of oriented gradients. Sensors, 24(17): 5683. https://doi.org/10.3390/s24175683
[17] Sankhe, P., Mathur, S., Rehman, T.B., Dixit, M. (2022). Review of an agile software development methodology with SCRUM & extreme programming. In 2022 IEEE International Conference on Current Development in Engineering and Technology (CCET), Bhopal, India, pp. 1-6. https://doi.org/10.1109/CCET56606.2022.10080640
[18] Shrivastava, A., Jaggi, I., Katoch, N., Gupta, D., Gupta, S. (2021). A systematic review on extreme programming. Journal of Physics: Conference Series, 1969(1): 012046. https://doi.org/10.1088/1742-6596/1969/1/012046
[19] Akhtar, A., Bakhtawar, B., Akhtar, S. (2022). Extreme programming vs scrum: A comparison of agile models. International Journal of Technology Innovation and Management, 2(2): 80-96. https://doi.org/10.54489/ijtim.v2i2.77
[20] Du, X., Yu, C., Sun, T. (2024). Multi-parameter fusion driver fatigue detection method based on facial fatigue features. Journal of the Society for Information Display, 32(9): 676-690. https://doi.org/10.1002/jsid.1343
[21] Zhu, T., Zhang, C., Wu, T., et al. (2022). Research on a real-time driver fatigue detection algorithm based on facial video sequences. Applied Sciences, 12(4): 2224. https://doi.org/10.3390/app12042224