Zina Ali Abed* | Hadeel K. Aljobouri | Yuksel Yashar Mohammed
© 2026 The authors. This article is published by IIETA and is licensed under the CC BY 4.0 license (http://creativecommons.org/licenses/by/4.0/).
OPEN ACCESS
Accurate identification of brain tumor boundaries during neurosurgical procedures remains challenging because conventional imaging techniques are primarily performed before surgery and cannot provide continuous intraoperative feedback. This study presents a wearable infrared (IR) thermographic imaging system for real-time visualization of brain tissue thermal patterns during tumor resection. The proposed system integrates an AMG8833 IR sensor, an RP2040 microcontroller, and a compact display module mounted on a first-person-view glasses platform to acquire, process, and visualize thermal information directly within the surgical field. The system was evaluated during an intraoperative procedure involving a 14-year-old patient diagnosed with a subcortical malignant glioma. Thermal patterns obtained from the IR sensor were compared with surgical observations and postoperative histopathological findings to assess the feasibility of tumor-related thermal visualization. The acquired thermal maps demonstrated distinguishable temperature variations between the suspected tumor region and adjacent cortical tissue, with an observed thermal contrast of 4.65 ℃. The proposed platform achieved real-time operation with a system latency of approximately 120–140 ms and a low power consumption of 1.60 W. These results demonstrate the feasibility of integrating compact IR sensing with wearable visualization for intraoperative brain tumor assessment. Although further validation with larger patient cohorts and higher-resolution thermal imaging is required, this proof-of-concept study provides a foundation for developing portable thermal imaging assistance tools for neurosurgical applications.
brain tumor imaging, infrared thermography, intraoperative guidance, wearable medical devices, thermal mapping, neurosurgery
Intraoperative tumor differentiation remains a challenge in neurosurgical procedures. Distinguishing between malignant and normal tissue during surgery using very cost-effective smart glasses and obtaining exact guidance is very challenging [1, 2]. Many studies employ infrared (IR) cameras to measure the temperatures of different parts of the human body, especially in breast, dermatological, and heart diseases [3, 4]. This study presents the design and development of a smart IR glasses platform for real-time characterization of malignant and normal brain tissues during surgery. The system, equipped with an AMG IR sensor, captures high-resolution thermal maps displayed directly on the glasses, providing the surgical team with immediate, non-invasive thermal feedback. Highly malignant with a slow growth rate, gliomas are tumors that arise from glial cells in the brain or spinal cord and have four grades from low to high malignancy. In children, a pilocytic astrocytoma is the most common glioma [5, 6]. It can be characterized by frequent B-Raf proto-oncogene, serine/threonine kinase gene (BRAF) alterations, circumscribed growth, and a favorable prognosis. It is divided into clinically indolent low-grade tumors and high-grade tumors with aggressive behavior [7, 8]. The following case study represents the latter category. Multimodal imaging is commonly used to diagnose brain tumors and provide 3D images of the brain, such as computed tomography (CT), magnetic resonance imaging (MRI), and positron emission tomography (PET) [9-11]. All these modalities are used preoperatively and do not provide real-time images in the operating room [12-14]. IR sensors can detect heat emitted from brain tumors, especially malignant ones. The increased blood flow of the cancerous cells and a high metabolic rate lead to elevated cell temperature to a higher level than surrounding tissue [15, 16]. The average temperature of healthy brain tissue reported ranged between 28 and 33 ℃ [17-19]. Koga et al. [20] in Japan were the first to use an IR camera intraoperatively in brain surgery. They proved that intracranial neoplasms exhibited thermal contrast between different brain regions. They tested the thermal microenvironments of six brain tumors by using a low-resolution IR camera. Their results proved that brain tumor temperatures differed in relation to their types. Gorbach et al. [21] used 34 patients with primary and metastatic brain tumors to conduct one of the earliest clinical series by using IR cameras intraoperatively. The study confirmed that temperature gradients correlated with pathological lesions. That offering early evidence that tumor‑related perfusion changes could be visualized via IR imaging [22]. Steiner et al. [23] explored IR spectroscopy for brain tumor recognition. They analyzed spectroscopic signatures from resected glioblastoma specimens and non‑tumor brain tissue. Their classification model correctly differentiated tumor from normal tissue with high accuracy. That emphasizing that IR spectral biomarkers may contribute to intraoperative tissue classification beyond pure thermal maps [24]. Menezes et al. [25] explored real-time IR thermography for brain tumor classification during surgery. Their study of 35 patients showed that IR imaging could effectively tell apart malignant and benign tissues. They also mentioned the potential of combining IR systems with Augmented Reality to show thermal data directly in the surgeon’s view, which could make surgeries more efficient [23, 25]. Da Costa et al. [26] proved that using IR thermography to localize intracranial lesions was feasible. They examined residual tumor detection during vascular and epilepsy surgeries. They demonstrated that IR cameras can localize lesions within up to 2 cm in depth with high sensitivity and accuracy. The residual tumor exhibited nonspecific static and characteristic dynamic thermographic maps. The reported temperature difference is about 0.5–2.0 ℃ between the brain tumor margin and the healthy cortex. In accordance with the literature introduced above, several limitations were faced by the researcher. That includes low spatial resolution of thermal sensors, sensitivity to environmental conditions, the influence of blood flow and tissue perfusion on temperature distribution, and challenges in accurately correlating thermal patterns with anatomical structures [27]. Therefore, designing and developing non-invasive, cost-effective glasses based on IR technology is very challenging. It provides real-time monitoring of brain resection in the operating room. This work was validated by performing surgery in the Department of Neurosurgery in Ghazi Al-Hariri Surgical Specialty Hospital, Medical City Campus, Baghdad, Iraq. A case study on 14 years old patient with a glioma tumor was performed. Evaluation of the smart glasses' performance was conducted.
2.1 Materials
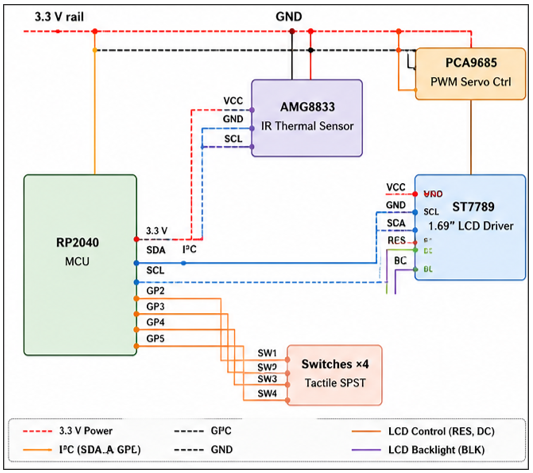
The proposed system is composed of five sections, as shown in Figure 1. These include an IR sensor, a Microcontroller RP2040, a 1.69-inch LCD, a Servo Motor, and the Frame (First-Person View (FPV)). The sterile surgical environment during the intraoperative evaluation was ensured by enclosing the glasses in a sterile disposable plastic cover. The protective covering did not interfere with thermal image acquisition, display visualization, or system operation during the procedure. Table 1 shows the connection of the design glasses.
Figure 1. The block diagram and wiring of the system
Table 1. Connection of design glasses
|
Device |
Pin |
Microcontroller Physical Pin |
|
AMG VCC |
VIN |
Pin 36 (3.3 V) |
|
AMG GND |
GND |
Pin 38 |
|
AMG SDA |
SDA |
Pin 6 (GP4) |
|
AMG SCL |
SCL |
Pin 7 (GP5) |
|
LCD VCC |
3.3 V |
Pin 36 |
|
LCD BL |
3.3 V |
Pin 36 |
|
LCD GND |
GND |
Pin 38 |
|
LCD SCK |
SCK |
GP18 (Pin 24) |
|
LCD MOSI |
MOSI |
GP19 (Pin 25) |
|
LCD CS |
CS |
GP17 (Pin 22) |
|
LCD DC |
DC |
GP21 (Pin 27) |
|
LCD RST |
RST |
GP20 (Pin 26) |
2.1.1 Infrared sensor “AMG8833”
An IR sensor that has an 8 × 8 array of thermopiles (64 individual sensors). It allows measuring the temperature at each pixel to create a heat map. The sensor depends on Micro-Electro-Mechanical Systems (MEMS) technology that captures body temperature and converts it into a thermal map. It can detect temperatures in the range of 0 ℃ to 80 ℃, which is acceptable in this study. The working temperature is between 30 ℃ and 45 ℃. The resolution of the sensor is typically around 0.25 ℃ per pixel. It is most effective within a range of 0.5 to 2 meters for clear, accurate temperature readings.
2.1.2 RP2040 Microcontroller
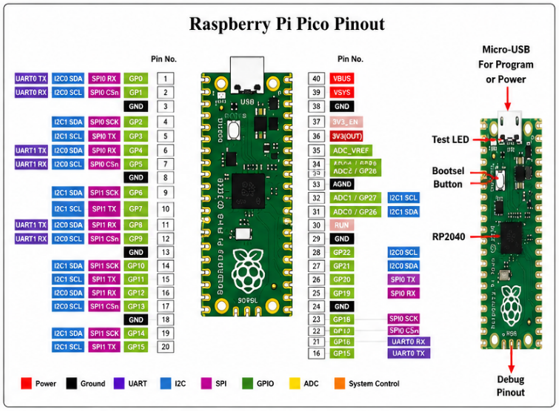
The data was then transmitted through the Serial Peripheral Interface (SPI) for communication with the RP2040 microcontroller. A high-performance microcontroller board developed by the Raspberry Pi Foundation (shown in Figure 2) has a dual-core ARM Cortex-M0+ processor. It runs at 133 MHz. Power was provided via a power supply. The microcontroller was programmed using Visual Studio. It is the primary development environment, employing Python as the programming language. The use of Python with Visual Studio helps to facilitate efficient software development, leveraging libraries and tools. These enhance the performance and capabilities of the microcontroller in real-time applications. Table 2 shows the characteristics of the Microcontroller RP2040.
Figure 2. RP2040 microcontroller configuration [28, 29]
Table 2. The characteristics of the Microcontroller RP2040
|
Feature |
Description |
|
Microcontroller |
RP2040 dual‑core ARM Cortex‑M0+ |
|
Clock Speed |
Up to 133 MHz |
|
SRAM |
264 KB |
|
Flash Memory |
Typically, 2 MB external QSPI flash |
|
GPIO Pins |
26 multifunction GPIO |
|
Analog Inputs |
3 × 12‑bit ADC channels |
|
Digital Interfaces |
2× SPI, 2× I2C, 2× UART, 16× PWM |
|
Operating Voltage |
1.8–5.5 V input (3.3 V logic) |
|
Programming |
C/C++ SDK, MicroPython, CircuitPython |
2.1.3 1.69-inch LCD
The image was displayed on a compact and high-quality display module of 240 × 280-pixel resolution. 1.69-inch LCD module from Wave Share supports 16-bit color depth (RGB565). This LCD can be used to display up to 65,536 colors, making it suitable for displaying the heat map from an IR sensor with rainbow palettes. Table 3 shows the characteristics of the LCD 1.69 inch.
Table 3. The characteristics of the LCD 1.69-inch
|
Feature |
Description |
|
Display Size |
1.69-inch IPS LCD |
|
Resolution |
240 × 280 pixels |
|
Driver IC |
ST7789 |
|
Interface |
SPI |
|
Color Depth |
65K / 262K colors |
|
Viewing Angle |
≈160° IPS wide viewing |
|
Operating Voltage |
3.3 V |
|
Backlight |
LED backlight |
|
Pixel Density |
High‑density IPS panel |
|
Module Type |
TFT LCD display module |
|
Typical Use |
Embedded systems, IoT, Raspberry Pi Pico projects |
2.1.4 Servo motor
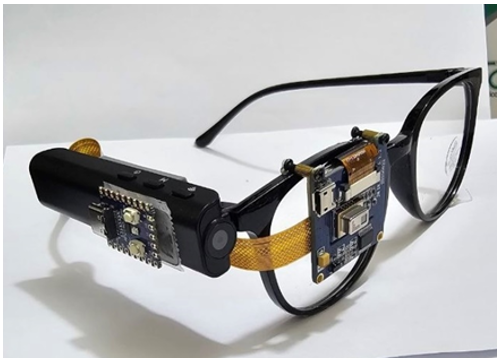
The servo motor was used to control the IR sensor movement. Figure 3 shows the final designed IR glasses.
Figure 3. Final designed infrared (IR) glasses
2.1.5 Frame (First-Person View)
The frame used was a FPV camera. It is a compact video camera designed to transmit live video directly to goggles or a display. Have a CMOS sensor to transmit to a 5.8 GHz analog transmitter. The resolution of FPV is 600 TVL (analog) to 1080p (digital), with Latency of 10–40 ms. It is used to capture the surgeon's live field of view to compare the visible and IR images. The system was connected to three tactile switches to enable the surgeon to control display modes and calibration conveniently without interrupting the surgical workflow.
2.2 Case study
The system was tested in a controlled environment on a 14-year-old patient. The patient was diagnosed with a subcortical malignant glioma. The Department of Neurosurgery in Ghazi Al-Hariri Surgical Specialty Hospital, Medical City Campus, Baghdad, Iraq, was the center where the surgery was performed. The case was pre-diagnosed by three neurosurgeons in the same hospital. During surgery, a thermal map from the IR sensor was continuously monitored in the glasses. The primary thermal markers used to differentiate between tumor and healthy tissues included temperature variance, gradient distribution, and thermal heterogeneity. Continuous monitoring enables the surgical team to assess tumor boundaries dynamically. The absolute temperature of brain tissue cannot be directly measured because the emissivity changes. This change due to continuous application of normal saline, which is used to irrigate the exposed cortex. To minimize this effect, IR images were captured 2–5 seconds after each irrigation. Additionally, operating room and ceiling light temperatures, as well as the patient’s body temperature, were recorded before and during the incision. Ambient humidity was also measured in each case to document the environmental conditions under which the thermal data were acquired. These measurements were used to verify stable operating conditions but were not incorporated into a temperature compensation or calibration model in the present study.
3.1 Results
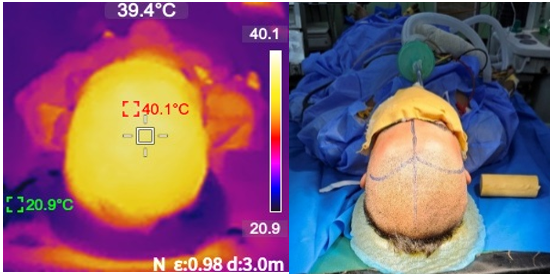
Figure 4 shows a pre-incision IR image from behind the scalp. It shows the tumor location very clearly with a hot spot and a core temperature of 40.1 ℃. The surrounding area has a decreased temperature. Alongside is a visible image of the same view. The temperature shown guides the surgeon to get into the tumor directly without needing another approach.
Figure 4. Pre-incision infrared (IR) and visible image
Figure 5. Infrared (IR) and visible image after removing the cortex
Figure 6. Infrared (IR) image of the biopsy after being removed from the brain
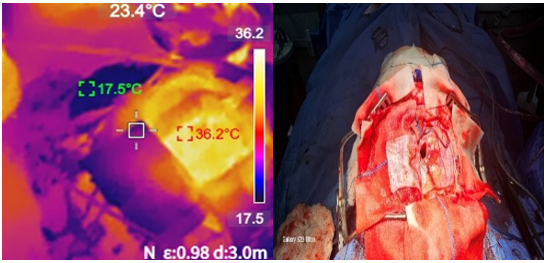
In Figure 5, the surgeon removed the cortex and exposed the brain to reach the tumor. Again, the core temperature here is higher than the surrounding tissue, which makes it a guide during the surgery. The tumor temperature was 36.2 ℃ with an emissivity of 0.98. This is used because most of the brain tissue is composed of water, so the emissivity of water is 0.89. The right image in Figure 5 shows the visible image.
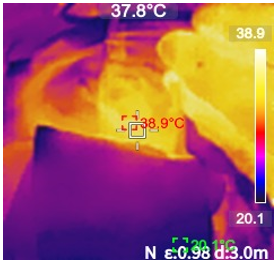
Figure 6 shows the biopsy temperature taken immediately after being extracted from the brain. It helps the surgeon determine whether the removed tissue is malignant or normal. In this image, the temperature of the biopsy is approximately 39 ℃, which is very high in comparison with normal brain tissue. The temperature of normal brain tissue ranges from 28 to 33 ℃.
3.2 Experimental evaluation
Several methods are used to evaluate the performance of the smart glasses mentioned below:
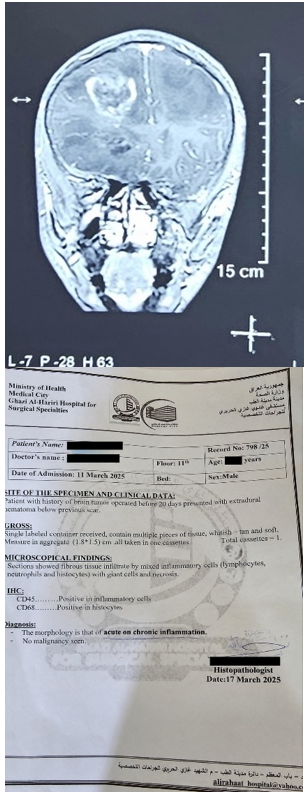
1. A histopathological report after surgery was performed on the excised tumor tissue. This method was used to validate the thermal map patterns observed during surgery. The observed intraoperative thermal patterns were compared qualitatively with the lesion location. MRI and the surgical field identified these locations. demonstrating correspondence between the thermal observations and the confirmed pathological region. This is shown in Figure 7, alongside the MRI image of the patient preoperatively.
Figure 7. Magnetic resonance imaging (MRI) of the patient with a histopathology report
2. The proposed system maintains a compact and energy-efficient architecture. It is suitable for wearable intraoperative applications while maintaining sufficient operational time for clinical procedures. Table 4 shows the power consumption of each component used. The total estimated system power consumption is approximately 1.60 watts.
Table 4. Power consumption
|
Component |
Operating Voltage |
Current Consumption |
Power Consumption |
|
RP2040 microcontroller |
5 V |
~90 mA |
0.45 W |
|
AMG8833 Thermal Sensor |
3.3 V |
~4.5 mA |
0.015 W |
|
LCD 1.69" LCD |
3.3 V |
~40 mA |
0.132 W |
|
Servo Controller |
5 V |
~200 mA (average) |
1.0 W |
|
3 Tactile Switches |
3.3 V |
<1 mA |
~0.003 W |
3. To measure the temperature difference between the tumor and the surrounding cortex, use the mean temperature equation
$\Delta T=T_{\text {tumor}}-T_{\text {normal}}$ (1)
where,
•Ttumor = average temperature of the tumor region.
•Tnormal = average temperature of adjacent cortex.
where, the average tumor temperature is 37.55 ℃, and the normal average was 32.9 ℃. The observed thermal contrast between tumor and surrounding cortex (4.65 ℃) is consistent with previously reported intraoperative thermography findings in malignant brain tumors. This finding is consistent with previously reported intraoperative IR image observations. The malignant brain tissue may show altered high temperature compared with adjacent normal tissue due to differences in tissue metabolism, vascularity, and physiological activity.
4. The contrast-to-noise ratio (CNR) between the suspected tumor region and surrounding cortex was calculated:
$C N R=\frac{\left|T_{\text {tumor}}-T_{\text {normal}}\right|}{\sigma_{\text {normal}}}$ (2)
where, σnormal represents the standard deviation within the normal cortical region of temperature measurements. A higher CNR indicates improved separation between the thermal signal of the suspected tumor region and the surrounding tissue.
5. Qualitative assessment of anatomical correspondence was performed. It compared preoperative MRI findings with the intraoperative surgical field and IR images. The lesion location identified on MRI was reviewed by the surgeon with respect to the exposed surgical area. The corresponding thermal map observed during intraoperative imaging provided qualitative anatomical consistency among preoperative imaging, intraoperative observation, and thermal visualization.
6. Quantitative thermal assessment of intraoperative IR imaging was extracted from the IR image as mentioned in Table 5.
Table 5. Quantitative thermal assessment
|
Region of Interest (ROI) |
Mean Temperature (℃) |
Thermal Measurement Description |
|
Suspected tumor region |
37.55 |
Average temperature measured within the intraoperative Infrared (IR) region corresponding to the lesion area |
|
Surrounding normal cortex |
32.90 |
Average temperature measured from adjacent cortical tissue surrounding the lesion |
|
Thermal contrast (ΔT) |
4.65 |
Temperature difference between suspected tumor region and surrounding cortex |
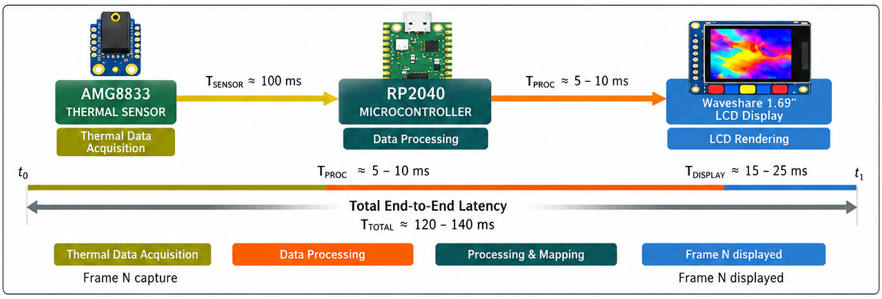
7. The real-time performance of the proposed system was evaluated based on the measured acquisition and processing times of each component. The execution time of each processing stage was recorded, including thermal image acquisition, data transmission, image processing, and display updating. The total system latency was estimated to be approximately 120–140 ms. This corresponds to an effective frame rate of approximately 8 FPS (Frames Per Second). The overall latency was calculated as the cumulative delay of all processing stages. Component-wise analysis was performed to identify the contribution of each stage to the final system response. The achieved performance is mainly limited by the refresh rate of the AMG8833 thermal sensor. Nevertheless, this latency enables real-time thermal image visualization and monitoring. Power consumption was evaluated during normal operation by assessing the electrical requirements of the integrated components, including the IR sensor, processing unit, and display module. Figure 8 has been clarified to show the contribution of each component to the total latency.
Figure 8. Total system latency
The development of new technology that provides real-time detection of brain tumor site temperature is crucial. It is used to assist in the surgical characterization of tumor type and to differentiate between malignant and normal brain tissue. To overcome all the obstacles associated with IR technology, the images are collected carefully in a controlled environment. In this study, a wearable IR and visible light imaging system was developed. Using an RP2040 microcontroller, an AMG8833 IR sensor, and a 1.69-inch LCD. All these components integrated with three tactile switches that were all mounted on one side of an FPV-style glasses frame. The measured temperature represents the superficial cortical surface temperature rather than the physiological core brain temperature. Open cranial exposure can result in surface cooling due to direct environmental exposure, evaporation, and irrigation effects. This configuration allowed simultaneous visualization of real-time visible and IR imaging. The system was evaluated by surgical resection of a grade III glioma in a 14-year-old male patient. The present evaluation was conducted as a preliminary feasibility study under controlled intraoperative conditions. Factors such as tissue motion, irrigation, and surgical instrument movement may introduce thermal imaging artifacts and affect image stability. These aspects were beyond the scope of the present study and will be investigated in future work. In comparison between this work and the IR camera used in all previous studies mentioned in the introduction section, Table 6 shows the differences between both systems. The proposed system emphasizes portability, low power consumption, and wearable integration, whereas most existing IR imaging systems rely on external displays and higher-performance computing platforms. The result is increased power requirements, cost, and reduced intraoperative mobility.
Table 6. Power consumption
|
Feature |
Proposed System |
Existing Works |
|
Cost |
Low |
Medium / High |
|
Platform |
Raspberry Pi Pico |
Raspberry Pi 4 Model B |
|
Thermal sensor |
Panasonic AMG8833 Grid‑EYE Thermal Sensor |
FLIR Lepton Thermal Camera Module |
|
Wearable integration |
Yes (FPV glasses mounted) |
No (handheld or tripod systems) |
|
Power consumption |
Low (~1.6 W) |
High (~4–6 W typical) |
|
System weight |
Very light |
Relatively heavier |
|
Real-time viewing |
Direct LCD on glasses |
External monitor required |
|
Portability |
High |
Moderate |
|
Surgical workflow interference |
Minimal (hands-free) |
Possible interruption |
|
Hardware complexity |
Simple microcontroller design |
Higher processing requirements |
The proposed system demonstrated the capability to perform real-time IR imaging of the subcortical tumor region. It performed at depths reaching approximately 10 mm, along with the adjacent cortical tissue. The AMG8833 sensor captured thermal variations, indicative of tumor metabolic activity and abnormal vascularization. These were clearly distinguishable from adjacent healthy tissue. The 1.69-inch LCD provided immediate visual feedback to the surgeon without the need to look away from the operative field. It highlights the practicality of integrating FPV glasses with dual imaging modalities for intraoperative use. The tactile switches enabled the surgeon to control display modes and calibration conveniently without interrupting the surgical workflow. Also, it illustrates the advantage of a hands-free, surgeon-oriented interface. The findings of this study suggest that a compact embedded platform, such as the RP2040 microcontroller, is capable of supporting real-time thermal data acquisition, processing, and visualization. Despite its limited computational power compared with larger systems, the platform demonstrated sufficient performance for operation in a controlled surgical environment. The combined visible and IR imaging provided a complementary perspective; visible imaging. This provided anatomical context, while thermal imaging highlighted areas of potential malignancy. This fusion may assist in identifying regions of thermal contrast. It could support intraoperative assessment of tumor boundaries. However, further validation using larger patient cohorts and quantitative pixel-wise thermal analysis is required. Although this was a single case study, the results indicate the feasibility of low-cost, portable wearable IR imaging systems in pediatric neurosurgery. Further studies with larger patient cohorts and higher resolution sensors are necessary to quantify the sensitivity and specificity of IR imaging. Additionally, integration with augmented reality overlays and automated thermal analysis could further enhance surgical precision and safety.
This study was conducted according to the approval of the research ethics committee of the biomedical engineering department at Al-Nahrain University (02/2020). It is presented as a single-patient case study. Written informed consent for the intraoperative use of the proposed device and the publication of anonymized clinical data and images was obtained from the patient's legally authorized representative before the procedure.
[1] Vadhavekar, N.H., Sabzvari, T., Laguardia, S., et al. (2024). Advancements in imaging and neurosurgical techniques for brain tumor resection: A comprehensive review. Cureus, 16(10): e72745. https://doi.org/10.7759/cureus.72745
[2] Kastek, M., Piatkowski, T., Polakowski, H., et al. (2014). Intraoperative application of thermal camera for the assessment of during surgical resection or biopsy of human’s brain tumors. SPIE Proceedings, 9105: 910508. https://doi.org/10.1117/12.2050306
[3] Jiang, L.J., Ng, E.Y.K., Yeo, A.C.B., et al. (2005). A perspective on medical infrared imaging. Journal of Medical Engineering & Technology, 29(6): 257-267. https://doi.org/10.1080/03091900512331333158
[4] Lahiri, B.B., Bagavathiappan, S., Jayakumar, T., Philip, J. (2012). Medical applications of infrared thermography: A review. Infrared Physics & Technology, 55(4): 221-235. https://doi.org/10.1016/j.infrared.2012.03.007
[5] Wang, L.M., Englander, Z.K., Miller, M.L., Bruce, J.N. (2023). Malignant glioma. Advances in Experimental Medicine and Biology, 1405: 1-30. https://doi.org/10.1007/978-3-031-23705-8_1
[6] Chen, X., Wang, J., Liu, S., Han, Q., Zhang, H., Wu, J. (2025). Research landscape of glioma and inflammation over the past two decades. Frontiers in Immunology, 16: 1605346. https://doi.org/10.3389/fimmu.2025.1605346
[7] Weller, M., Wen, P.Y., Chang, S.M., et al. (2024). Glioma. Nature Reviews Disease Primers, 10: 33. https://doi.org/10.1038/s41572-024-00516-y
[8] Ostrom, Q.T., Price, M., Neff, C., et al. (2023). CBTRUS statistical report: Primary brain and other central nervous system tumors diagnosed in the United States in 2016—2020. Neuro-Oncology, 25(Supplement 4): iv1-iv99. https://doi.org/10.1093/neuonc/noad149
[9] Liu, Y., Ma, J., Zhang, Q., Wei, W., Chen, X., Liu, Z. (2023). Editorial: Multimodal brain image fusion: Methods, evaluations, and applications. Frontiers in Neuroscience, 16: 1128938. https://doi.org/10.3389/fnins.2022.1128938
[10] van de Schoot, R., Depaoli, S., King, R., et al. (2021). Bayesian statistics and modelling. Nature Reviews Methods Primers, 1: 1. https://doi.org/10.1038/s43586-020-00001-2
[11] Aljobouri, H.K. (2023). Independent component analysis with functional neuroscience data analysis. Journal of Biomedical Physics & Engineering, 13(2): 169-180. https://doi.org/10.31661/jbpe.v0i0.2111-1436
[12] Kowal, M.R., Ibrahim, M., Mihaljević, A.L., Kron, P., Lodge, P. (2025). Technological advances in pre-operative planning. Journal of Clinical Medicine, 14(15): 5385. https://doi.org/10.3390/jcm14155385
[13] Cè, M., Chiriac, M.D., Cozzi, A., et al. (2024). Decoding radiomics: A step-by-step guide to machine learning workflow in hand-crafted and deep learning radiomics studies. Diagnostics, 14(22): 2473. https://doi.org/10.3390/diagnostics14222473
[14] Abed, Z.A., Dhhan, Z.T.A. (2022). Design and test wireless pedicle probe for spine. Pakistan Journal of Medical & Health Sciences, 16(5): 564-565. https://doi.org/10.53350/pjmhs22165564
[15] Kok, H.P., Cressman, E.N.K., Ceelen, W., et al. (2020). Heating technology for malignant tumors: A review. International Journal of Hyperthermia, 37(1): 711-741. https://doi.org/10.1080/02656736.2020.1779357
[16] Kesztyüs, D., Brucher, S., Wilson, C., Kesztyüs, T. (2023). Use of infrared thermography in medical diagnosis, screening, and disease monitoring: A scoping review. Medicina, 59(12): 2139. https://doi.org/10.3390/medicina59122139
[17] Ohshika, S., Saruga, T., Ogawa, T., Ono, H., Ishibashi, Y. (2021). Distinction between benign and malignant soft tissue tumors based on an ultrasonographic evaluation of vascularity and elasticity. Oncology Letters, 21(4): 281. https://doi.org/10.3892/ol.2021.12542
[18] Guyon, J., Chapouly, C., Andrique, L., Bikfalvi, A., Daubon, T. (2021). The normal and brain tumor vasculature: Morphological and functional characteristics and therapeutic targeting. Frontiers in Physiology, 12: 622615. https://doi.org/10.3389/fphys.2021.622615
[19] Koten, J.W., Neijt, J.P., Zonnenberg, B.A., Den Otter, W. (1993). The difference between benign and malignant tumours explained with the 4-mutation paradigm for carcinogenesis. Anticancer Research, 13(4): 1179-1182.
[20] Koga, H., Mori, K., Ono, H., Kuwahara, M., Matsuse, E. (1987). Intraoperative regional thermography during surgery for brain tumors. Neurologia Medico-Chirurgica, 27(11): 1033-1038. https://doi.org/10.2176/nmc.27.1033
[21] Gorbach, A.M., Heiss, J.D., Kopylev, L., Oldfield, E.H. (2004). Intraoperative infrared imaging of brain tumors. Journal of Neurosurgery, 101(6): 960-969. https://doi.org/10.3171/jns.2004.101.6.0960
[22] Gorbach, A.M., Heiss, J., Kufta, C., et al. (2003). Intraoperative infrared functional imaging of human brain. Annals of Neurology, 54(3): 297-309. https://doi.org/10.1002/ana.10646
[23] Steiner, G., Galli, R., Preusse, G., et al. (2022). A new approach for clinical translation of infrared spectroscopy: Exploitation of the signature of glioblastoma for general brain tumor recognition. Journal of Neuro-Oncology, 161(1): 57-66. https://doi.org/10.1007/s11060-022-04204-3
[24] Cardone, D., Trevisi, G., Perpetuini, D., Filippini, C., Merla, A., Mangiola, A. (2023). Intraoperative thermal infrared imaging in neurosurgery: Machine learning approaches for advanced segmentation of tumors. Physical and Engineering Sciences in Medicine, 46(1): 325-337. https://doi.org/10.1007/s13246-023-01222-x
[25] Menezes, D.R., de Lima, L., Mansilla, R., et al. (2024). A prospective study on the usefulness of high-resolution intraoperative infrared thermography in intracranial tumors. Frontiers in Surgery, 11: 1386722. https://doi.org/10.3389/fsurg.2024.1386722
[26] da Costa, C.M.G., da Costa, V.V.B., de Souza, C.A., Menezes, D.R., Acioly, M.A. (2024). Usefulness of intraoperative infrared thermography in intracranial surgeries: Past, present, and future. Arquivos Brasileiros de Neurocirurgia: Brazilian Neurosurgery, 43(1): e48-e56. https://doi.org/10.1055/s-0044-1779743
[27] Abed, Z.A., Aljobouri, H.K., Mohammed, Y.Y. (2026). Intraoperative real-time IR spectral difference between benign and malignant brain tumours. In Lecture Notes in Networks and Systems, Springer Nature, pp. 386-397. https://doi.org/10.1007/978-3-032-32636-2_33
[28] Bell, C. (2022). Introducing the Raspberry Pi Pico. In Beginning MicroPython with the Raspberry Pi Pico, Maker Innovations Series, pp. 1-42. https://doi.org/10.1007/978-1-4842-8135-2_1
[29] Raspberry Pi Ltd. (2022). RP2040 microcontroller documentation. Raspberry Pi Documentation. https://www.raspberrypi.com/documentation/microcontrollers/microcontroller-chips.html.