Kavita Sultanpure* | Jayashree Bagade | Pallavi Bangare | Manisha Dhage | Pravin Patil | Sunil Bangare | Chetas Hadoo
© 2026 The authors. This article is published by IIETA and is licensed under the CC BY 4.0 license (http://creativecommons.org/licenses/by/4.0/).
OPEN ACCESS
Sentiment analysis of social media content remains challenging because conventional approaches mainly rely on textual information while overlooking implicit emotional cues conveyed by emoji and punctuation patterns. This study proposes a context-aware sentiment analysis framework that integrates textual, emoji, and punctuation features within a Long Short-Term Memory (LSTM) network architecture. The proposed framework first extracts semantic representations from user-generated text using pre-trained Global Vectors for Word Representation (GloVe) embeddings, while additional contextual features are derived from emoji usage and punctuation characteristics. These heterogeneous features are fused into a unified representation and subsequently processed by the LSTM classifier for binary sentiment prediction. Experiments are conducted on a Twitter dataset containing 28,617 cleaned text samples, with an independent test set of 11,065 samples used for final evaluation. The proposed framework achieves an accuracy of 93.32%, with precision, recall, and F1-score values exceeding 0.90 for both sentiment categories. The results demonstrate that incorporating non-textual linguistic cues can improve the representation capability of sentiment analysis models and provide a more comprehensive understanding of social media expressions. The proposed approach offers an effective solution for sentiment classification by combining sequential text modeling with contextual emotional indicators.
sentiment analysis, social media analytics, emoji-aware representation, punctuation features, Long Short-Term Memory networks, text classification
Today's digital age offers opportunities for a variety of predictive analytics tasks, such as sentiment analysis, due to the massive amount of data generated on the internet on a daily basis. Rich language characteristics like emojis and punctuation have become common in textual data due to the growth of social media platforms and online communication channels. Because human language expression is complicated, analyzing this data presents unique challenges in addition to offering insights into public opinions and attitudes. Traditional sentiment analysis techniques have primarily focused on analyzing textual data based on lexical and syntactic features, often overlooking the expressive potential of emoji and punctuation marks. Because of this, current sentiment analysis models might not be able to fully represent the range of emotions expressed in textual content, which would result in imprecise predictions and restricted applicability in real-world scenarios. The increasing reliance on textual data for decision-making processes in various domains, including marketing, customer service, and public opinion analysis, underscores the need for more robust and nuanced sentiment analysis techniques.
Furthermore, the prevalence of subtle expressions in online communication emphasizes how crucial it is to create precise and context-aware detection models. Emoji and punctuation can be added to sentiment analysis to improve prediction granularity and accuracy, which will benefit these models in real-world scenarios. The sentimental messages that emoji and punctuation marks convey, as well as the minute details they convey, are frequently overlooked by traditional sentiment analysis approaches. We can obtain a more comprehensive understanding of textual data by incorporating these components into models for sentiment analysis, which will capture both explicit and implicit user sentiments.
This improves prediction accuracy and allows for a more thorough examination of user attitudes and emotions, leading to better decision-making across a range of industries.
Existing sentiment analysis methods mainly analyze text and ignore emojis and punctuation. However, users on social media express emotions through emojis, repeated punctuation, and informal writing styles. Ignoring these features reduces prediction accuracy. Therefore, this work combines textual, emoji, and punctuation information in a single deep learning framework.
In this paper, we propose a novel method to enhance sentiment analysis in textual data by utilizing emoji and punctuation marks. We introduce a decision tree-based model that uses connectors to break up sentences and perform more detailed sentiment analysis. We demonstrate the proficiency and robustness of our approach in accurately predicting sentiments in textual content through empirical evaluation and comparison with existing techniques.
The following contributions are made:
•Proposed a Long Short-Term Memory (LSTM)-based sentiment analysis model.
•Combined emoji and punctuation with textual features.
•Used Global Vectors for Word Representation (GloVe) embeddings.
•Achieved 93.32% accuracy.
In a study by Gautam and Yadav [1], machine learning algorithms and semantic analysis were used to perform sentiment analysis on Twitter data. Using Naïve Bayes (NB), Maximum Entropy, and Support Vector Machines (SVMs), the accuracy rates were 88.2%, 83.8%, and 85.5%, respectively. Furthermore, WordNet-based semantic orientation was added, resulting in an accuracy of 89.9%. The authors hypothesized that increasing the size of the training dataset would enhance the process of identifying sentences related to feature vectors. Additionally, they suggested expanding WordNet for review summarization in an effort to give users a more useful visual depiction of the content. However, their approach primarily relied on textual information and did not consider emoji and punctuation as additional contextual features.
Researchers used multiple classifier layers in a cascaded machine learning approach to investigate multilingual sentiment analysis in another study [2]. This involved a combination of features such as discourse elements, negation cues, and unigrams, in addition to single classifiers. A dataset of blog entries, reviews, and forum discussions in the languages of English, Dutch, and French was used for the experiments. The most accurate language was English, with a maximum accuracy of 83.30% across all three classifier layers. It's interesting to note that a two-layer cascade for English produced almost identical results (83.10%), indicating that the most complex model may have redundant features. The Dutch performed worse, using the three-layer cascade to achieve a maximum accuracy of 69.03%. The results of the French accuracy tests were not made clear. The study emphasizes how difficult it is to perform sentiment analysis on single sentences, especially in the absence of additional context such as previous sentences or domain-specific knowledge. Errors in classification have a negative impact on recall and accuracy, particularly in tasks where retrieving information is a primary goal. It also emphasizes how crucial it is to use representative training data when developing sentiment analysis models.
A different study [3] compared machine learning algorithms with Twitter data to analyze sentiment. The highest accuracy (82.78%) was obtained by Multinomial Naive Bayes (MNB) using unigrams, or single words, as features. The lower performance was displayed by Bernoulli NB (73.76% with unigrams), followed by SVMs (79.50%). This study draws attention to the problem of data sparsity in Twitter sentiment analysis, where the character count limit may limit tweet expressiveness and possibly degrade the efficiency of certain algorithms, such as SVMs. It's interesting that the study found no clear benefit to representing data in Twitter sentiment analysis using word frequency or sentiment polarity. Although the study achieved good sentiment classification performance, it did not investigate the role of emoji or punctuation in improving sentiment understanding.
A different study examined the effectiveness of machine learning classifiers performed on Twitter data for sentiment analysis [4]. The algorithms Random Forest, SVM, and NB were assessed; for a variety of datasets, they produced accuracies between 60% and 70%. A small improvement in accuracy was seen with larger datasets. Still, this study's restriction was its emphasis on categorizing sentiment into only three groups: neutral, negative, and positive. This method misses the opportunity to use more labels for advanced sentiment analysis. The proposed method focused on conventional textual features and did not incorporate additional linguistic cues commonly found in social media text.
Some studies concentrate on sarcasm detection in online communication in addition to sentiment analysis. In one such study, 1.3 million social media tweets were analyzed using machine learning algorithms like logistic regression, SVMs, and Bidirectional Encoder Representations from Transformers (BERT) [5]. Despite the model's 73.1% accuracy rate, there may be space for improvement in some areas of sarcasm detection, according to the F1-score (72.4), precision (72.2), and recall (71.3) metrics. This demonstrates how difficult it is to reliably detect sarcasm in online text, even when using machine learning techniques.
The given excerpt [6] discusses a study that used contextual features and deep learning to detect sarcasm in online text. Although the precise deep learning model is not stated, the results indicate a promising 94% accuracy and 95% precision in sarcasm identification. This implies that sarcasm detection could benefit from the use of deep learning techniques. The recall metric (94%) highlights the continued difficulties in accurately capturing sarcasm in natural language, though, and suggests that there is still room for improvement.
Chen et al. [7] investigated sentiment analysis in the domain of software engineering using an emoji-aware model known as SEntiMoji. A variety of software development-related datasets, such as JIRA issues, Stack Overflow discussions, code reviews, and Java libraries, were used to assess this model. SEntiMoji's accuracy ranged from 0.876 on the Stack Overflow dataset to 0.891 on the JIRA dataset, indicating promising results. Nonetheless, this method's primary drawback is its reliance on labeled training data. Furthermore, the study only looked at English text, so it's unclear how useful SEntiMoji is for other languages.
Using an Attention-based Bidirectional Long Short-Term Memory (EA-Bi-LSTM) model, Lou et al. [8] examined emoji-based sentiment analysis on a Chinese microblog corpus. Although the model's accuracy was 0.764, the performance was negatively impacted by the imbalance in classes. In particular, the model performed worse at classifying neutral sentiments than it did positive and negative sentiments. This demonstrates how difficult it can be to handle unbalanced data in sentiment analysis tasks. Furthermore, the performance of the model might have been influenced by the caliber of the emoji labels in the dataset.
The impact of emoji data on sentiment analysis was investigated in a different study [9]. Using a dataset that was gathered from Twitter, tweets classified into seven emotions (sad, angry, happy, etc.) were classified using MNB and SVMs. While MNB outperformed SVM in accuracy for larger vocabulary sets, both models' accuracy only slightly improved (by about 0.5%) when emoji data was included. This implies that while emoji alone might not greatly improve sentiment analysis, their combination with other features merits more research. The study also emphasizes how MNB is superior to SVM when handling high-dimensional data, as the addition of emoji increases the feature count.
Several studies use machine learning algorithms to analyze sentiment on Twitter data. SVMs, Maximum Entropy, and NB. Lima et al. [10] proposed a Twitter sentiment analysis framework that combines lexicon-based methods with machine learning classifiers such as NB, SVM, decision tree, and K-Nearest Neighbors (KNN). Their approach improved sentiment classification accuracy for Twitter data. However, the study mainly focused on textual features and did not consider emojis or punctuation, which play an important role in understanding emotions in social media text. The framework combined lexicon-based and machine learning techniques for Twitter sentiment analysis but did not explicitly integrate emoji or punctuation features. Singh et al. [11] conducted a study wherein they compared multiple algorithms and observed that NB exhibited a faster learning speed than J48 in the context of sentiment classification on product reviews.
Some studies investigate deep learning techniques in addition to machine learning approaches. Jin et al. [12] used a combination of hand-crafted contextual features and deep learning features to investigate sarcasm detection in English tweets. The difficulties in capturing sarcasm because of informal language and the scarcity of particular features in the data were emphasized, even though the accuracy wasn't stated directly.
The use of emoji and casual language in social media data presents particular difficulties for sentiment analysis. A social media dataset (size not specified) was used by Tang et al. [13] to study the effect of emoji on sentiment analysis. The model in question was probably created with social media complexity in mind, even though it isn't specifically mentioned. Emoji did, according to their analysis, slightly improve accuracy (by about 0.5%). This implies that, in addition to other features, emoji might have a minor impact that merits more research.
Emoji were investigated for sentiment analysis of photos by Al-Halah et al. [14]. On a dataset of labeled Twitter images (1269 images), their SmileyNet model performed better than earlier models by translating emoji into numerical representations. However, SmileyNet's performance was hampered by issues like uneven training data and inconsistent labeling. These studies show how useful emoji can be in sentiment analysis, but they also stress the importance of weighing emoji against other variables and utilizing high-quality data to create reliable models.
An extensive review of sarcasm detection techniques can be found in "Automatic Sarcasm Detection" [15]. Statistical and deep learning techniques, rule-based classifiers, and other models are covered, with an emphasis on improving performance metrics like F-score and Area Under the Curve (AUC). The study also looks at datasets, particularly shared task datasets like SemEval-2014 and SemEval-2015 and short text datasets like tweets. Notably, in SemEval-2015, the top-performing system achieved an astounding accuracy of 82.75%.
In order to detect sarcasm in tweets, study [16] presents a machine learning model. The study focuses on data from Twitter, though the exact dataset isn't made public. Among the important conclusions are that the accuracy starts at 47.4% and rises to 85.1% when all features are taken into account. The model attains an accuracy rate of 84.3% even when trained exclusively on essential features. The significance of contextual cues and varied features in enhancing sarcasm detection on Twitter is underscored by these findings.
The study examines the use of machine learning algorithms for sarcasm detection on Twitter [17], classifying 31 articles into Adapted Machine Learning Algorithms (AMLA) and Customized Machine Learning Algorithms (CMLA) groups. In AMLA, SVM becomes a popular choice, and both Convolutional Neural Network (CNN) and SVM show good prediction performance. The performance of CMLA algorithms varies because of various text processing and classification characteristics. After attempting to find sarcastic characteristics that both groups share, the study produced eight different clusters. While particular model accuracy is not stated, the paper illustrates various methods for sarcasm detection.
The approach to sarcasm detection used in the paper [18] is multifaceted and includes machine learning, lexical, pragmatic, and syntactic tools. It combines deep learning methods for sarcasm detection in social data, including Attention Mechanisms, recurrent neural networks (RNNs), CNNs, and LSTM models. Features such as capitalization, emoji/emoticons, interjections, bigrams, n-grams, hyperbole, punctuation, and unigrams are all examined. Furthermore, the study explores the difficulties and methods of locating satirical content in textual data. Though the paper provides detailed insights into various approaches for sarcasm detection, it does not provide the specific dataset or accuracy results.
The document [19] indicates a variety of approaches to sarcasm detection in social media, including discrete and neural models. Contextual features, such as historical tweet behavior, have proven effective. Recent studies emphasize feature extraction and are gaining traction and outperforming traditional methods. Overall, integrating contextualized features enhances sarcasm detection algorithms.
From the reviewed literature, it is observed that many studies focus either on textual sentiment analysis or sarcasm detection separately. Very few studies integrate textual information with emoji and punctuation features using an LSTM-based framework. Therefore, this work attempts to bridge this gap.
From the reviewed literature, it is evident that most existing studies focus on sentiment classification using textual information and conventional machine learning or deep learning techniques. Although these approaches have demonstrated good performance, they generally do not exploit contextual cues such as emojis and punctuation, which are widely used in social media communication. Motivated by this limitation, the proposed work integrates textual, emoji, and punctuation features within an LSTM-based framework to provide a richer representation for sentiment classification.
3.1 Feature extraction
Feature extraction plays a critical role in sentiment analysis, including emojis and punctuation marks. It allows us to extract relevant information from textual data that can be used to improve the accuracy of sentiment analysis. This section proposes a feature extraction technique that combines several textual features to enhance sentiment analysis effectiveness.
After extracting textual, emoji, and punctuation features, all features are combined into a single feature vector before being given to the LSTM classifier. This process is referred to as feature fusion.
3.1.1 Sentiment analysis
Sentiment analysis aims to uncover the emotional tone of a sentence. Here, we extract sentiment features using either lexicon-based or machine learning approaches.
•Lexicon-based approach:
We employ a pre-defined sentiment lexicon, a dictionary containing words with positive, negative, or neutral sentiment scores.
Example: Let's consider the sentence "This movie was awful. It deserves 10 out of 10 stars!"
By matching words like "awful" with negative scores and "10" with positive scores in the lexicon, we can identify a potential sentiment mismatch, suggesting sarcasm.
•Machine learning models:
Alternatively, pre-trained sentiment analysis models trained on vast amounts of sentiment-labeled data can be used. These models assign sentiment scores or labels directly to the sentence.
Example: A pre-trained model might analyze the sentence "This movie was awful" and assign a negative sentiment score, further strengthening the suspicion of sarcasm when juxtaposed with the high rating of "10 out of 10 stars".
3.1.2 Punctuation marks
Punctuation marks often convey subtle nuances in tone and intent, making them valuable features for sentiment analysis. We extract features such as the presence and frequency of specific punctuation marks:
•Exclamation points (!) often indicate excitement or strong emotions, but their excessive use in sarcastic statements can be a giveaway.
•Question marks (?) can be used genuinely to ask questions, but they can also be used sarcastically to express disbelief or disapproval.
•Ellipses (...) can introduce hesitation or imply something left unsaid, potentially indicating sarcasm.
Example: The sentence "This is the BEST movie EVER..." uses ellipses to create a sense of forced enthusiasm, hinting at sarcasm. Additionally, the capitalized "BEST" might be another indicator.
3.1.3 Emoji
Emojis are a prevalent form of communication, adding emotional context and expressing feelings. We extract emoji features to capture this information:
•Emoji type: We identify the type of emoji present, such as smiley faces, thumbs up/down, or wink emoji. Certain emojis are more commonly associated with sarcasm (e.g.).
•Emoji quantity: Counting the total number of emojis in a sentence can be informative. An excessive use of emoji, especially those conveying conflicting emotions, can suggest sarcasm.
Example: The sentence "This movie was terrible. " uses a laughing emoji, which contradicts the negative sentiment of "terrible," potentially indicating sarcasm.
3.1.4 Feature extraction
After extracting individual features from sentiment analysis, punctuation marks, and emojis, they are combined into a single feature vector for each sentence. This vector serves as the input for the machine learning model used for sarcasm detection.
There are various ways to achieve feature integration. One common approach is concatenation, where features from each source are simply appended together to form a larger feature vector. Another approach involves feature weighting, where features deemed more informative for sarcasm detection are assigned higher weights in the vector.
By combining these diverse textual features, we aim to create a more comprehensive representation of the text, enabling machine learning models to effectively learn the complex patterns associated with sarcasm and distinguish sarcastic from non-sarcastic language.
3.1.5 Connectionist temporal classification block
The Softmax outputs are then fed into the CTC loss block, which facilitates the alignment of the predicted sequence with the ground truth. The CTC loss enables end-to-end training of the entire system, providing a mechanism for the model to learn the alignment and transcription simultaneously.
3.2 Data acquisition and preprocessing
3.2.1 Data collection
Acquire a sentiment-labeled dataset, where each text sample is assigned a sentiment label (e.g., positive, negative, neutral) and potentially an additional label for sarcasm (e.g., sarcastic, non-sarcastic). Common sources include social media posts, product reviews, or news articles with sentiment annotations.
Initially, 55,328 text samples were collected. After removing duplicate records and incomplete samples, 28,617 records remained. These cleaned samples were divided into training, validation, and testing datasets.
The dataset preparation process consisted of three stages: data collection, data cleaning, and dataset partitioning. Initially, 55,328 text samples were collected from the Twitter dataset. During preprocessing, duplicate records, incomplete entries, and noisy samples were removed, resulting in a cleaned dataset of 28,617 samples. The cleaned dataset was then divided into training, validation, and testing subsets. The training and validation sets were used for model development, while the independent test set was reserved for final performance evaluation. The final test set contained 11,065 samples, and all reported classification metrics were calculated on this test set.
3.2.2 Preprocessing
Combine data from multiple sources, ensuring consistent labeling schemes. Remove duplicates and explore data balancing techniques if significant class imbalances exist. Implement text cleaning functions to: Lowercase text. Remove URLs, mentions (@ symbols), and replace contractions (e.g., "I'm" to "I am"). Tokenize text (split into words) and remove stop words (common words like "the", "a").
3.3 Text representation and feature engineering
3.3.1 Word embeddings
In this study, pre-trained word embedding models, such as GloVe, were utilized to represent words as dense numerical vectors. These embeddings capture semantic relationships between words by mapping each word into a continuous vector space. Given a word w, its embedding vector is obtained by retrieving the corresponding row from the pre-trained embedding matrix:
e(w) = Wiw,:
where,
e(w) = GloVe embedding vector of word w
W = pre-trained GloVe embedding matrix
iw = vocabulary index of word w
Wiw,:= row of the embedding matrix corresponding to word w
3.3.2 Tokenization and padding
Use a Tokenizer to convert text sequences (X = [x1, x2, ..., xn]) into sequences of numerical word indexes (Xidx = [i1, i2, ..., in]), where ik is the index of word xkin the vocabulary. Calculate the vocabulary size (V) as the total number of unique words encountered in the corpus. Pad sequences to a fixed length (maxlength) for consistent model input. Padding can be achieved with zeros or other strategies depending on the model architecture.
3.4 Feature fusion
After preprocessing, the textual data are converted into dense word vectors using pre-trained GloVe embeddings. In addition to textual information, emoji and punctuation features are extracted from each tweet to capture contextual and emotional cues present in social media text. The textual, emoji, and punctuation features are then combined through a feature fusion process to create a unified feature representation. This fused feature vector is provided as input to the LSTM network, which learns sequential patterns and performs binary sentiment classification.
The feature fusion mechanism enables the model to utilize both semantic information from the text and contextual cues from emoji and punctuation. This integrated representation helps the LSTM learn richer patterns from social media text while maintaining a single input representation for sentiment classification.
3.5 Model architecture
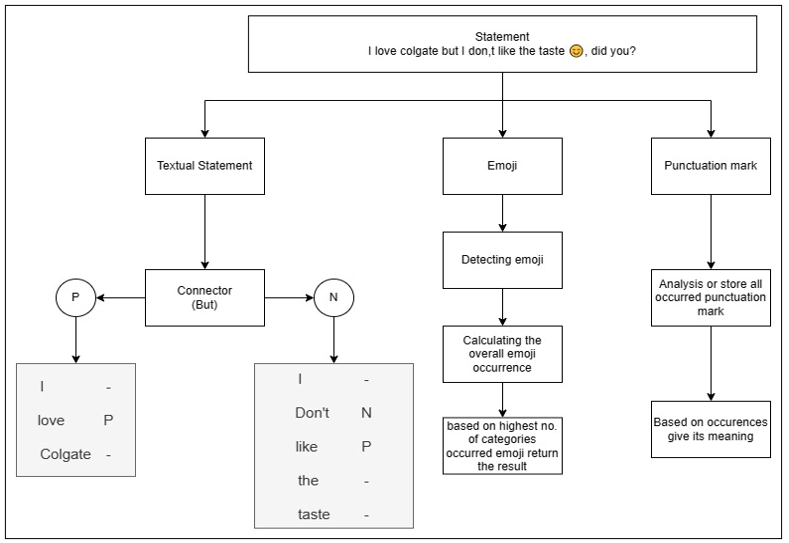
This sentiment analysis system examines text written by users to address sarcasm. Following text cleaning, it extracts features such as sentiment (positive, negative, or neutral), emoji type, and quantity. After that, a machine learning model (GloVe embeddings, LSTM layers) is trained using these combined features. The predicted sentiment and whether or not sarcasm is detected are finally output by the system. The block Diagram of the implementation is shown in Figure 1.

Figure 1. Block diagram of sentiment analysis using emoji, punctuation, and text sentiment analysis
The model in Figure 2 is sequential, which means that its layers are arranged in a linear stack.
Three layers make up the model:
1. An Embedding layer
2. An LSTM layer
3. A Dense layer

Figure 2. Layers of the model
Layer types and shapes of the output:
An Embedding layer is the first layer. It transforms word representations represented by integer indices into dense vectors of a fixed size (100 in this case) for the LSTM layer's input. The output shape is (None, 25, 100), meaning that dense embeddings of size 100 are produced when input sequences of length 25 are accepted.
An LSTM layer makes up the second layer. For every sample in the batch, it processes the input sequences and generates an output of size 64. The output shape of (None, 64) shows that for every input sequence, a vector of size 64 is produced.
There is a Dense layer in the third layer. It is a fully connected layer that uses a single neuron for binary classification, or the detection of sarcasm. Each sample in the batch yields a single scalar output, as indicated by the output shape of (None, 1).
For sentiment classification, the dataset labels were encoded into two classes, where Class 0 represents negative sentiment and Class 1 represents positive sentiment. These labels were used throughout the training and evaluation of the proposed LSTM model.
Table 1 shows the implementation details.
Table 1. Implementation details
|
Parameter |
Value |
|
Embedding |
GloVe |
|
LSTM units |
64 |
|
Epochs |
20 |
|
Batch size |
64 |
|
Optimizer |
Adam |
|
Learning rate |
0.001 |
|
Loss function |
Binary cross-entropy |
|
Dropout |
0.5 |
Note: LSTM = Long Short-Term Memory, GloVe = Global Vectors for Word Representation.
3.5.1 Global Vectors for Word Representation model
Co-occurrence matrix.
•GloVe starts by constructing a co-occurrence matrix X, where Xij represents how often word i appears in the context of word j in the corpus.
•The context of a word can be defined by a window size around that word (e.g., within 5 words).
•This matrix captures the distributional statistics of word occurrences in the corpus.
In the proposed framework, emoji and punctuation information is incorporated as additional contextual information alongside the textual representation. The purpose of including these features is to represent information that may not be fully captured by the textual representation alone. However, the individual contribution of these feature types is not separately quantified in the present study.
Objective function.
The objective function is formulated as:
$J=\sum_{i, j=1}^V f\left(X_{i j}\right)\left(w_i^T \widetilde{w}_j+b_i+\tilde{b}_j-\log \left(X_{i j}\right)\right)^2$ (1)
where,
V is the size of the vocabulary.
Xij is the co-occurrence count between words i and j.
f is a weighting function (commonly used for controlling the impact of high co-occurrence counts).
$w_i \text { and } \widetilde{w}_j$ are the word vectors for words i and j, respectively.
bi and $\tilde{b}_j$ are bias terms.
In the proposed model, pre-trained GloVe embeddings are used to convert words into dense vector representations. These embeddings are used as static (non-trainable) embeddings and are not updated during the training process. The resulting word vectors are then passed to the LSTM layer, which learns the sequential dependencies present in the input text for sentiment classification.
After preprocessing, the cleaned dataset was divided into three subsets: training, validation, and testing. The training set was used to learn the model parameters, the validation set was used for hyperparameter tuning and model selection, and the independent test set was used only for the final performance evaluation. All reported accuracy, precision, recall, and F1-score values correspond to the test dataset.
The experiments were conducted using a publicly available Twitter sentiment dataset containing English-language tweets. The dataset consists of user-generated social media posts collected from Twitter and annotated for binary sentiment classification. Each tweet was assigned a sentiment label based on its emotional polarity, where Class 0 represents negative sentiment and Class 1 represents positive sentiment. The annotations were obtained from the original dataset and were used without modification. Before training, the dataset was preprocessed by removing URLs, user mentions, hashtags, special characters, duplicate records, and missing values. The cleaned tweets were then tokenized and converted into word embeddings using pre-trained GloVe vectors before being provided as input to the LSTM model. Figure 3 shows an example of sentiment analysis.
Figure 3. Example of sentiment analysis
The proposed sentiment analysis model, which was constructed using a LSTM network, was trained and assessed using a dataset of 55,328 text samples. After data cleansing and duplicate removal, 28,617 was the final size of the dataset used for training and validation. An 80-20 train-validation split was utilized to guarantee a strong model evaluation. Using the given dataset, our LSTM model produced a promising accuracy of 93.32% for sentiment analysis. Upon closer inspection of the confusion matrix (shown in Table 2), precision, recall, and F1-score metrics for both positive and negative sentiment classes show balanced performance, with values exceeding 0.90. These results imply that the model can successfully capture sentiment in text, even potentially sarcastic text.
Table 2. Classification report for sentiment classification (class 0: negative, class 1: positive)
|
Classification Report |
||||
|
Class / Metric |
Precision |
Recall |
F1-Score |
Support |
|
0 |
0.92 |
0.96 |
0.94 |
5936 |
|
1 |
0.95 |
0.90 |
0.93 |
5129 |
|
Accuracy |
|
|
0.93 |
11065 |
|
Macro average |
0.94 |
0.93 |
0.93 |
11065 |
|
Weighted average |
0.93 |
0.93 |
0.93 |
11065 |
The sentiment analysis classification report in Table 2 shows remarkable performance. With a precision rate of more than 0.90 (0.92 for class 0 and 0.95 for class 1) and an error rate of less than 8% for both positive and negative classes, the model hardly ever misclassifies sentiment. Less than 10% of actual positive sentiment in the data is missed by the model, as evidenced by recall values above 0.90 (0.96 for class 0 and 0.90 for class 1). This indicates the model captures a sizable portion of true positive sentiment cases. Combining these metrics yields an F1-score that is greater than 0.90 for both classes (0.94 for class 0 and 0.93 for class 1), indicating efficacy. This strong performance is also aided by balanced class sizes, with 5,936 samples for class 0 and 5,129 samples for class 1. The dataset contains both positive and negative sentiment classes with a moderate difference in their sample counts. In the independent test set, 5,936 samples belong to the negative class, and 5,129 samples belong to the positive class. These precise numbers demonstrate the model's robustness overall for sentiment classification tasks. The final cleaned dataset contained 28,617 samples. The model was evaluated on an independent test set containing 11,065 samples. The accuracy, precision, recall, F1-score, and confusion matrix reported below correspond exclusively to these 11,065 test samples.
The test set contains 11,065 samples, including 5,936 negative samples (53.69%) and 5,129 positive samples (46.31%). Therefore, the test data exhibit a moderate class imbalance. To provide a more comprehensive evaluation, precision, recall, and F1-score are reported along with accuracy.
The model correctly classified most positive and negative samples because emojis and punctuation provided additional emotional context. These features helped the LSTM distinguish similar sentences with different emotional meanings.
Examining the confusion matrix (Table 3), we see the model's performance in sentiment classification. For the most part, the model correctly classified the data, with high values on the diagonal (5,701 for class 0 and 4,625 for class 1). This corresponds to 5,701 negative sentiment samples and 4,625 positive sentiment samples being correctly identified. The off-diagonal elements show certain misclassifications (235 for negative sentiment misclassified as positive and 504 for positive sentiment misclassified as negative). Nonetheless, the model successfully captured the true sentiment in the data, given the preponderance of correctly classified samples on the diagonal relative to the off-diagonal elements (789 misclassifications out of 11,065 total samples represent a misclassification rate of approximately 7.1%).
Table 3. Confusion matrix for sentiment classification (class 0: negative sentiment, class 1: positive sentiment)
|
Confusion Matrix |
|||
|
True labels |
Class 0 |
5701 |
235 |
|
Class 1 |
504 |
4625 |
|
|
|
Class 0 |
Class 1 |
|
|
Predicted labels |
|||
The LSTM sentiment analysis model's training and validation accuracy are shown in the provided graph (Figure 4). The x-axis displays epochs, which stand for training iterations, and the y-axis displays accuracy. The green line (training accuracy) ideally increases with epochs, indicating the model learns from the data. Validation accuracy, represented by the blue line, evaluates performance on unseen data and should ideally follow the training accuracy trend closely to prevent overfitting. The graph indicates that the model has a positive learning curve, even though specific values are not available.

Figure 4. Training and validation accuracy graph
The performance comparison of the proposed metric with the state-of-the-art metrics is presented in Table 4. The proposed metric exhibits comparable results. Table 4 shows that previous studies have employed different datasets, feature extraction techniques, learning algorithms, and target tasks. Some studies focus on sentiment classification, while others address sarcasm detection using different evaluation settings. Therefore, the comparison presented in this work is intended to highlight methodological differences rather than to establish direct performance superiority. The proposed method distinguishes itself by integrating textual, emoji, and punctuation features within an LSTM-based framework for sentiment classification.
Table 4. Performance comparison of the proposed matrix with other state-of-the-art matrices
|
Reference No. |
Dataset |
Evolution Parameter |
|||
|
Accuracy (%) |
F1-Score (%) |
Precision (%) |
Recall (%) |
||
|
[2] |
Twitter dataset |
88.2 |
- |
- |
- |
|
[6] |
Chinese Sina microblog corpus |
76.4 |
- |
- |
- |
|
[8] |
JIRA dataset, stack overflow dataset, code review dataset, and Java Library dataset |
89.1 |
- |
- |
- |
|
[9] |
780,000 English tweets |
94 |
87 |
95 |
94 |
|
[10] |
1.3 million social media tweets |
73.1 |
72.4 |
72.2 |
71.3 |
|
[19] |
Amazon product reviews |
90.74 |
90.74 |
- |
- |
|
Proposed method |
Dataset of 28,617 text samples |
93.32 |
93.5 |
93.5 |
93 |
Emojis provide emotional meaning that may not be directly expressed through words. Similarly, punctuation such as repeated exclamation marks and question marks indicates emphasis or emotion. Combining these linguistic cues with textual features enables better sentiment prediction.
The predicted sentiment labels closely match the ground truth labels, as reflected by the reported classification performance metrics.
Sentiment analysis has become an increasingly important tool for understanding public opinion, monitoring customer satisfaction, and extracting valuable insights from textual data in the big data era, where user-generated content is exploding on social media platforms and online forums. In order to meet this urgent need, the need is modeled through a sentiment analysis model based on LSTM is proposed that includes punctuation, emoji, and sarcasm detection. On the sentiment classification task, the suggested model yielded a promising overall accuracy of 93.32%. The classification report showed that performance was evenly distributed between the positive and negative sentiment classes, with both groups exhibiting precision, recall, and F1-score metrics above 0.90. This indicates how well the model captures sentiment while accounting for the impact of sarcasm markers such as punctuation and emojis. The experimental results demonstrate that the proposed model effectively classifies sentiment, achieving high accuracy, precision, recall, and F1-score on the test dataset.
In the future, this research provides opportunities for more study of sarcasm detection. We can improve the model's capacity to separate sarcastic and sincere sentiment by fine-tuning it to take into consideration more complex contextual cues and maybe incorporating third-party sarcasm detection libraries. Further optimization of the model could be facilitated by examining the effects of various punctuation and emoji lexicons on its performance. Insightful directions for future research include investigating methods to reduce potential biases in the training data and incorporating the model into practical applications like customer support chatbots and sentiment analysis on social media.
To sum up, this project effectively created and assessed an LSTM model for sentiment analysis that makes use of punctuation, emojis, and sarcasm detection. The model's high degree of accuracy opens the door for more developments in sarcasm detection and real-world uses.
There is a strong correlation between the subjective and predicted scores for the suggested metric. Although the suggested metric's performance is marginally superior to that of state-of-the-art metrics, it is helpful for a variety of sentiment analysis applications.
[1] Gautam, G., Yadav, D. (2014). Sentiment analysis of Twitter data using machine learning approaches and semantic analysis. In 2014 Seventh International Conference on Contemporary Computing (IC3), Noida, India, pp. 437-442. https://doi.org/10.1109/IC3.2014.6897213
[2] Boiy, E., Moens, M.F. (2009). A machine learning approach to sentiment analysis in multilingual web texts. Information Retrieval, 12(5): 526-558. https://doi.org/10.1007/s10791-008-9070-z
[3] Srishailam, B., Swetha, P., Madhuri, S., Ganesh, P., Muneeruddin, S.K. (2024). Comparative analysis of feature extraction techniques and machine learning models for Twitter text classification. International Journal of Computer Engineering in Research Trends, 11(1s): 46-52. https://doi.org/10.22362/ijcert/2024/v11/i1/v11i1s07
[4] Shamantha, R.B., Shetty, S.M., Rai, P. (2019). Sentiment analysis using machine learning classifiers: Evaluation of performance. In 2019 IEEE 4th International Conference on Computer and Communication Systems (ICCCS), Singapore, pp. 21-25. https://doi.org/10.1109/CCOMS.2019.8821650
[5] Deshmukh, M.R., Joshi, N., Bharati, M. (2025). Context-aware sarcasm detection in text using NLP. In 2025 IEEE Pune Section International Conference (PuneCon), Pune, India, pp. 1-3. https://doi.org/10.1109/PuneCon67554.2025.11378862
[6] Razali, M.S., Halin, A.A., Ye, L., Doraisamy, S., Norowi, N.M. (2021). Sarcasm detection using deep learning with contextual features. IEEE Access, 9: 68609-68618. https://doi.org/10.1109/ACCESS.2021.3076789
[7] Chen, Z., Cao, Y., Lu, X., Mei, Q., Liu, X. (2019). Sentimoji: An emoji-powered learning approach for sentiment analysis in software engineering. In Proceedings of the 2019 27th ACM Joint Meeting on European Software Engineering Conference and Symposium on the Foundations of Software Engineering, Tallinn, Estonia, pp. 841-852. https://doi.org/10.1145/3338906.3338977
[8] Lou, Y., Zhou, J., Zhou, J., Ji, D., Zhang, Q. (2024). Emoji multimodal microblog sentiment analysis based on mutual attention mechanism. Scientific Reports, 14(1): 29314. https://doi.org/10.1038/s41598-024-80167-x
[9] LeCompte, T., Chen, J. (2017). Sentiment analysis of tweets including emoji data. In 2017 International Conference on Computational Science and Computational Intelligence (CSCI), Las Vegas, USA, pp. 793-798. https://doi.org/10.1109/CSCI.2017.137
[10] Lima, A.C.E., de Castro, L.N., Corchado, J.M. (2015). A polarity analysis framework for Twitter messages. Applied Mathematics and Computation, 270: 756-767. https://doi.org/10.1016/j.amc.2015.08.059
[11] Singh, J., Singh, G., Singh, R. (2017). Optimization of sentiment analysis using machine learning classifiers. Human-centric Computing and Information Sciences, 7(1): 32. https://doi.org/10.1186/s13673-017-0116-3
[12] Jin, X., Yang, Y., Wu, Y., Xu, Y. (2024). Research on sarcasm detection technology based on image-text fusion. Computers, Materials & Continua, 79(3): 5225-5242. https://doi.org/10.32604/cmc.2024.050384
[13] Tang, H., Tang, W., Zhu, D., Wang, S., Wang, Y., Wang, L. (2024). EMFSA: Emoji-based multifeature fusion sentiment analysis. PLOS ONE, 19(9): e0310715. https://doi.org/10.1371/journal.pone.0310715
[14] Al-Halah, Z., Aitken, A., Shi, W., Caballero, J. (2019). Smile, be happy: Emoji embedding for visual sentiment analysis. In 2019 IEEE/CVF International Conference on Computer Vision Workshop (ICCVW), Seoul, Seoul, South Korea, pp. 4491-4500. https://doi.org/10.1109/ICCVW.2019.00550
[15] Joshi, A., Bhattacharyya, P., Carman, M.J. (2017). Automatic sarcasm detection: A survey. ACM Computing Surveys, 50(5): 73. https://doi.org/10.1145/3124420
[16] Helal, N.A., Hassan, A., Badr, N.L., Afify, Y.M. (2024). A contextual-based approach for sarcasm detection. Scientific Reports, 14(1): 15415. https://doi.org/10.1038/s41598-024-65217-8
[17] Sarsam, S.M., Al-Samarraie, H., Alzahrani, A.I., Wright, B. (2020). Sarcasm detection using machine learning algorithms in Twitter: A systematic review. International Journal of Market Research, 62(5): 578-598. https://doi.org/10.1177/1470785320921779
[18] Verma, P., Shukla, N., Shukla, A.P. (2021). Techniques of sarcasm detection: A review. In 2021 International Conference on Advance Computing and Innovative Technologies in Engineering (ICACITE), Greater Noida, India, pp. 968-972. https://doi.org/10.1109/ICACITE51222.2021.9404585
[19] Awan, S.S., Amjad, S., Ali, S., Shah, D., Tahir, M. (2026). Efficient sarcasm detection in social media using hybrid CapsNet-LSTM fusion and feature optimization. Social Network Analysis and Mining, 16(1): 41. https://doi.org/10.1007/s13278-026-01579-3