Musab Alzghoul* | Mahmoud Baklizi | Mohammad Alkhazaleh | Osama Qtaish | Hamza Alshawabkeh
© 2026 The authors. This article is published by IIETA and is licensed under the CC BY 4.0 license (http://creativecommons.org/licenses/by/4.0/).
OPEN ACCESS
Reliable evaluation is essential for session-based e-commerce prediction, yet offline benchmarks can be significantly distorted when features derived from future interactions are unintentionally introduced. This study proposes a leakage-resistant evaluation framework based on prefix-only features for trustworthy clickstream prediction. Unlike conventional feature engineering pipelines that may incorporate hindsight information, the proposed framework restricts all predictors to information available at the prediction moment and provides a systematic procedure for identifying and excluding future-dependent variables. The framework is applied to next-category prediction and session-exit prediction using public e-commerce clickstream data under a strict temporal evaluation setting. Experiments are conducted on 165,474 click events from 24,026 anonymous sessions covering 47 countries, with training data collected from months 4–6 and testing data from months 7–8. Using leakage-safe features, Light Gradient Boosting Machine (LightGBM) achieves the strongest class-balanced performance, obtaining a macro-F1 of 0.6313, weighted-F1 of 0.6695, balanced accuracy of 0.6550, and macro-area under the receiver operating characteristic curve (ROC-AUC) of 0.8540. The leakage audit further demonstrates that allowing future-dependent variables can artificially produce perfect session-exit prediction, while raising aggregate accuracy by 0.1443, a margin that a genuinely stronger model might also produce. Aggregate scores therefore cannot reveal leakage, whereas a near-perfect exit result should be treated as a strong warning sign. Across six random seeds, the session block contributes an average +0.0016 in macro-F1, approximately one tenth of the average +0.0157 obtained by replacing bagged trees with boosted trees. These findings highlight that evaluation validity is as important as predictive performance in clickstream modeling. The proposed framework offers a reproducible and transferable protocol for reliable benchmarking of session-based prediction systems. The contribution is an auditable evaluation protocol and a reusable leakage checklist for clickstream benchmarking rather than a new model architecture.
clickstream prediction, session-based modeling, data leakage audit, temporal evaluation protocol, e-commerce analytics, feature engineering
E-commerce platforms record consumer browsing as event logs of products, categories, and pages. These logs expose short-term intent, local browsing persistence, session progression and abandonment, and they support recommender engines, search ranking, adaptive interfaces, and marketing systems. Clickstream logs also allow consumer behavior to be studied without costly proprietary user studies or privileged access to corporate data. Recent surveys confirm that artificial-intelligence recommenders and interactive analytics remain central research themes in e-commerce personalization, user cognition and decision support [1-3].
Historical interaction structure has long been the principal resource for such systems. Matrix factorization established collaborative filtering at scale [4], and subsequent work moved towards sequence and session modeling through recurrent, attention-based and graph-based architectures [5-11]. The study [12] indicated that sequential recommendation remains an active field. Section 2 discusses these developments in detail.
A recurring difficulty in applied e-commerce analytics is that ambitious modeling and trustworthy evaluation are not equally easy to achieve. Studies conducted on proprietary production environments, on multimedia product representations or through live experimentation cannot usually be re-examined by third parties. Benchmark studies on public logs are therefore valuable, because reviewers and independent researchers can inspect the preprocessing steps, repeat the experiments and verify the reported results. Recent work argues along the same lines for transparent data, metrics, and evaluation environments in recommender research [13, 14].
Transparency alone, however, does not guarantee validity. A separate body of work shows that leakage, understood as the use of information that would not be available at prediction time, is a widespread and frequently undetected source of over-optimistic results in machine-learning-based science [15] and in offline recommender evaluation specifically [16]. The choice of data-splitting strategy alone can reorder the apparent ranking of competing models [17]. The risk is acute in clickstream settings, because several natural session descriptors are defined only once the session has ended. The completed length of a session, and the position of a click expressed as a fraction of that length, are the clearest examples. A benchmark that admits such descriptors measures hindsight rather than prediction.
This study therefore addresses one prediction target on public data. The target is not purchase but the next step in a consumer-navigation session. Given the current click and the clicks preceding it within the same session, the model predicts either the product category of the next click or the termination of the session.
This formulation preserves the realism of consumer navigation while ensuring that every conclusion can be verified on public data using ordinary academic computing resources. It also places the work within information-system design rather than model development alone. The primary artifact is a data-engineering protocol: a specification of which derived variables a session-based feature pipeline may legitimately compute, together with an audit procedure for verifying compliance. Such a specification bears directly on analytics governance, because the feature pipelines that serve offline benchmarks commonly also serve production scoring services, where a hindsight variable produces silent degradation rather than a visible error.
The contributions are ordered by weight. The primary contribution is a leakage audit for session-based clickstream benchmarks. The audit identifies the future-dependent variables that inflate next-step and exit prediction, contrasts performance obtained with and without those variables, and specifies a prefix-only protocol that excludes them. It is formalized as a reusable checklist and as an explicit algorithm, so that it can be applied to feature pipelines other than the one studied here. The second contribution is the packaging of this protocol as an open-data workflow covering preprocessing, leakage-safe target construction, temporal splitting, and reporting. The remaining contributions are empirical and subordinate to the protocol. The study reports hold-out results under a temporal split with class-specific metrics, ranking-aware metrics, a sequential baseline, and paired significance testing. It establishes that the prefix-safe session block produces a statistically reliable but practically small class-balanced improvement on this benchmark, of approximately one tenth the magnitude of the gain attributable to boosted tabular learners. It further verifies, across six random seeds and four rolling temporal splits, that the ratio between the two effects is a stable property of the benchmark rather than a feature of one particular run.
A pipeline-validation run on the YOOCHOOSE dataset from the Recommender Systems (RecSys) Challenge 2015 is also reported [18]. Its purpose is to confirm that the audit procedure transfers unchanged to a second public clickstream source, not to provide independent confirmation of the numerical results obtained on the primary dataset. Section 4.8 states the limits of that run explicitly.
Sequence order is the central modeling concern in this literature. Hidasi et al. applied recurrent networks to session transitions in GRU4Rec [5]. Later models extended this approach along three axes: scalability, attention, and representation. Covington et al. [6] described a deep recommender operating at video-platform scale, and Cheng et al. [7] combined memorization and generalization in the Wide & Deep framework. Vaswani et al. [8] introduced the transformer, which has since been adopted widely in sequential recommenders. Bibliometric evidence indicates continued growth in artificial-intelligence recommenders for e-commerce and renewed interest in behavior-intensive personalization [19].
Architectural innovation in session-based recommendation has been substantial. Self-Attentive Sequential Recommendation (SASRec) applies self-attention to user histories to capture long-range dependencies [9]. Session-based Recommendation with Graph Neural Networks (SR-GNN) represents sessions as graphs, so that structure rather than sequence alone can be exploited [10]. BERT for Sequential Recommendation (BERT4Rec) extends this line through bidirectional representations [11]. These models are powerful, but they typically require longer histories, richer item metadata, and more elaborate training procedures than the structured public benchmark considered here.
For structured clickstream data, tree-based supervised learning remains competitive, because it accommodates mixed feature types and nonlinear interactions with limited preprocessing. Quinlan's decision-tree algorithm provides interpretable rule induction [20], and Breiman's random forests reduce variance through ensemble averaging [21]. On moderately sized structured logs, these methods balance predictive accuracy against interpretability, which suits reproducible benchmarking better than end-to-end representation learning.
Reproducible applied machine learning also depends on stable open-source implementations. Scikit-learn provides the preprocessing, training, and evaluation pipelines that have become standard in Python-based research and teaching [22]. The present study follows the same open-source approach rather than relying on commercial platforms.
The primary dataset originates from the University of California, Irvine (UCI) Machine Learning Repository, a long-established source of benchmark data for applied machine learning [23]. The benchmark is structural and limited in scope, but it supports auditable analysis of click order, session transitions, and category transitions. Earlier sequence-aware work, including factorized personalized Markov chains [24] and neural attentive session-based recommendation [25], likewise demonstrates the importance of short-term transition history in user-navigation tasks.
Three further strands of work bear more directly on the present protocol than the architectural literature summarized above. The first concerns leakage. Kapoor and Narayanan [15] surveyed machine-learning-based science across seventeen fields and traced a large body of irreproducible results to leakage, proposing a taxonomy that includes both the use of illegitimate features and the violation of temporal ordering. Ji et al. [16] examined the same problem within recommender evaluation and showed that splits ignoring the global timeline allow models to learn from interactions that would not yet exist at prediction time. The second strand concerns the evaluation protocol. Meng et al. [17] compared common splitting strategies and found that the choice of strategy can itself reorder the measured ranking of recommendation models, which renders results non-comparable across studies. The third strand concerns session termination as a task in its own right. Hatt and Feuerriegel [26] modeled the risk of a user exiting without purchase through a Markov-modulated marked point process, and emphasized the information carried by continuous inter-click timing. Sakar et al. [27] combined aggregated pageview features with a recurrent model of the click sequence to estimate abandonment likelihood in real time. Requena et al. [28] showed that shopper intent can be predicted from coarse-grained clickstream trajectories carrying minimal browsing information. These termination studies rely consistently on dwell time, cart events, or comparable engagement signals that the present benchmark does not record, a point that bears directly on the exit results reported in Section 4.4.
The second dataset used here is YOOCHOOSE, released for the RecSys Challenge 2015, which contains click sessions and buy events from a large European retailer [18]. It is used to establish whether the leakage-safe procedure can be applied without modification to a source with a different schema and a different scale.
The gap addressed by this work is therefore methodological rather than architectural. No new deep architecture is proposed. The question is whether a session-based next-step benchmark can be specified so that its results are reproducible and free of hindsight information, and what such a specification costs in measured performance. The answer is relevant to researchers and educators who require replicable experiments, to reviewers who must judge whether a reported gain is genuine, and to practitioners who deploy lightweight session models without multimodal inputs.
3.1 Primary dataset
The primary dataset is a public clickstream benchmark recording anonymized browsing of an online clothing retailer. Each row represents one click event and carries calendar attributes, a session identifier, a country code, the current main category, the clothing model, the color, the position of the product photograph on the page, the photography type, the price, and the page indicator. The tabular release contains no personal identifiers, no product images, and no confidential customer records. These properties make the benchmark suitable for modeling sessions, categories, and short-term navigation.
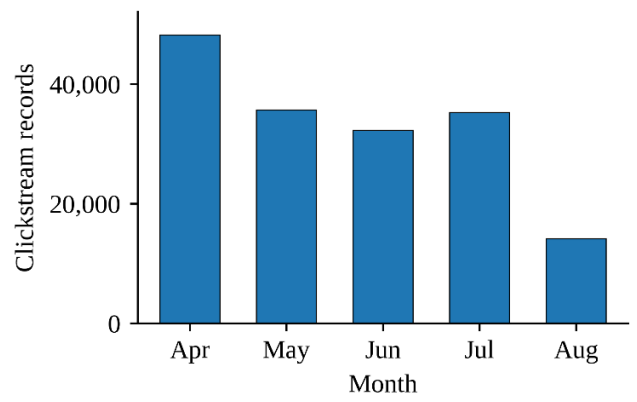
Figure 1 supports the use of a temporal rather than a random split. The hold-out period remains large while being disjoint in time from the training period. This arrangement reproduces the temporal drift that a deployed model would encounter, and it avoids the optimistic estimates that follow when clicks from the same period are distributed at random across training and test sets [16, 17].
Table 1 summarizes the dataset. It contains 165,474 clicks drawn from 24,026 sessions recorded between April and August 2008, covering 47 country codes, four main product categories and 217 clothing models. The average is 6.89 clicks with a median of 4, so the distribution is dominated by short sessions with a long tail of longer, exploratory ones. Prices are retained in their original unit and average 43.80. The monthly record distribution is shown in Figure 1.
Figure 1. Monthly record distribution in the public clickstream dataset
Table 1. Public dataset characteristics
|
Characteristic |
Value |
|
Time period |
April 2008–August 2008 |
|
Total clickstream records |
165,474 |
|
Total sessions |
24,026 |
|
Countries |
47 |
|
Main categories |
4 |
|
Clothing models |
217 |
|
Average clicks per session |
6.89 |
|
Median clicks per session |
4 |
|
Average listed price |
43.80 |
|
Photography variants |
2 |
|
Training clicks (months 4–6) |
116,095 |
|
Test clicks (months 7–8) |
49,379 |
3.1.1 Quantifying temporal drift between the training and test periods
A temporal split is informative only if the two periods differ, so the magnitude of the shift is quantified rather than assumed. Three diagnostics are computed. The first is the population stability index of the main-category distribution between the training period and the test period. The second is the Jensen-Shannon divergence between the first-order category-transition matrices estimated separately on the two periods. The third is a calibration check: the expected calibration error of the best-performing model on the test period, compared with the same quantity measured on a held-out slice of the training period. Table 2 reports these values.
The distribution shift between the two periods is negligible by the conventional threshold: the population stability index is 0.0149, an order of magnitude below the 0.10 boundary. The Jensen-Shannon divergence between the transition matrices is 0.0575, likewise small. Calibration degrades slightly, with expected calibration error rising from 0.0419 within the training period to 0.0519 in the test period, but the increase is minor. The temporal split is therefore a conservative design choice rather than a stress test on this dataset: it eliminates the optimism that a random split would introduce, without imposing a substantial distribution shift. This has a bearing on how the hold-out results should be read. Because the two periods are distributionally similar, the reported figures approximate performance under stationarity, and they should not be presented as evidence of robustness under drift. Establishing that would require a benchmark whose periods actually differ, which this one does not supply.
Table 2. Temporal drift and calibration diagnostics between the training and test periods
|
Diagnostic |
Value |
|
Population stability index, main-category distribution |
0.0149 |
|
Jensen-Shannon divergence, category-transition matrices |
0.0575 |
|
Expected calibration error, held-out training slice |
0.0419 |
|
Expected calibration error, test period (months 7–8) |
0.0519 |
|
Drift classification |
Negligible |
3.1.2 Secondary dataset for pipeline validation: YOOCHOOSE / RecSys Challenge 2015
A second public benchmark is used to establish that the protocol is not specific to a single source. The YOOCHOOSE dataset from the RecSys Challenge 2015 contains anonymized click sessions from a large European e-commerce retailer, together with buying events for a subset of those sessions. The click file records a session identifier, a timestamp, an item identifier, and an item category; the buy file records a session identifier, a timestamp, an item identifier, a price, and a quantity [18].
The YOOCHOOSE events were transformed into the same prefix-only format used for the primary experiment. Events were ordered by session and by timestamp, and the predictors for each observed prefix were computed only from the current event and from events preceding it within the same session. Future-dependent information was excluded, including any indication of whether the current event is the final click of its session, the completed session length, and any post-click purchase record. The label was defined as the next item category or, where the category field proved degenerate, as continuation versus exit.
This second dataset is not introduced in order to raise the reported scores. Its function is to establish that the audit steps execute without modification on a larger and more heterogeneous session log.
3.2 Prediction task and leakage-safe target construction
The target is the main-category value of the next click within the session. The final click of each session is labeled Exit and assigned class 0, and every other click takes the main-category value of the click that follows it. The task is therefore a five-class classification problem with four continuation classes and one termination class. This formulation is operationally relevant, because continuation and termination are acted upon by the same downstream system.
Labels are produced by shifting the category values one step forward within each session. Leakage is prevented by a single constraint: a predictor may be computed only from the current row or from clicks already observed at the moment of prediction. No predictor may encode the next click, the final click, or the completed session length. Three variables are excluded for this reason. The first is a final-click marker, which reveals the exit label directly. The second is completed session length, which is unknown while a session is in progress. The third is relative click position expressed as a fraction of completed session length, which encodes the same information indirectly. Prefix variables remain admissible because they are known before the next click occurs. These include the current click, the observed prefix length, the previous category, the previous page, the count of earlier clicks on the same category, and the count of earlier clicks on the same model. This distinction is the substantive content of the protocol. Where it is not enforced, clickstream results are inflated by information transferred from the target step or from later clicks.
3.3 Feature engineering strategy
The feature set comprises two blocks. The base block describes the current click through month, day, click order, country, current main category, current clothing model, color, photograph location, photography flag, price, secondary price indicator, and page indicator. These variables characterize the current click without summarizing the observed history.
The session block summarizes the visit up to and including the current click. It contains the observed prefix length, an entry-click flag, the count of prior clicks on the same model, the count of prior clicks on the same category, the current-category run length, the previous page indicator, the previous main category, the category two steps back, the previous price, the price delta, the prefix mean price, and the prefix minimum price. Where a normalized position is required, it is defined against a quantity observable in real time, such as a training-set maximum, and never against the length of the current session. The representation is deliberately compact and interpretable. In place of a sequence encoder or multimodal input, it supplies classical learners with a structured summary of progression, repetition, and local state, while preserving the online prediction setting.
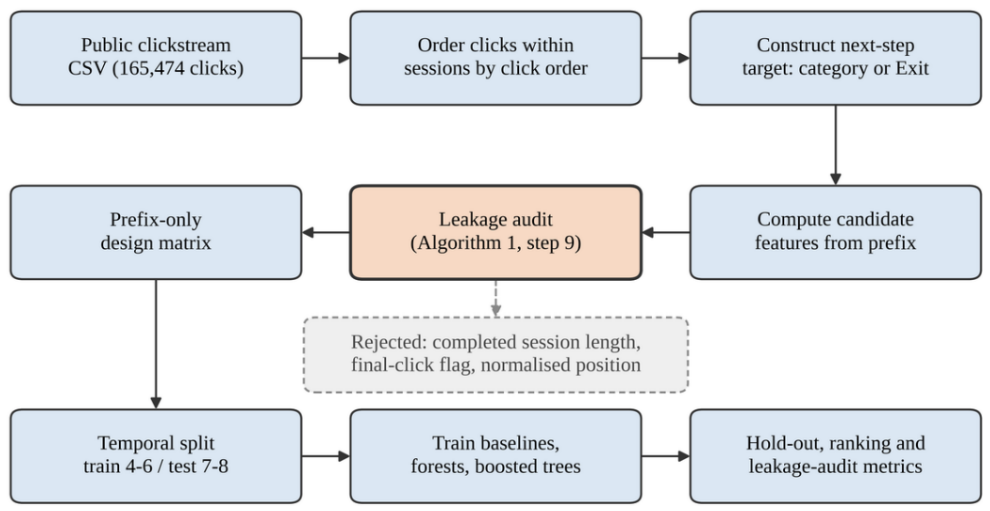
Figure 2. End-to-end methodology pipeline from raw data to evaluation artifacts
Figure 2 depicts the pipeline. It reads the public Comma-Separated Values (CSV) file, orders clicks within sessions, constructs the next-step target, extracts leakage-safe features, splits the chronologically ordered data into training and test sets, trains the baseline and proposed models, and reports hold-out metrics together with interpretation artifacts.
The same stages were applied to YOOCHOOSE. Events were ordered within sessions, the next-step or exit label was constructed, prefix-only features were extracted, a chronological split was applied, and classification, ranking-aware, and leakage-audit metrics were reported. The second dataset is therefore a direct application of the protocol rather than a separate experiment.
3.3.1 Group-wise ablation design for the session block
Because the session block as a whole produces a gain an order of magnitude smaller than the learning algorithm does, the aggregate figure is decomposed rather than reported as a single figure. The block contains three functionally distinct groups. Progression variables record how far the session has advanced and comprise the observed prefix length and the entry-click flag. Repetition variables record returning behavior and comprise the prior same-model count, the prior same-category count and the current-category run length. Transition variables record the immediately preceding state and comprise the previous page, the previous main category, the category two steps back, the previous price, the price delta, the prefix mean price and the prefix minimum price. A group-wise ablation was conducted in which each group was first added to the base block in isolation and then removed from the complete session block, so that both the marginal and the unique contribution of each group is visible. Table 3 reports the resulting macro-F1 values.
Table 3. Group-wise ablation of the prefix-safe session block (random forest, macro-F1)
|
Feature Configuration |
Macro-F1 |
Change vs Base |
|
Base block only |
0.6149 |
- |
|
Base + progression variables |
0.6164 |
+0.0015 |
|
Base + repetition variables |
0.6223 |
+0.0074 |
|
Base + transition variables |
0.6162 |
+0.0013 |
|
Base + complete session block |
0.6170 |
+0.0021 |
|
Complete block minus progression |
0.6186 |
+0.0037 |
|
Complete block minus repetition |
0.6152 |
+0.0003 |
|
Complete block minus transition |
0.6224 |
+0.0075 |
The decomposition is more informative than the aggregate. Added in isolation, repetition variables raise macro-F1 from 0.6149 to 0.6223, a gain of +0.0074, whereas progression contributes +0.0015 and transition +0.0013. The complete block, however, reaches only 0.6170. The isolated gains therefore do not accumulate, and the block as a whole performs worse than its strongest component. The removal columns identify the cause: dropping transition variables from the complete block raises macro-F1 to 0.6224, the best figure in the table, while dropping repetition lowers it to 0.6152, close to the base block alone. Repetition carries the signal; transition variables dilute it. Progression is redundant with the base block by construction, since the source click-order field and the observed prefix length are the same quantity, as Section 6 notes. The practical implication is that a reduced session representation consisting of the repetition group alone would outperform the full session block reported here. That configuration is not adopted as the headline result, because selecting it on the basis of hold-out performance would convert the test period into a selection set; it is recorded as the specification a subsequent study should evaluate on fresh data.
3.4 Learning models and experimental protocol
Seven model configurations were evaluated. The first is a majority-class predictor that always returns the most frequent next class observed in training. The second is a first-order Markov transition baseline that estimates the next-category distribution from training-period transitions. The third and fourth are a decision tree and a random forest trained on the base block alone. The fifth is a random forest trained on the base block together with the prefix-safe session block. The sixth and seventh are gradient-boosted learners, Light Gradient Boosting Machine (LightGBM) and Categorical Boosting (CatBoost), trained on the same prefix-safe representation. Top-k accuracy and threshold-free metrics were computed for all of these configurations; they are evaluation criteria rather than additional models. This design separates the contribution of the session representation from the contribution of the learning algorithm.
Table 4. Hyperparameters of the learning models
|
Learner |
Hyperparameters Used for the Reported Results |
|
Decision tree (base) |
max_depth = 8; min_leaf = 50 |
|
Random forest (base / + session) |
200 trees; max_depth = 12; min_leaf = 5; balanced subsampling |
|
LightGBM + session |
200 trees; num_leaves = 31; learning rate = 0.05; min_child_samples = 50; balanced weights |
|
CatBoost + session |
120 iterations; depth = 6; learning rate = 0.1; balanced weights; native categorical handling |
|
First-order Markov |
order 1; add-one (Laplace) smoothing |
Table 5. Feature groups used in the experiments
|
Group |
Variables |
Purpose |
|
Base click descriptors |
month, day, order, country, category, model, color, location, photography, price, price-2, page |
Encode current-click state |
|
Session-history descriptors |
the observed prefix length, an entry-click flag, the count of prior clicks on the same model, the count of prior clicks on the same category, the current-category run length, the previous page indicator, the previous main category, the category two steps back, the previous price, the price delta, the prefix mean price, and the prefix minimum price |
Observable prefix only; no future info |
|
Target label |
next category or exit |
Label |
The decision tree used a maximum depth of 8 and a minimum leaf size of 50. The random forest used 200 trees, a maximum depth of 12, a minimum leaf size of 5, and balanced subsampling to offset class skew. The two boosted learners were added as stronger tabular models under the identical prefix-only protocol. LightGBM tests histogram-based gradient boosting on the encoded clickstream features, and CatBoost provides native handling of mixed categorical and numerical structure. Table 4 lists the exact hyperparameters used to produce the reported hold-out results, and Table 5 lists the feature groups.
The rolling-validation experiments in Section 4.7 use smaller ensembles than the main experiment: 120 trees for the forests and 300 for LightGBM. Two considerations motivate the difference. First, the rolling design fits twelve models rather than three, and ensemble size was reduced in order to keep the total training cost within the same computational budget. Second, the rolling analysis is a directional stability check on the sign and approximate magnitude of the gains, not the source of the headline figures. The base random forest reaches macro-F1 of 0.6135 on the month-7 test slice with 120 trees, against 0.6149 on the months 7–8 hold-out with 200 trees; the two test periods are not identical, so the comparison is indicative rather than exact, but it is consistent with limited sensitivity to ensemble size in this range. The absolute values obtained under the rolling design should nevertheless not be compared directly with those of the main hold-out. Only the within-split differences are comparable, and those are what the section reports.
Ordinal encoding was applied to the categorical fields so that training and test inputs share a consistent representation. Three properties of this choice affect comparability between models. First, the codes are arbitrary labels and carry no ordinal meaning; country code 12 does not stand in any ordered relation to country code 7. Second, axis-aligned tree learners are invariant to strictly monotone relabeling of an ordinal code, because a split of the form x ≤ k partitions the set of category values regardless of the numeric labels assigned to them. The encoding therefore cannot alter the hypothesis space available to the decision tree, the random forest, or LightGBM. It can affect which partitions are reachable within a limited depth, since an arbitrary ordering may require several splits to isolate a category group that a favorable ordering would isolate in one; this is one reason the trees are grown to depth 12 rather than to a shallower limit. Third, and most directly relevant to comparability with the sequential baseline, the Markov model does not consume the encoded matrix at all. It is estimated from the raw main-category identifiers as transition counts over an unordered state space, so no ordering is imposed on it, and the encoding cannot affect its estimates. CatBoost likewise uses its native categorical handling rather than the ordinal codes. The encoding step is thus confined to the tree learners whose hypothesis space it provably cannot alter.
Training used months 4–6, comprising 116,095 clicks, and testing used months 7–8, comprising 49,379 clicks. Classification performance is reported as accuracy, weighted F1, macro-F1 and balanced accuracy. Ranking-aware performance is reported as top-2 accuracy, top-3 accuracy, per-class average precision, macro PR-AUC and macro one-versus-rest area under the receiver operating characteristic curve (ROC-AUC). The ranking metrics matter because the operational task is not confined to a single hard prediction; it also covers prefetching, menu reordering and candidate ranking, all of which consume a ranked list rather than an arg-max label.
3.4.1 Choice of primary metric
Accuracy and macro-F1 rank the models differently in Table 6, so the choice of headline metric requires justification rather than convention. Macro-F1 is adopted here for three reasons. The first concerns the class distribution. The majority-class baseline reaches accuracy of 0.2453, so a model can appear competitive on accuracy while performing poorly on the least frequent classes; the same baseline reaches macro-F1 of only 0.0788, which exposes that behavior immediately. The second concerns the asymmetry of operational cost. The intended applications, namely next-category prefetching, menu reordering, and adaptive widget placement, act on a predicted class. A system that never predicts Exit incurs only a small accuracy penalty, because Exit is a minority class, yet it forfeits every intervention that depends on detecting a departing user. Macro-F1 weights each class equally and therefore tracks this cost structure more closely than accuracy does. The third concerns comparability between models. Accuracy on this task is largely determined by the two dominant transition patterns, which a first-order transition table already captures, so reporting accuracy alone would obscure precisely the differences this benchmark is designed to measure. Balanced accuracy and macro-ROC-AUC are reported alongside macro-F1 for the same reason. Accuracy is retained in every table so that readers who prefer it may apply it, and Section 4.1 states explicitly where the two metrics disagree and why.
Table 6. Hold-out performance on next-category prediction (months 7–8)
|
Model |
Accuracy |
Weighted F1 |
Macro-F1 |
Balanced Accuracy |
|
Majority class |
0.2453 |
0.0967 |
0.0788 |
0.2000 |
|
First-order Markov |
0.7023 |
0.6489 |
0.6019 |
0.6516 |
|
Decision tree (base) |
0.6961 |
0.6595 |
0.6179 |
0.6500 |
|
Random forest (base) |
0.6976 |
0.6577 |
0.6149 |
0.6505 |
|
Random forest + prefix-safe session |
0.7014 |
0.6597 |
0.6170 |
0.6540 |
|
LightGBM + prefix-safe session |
0.6981 |
0.6695 |
0.6313 |
0.6550 |
|
CatBoost + prefix-safe session |
0.6996 |
0.6662 |
0.6266 |
0.6549 |
3.5 Sequential baseline and statistical validation
A first-order Markov baseline is evaluated on the same temporal split, in order to establish whether the tree learners capture regularities beyond simple category-to-category transition frequencies. The baseline estimates the probability of the next target class from the current main category, using transition counts observed in the training period alone. Let ct denote the current category at click t, and let $y_{t+1} \in \mathrm{Y}$ denote the next target class, where Y contains the four continuation categories and the exit class. The Laplace-smoothed transition probability is computed as follows:
$P\left(y_{t+1} \mid c_t\right)=\left[N\left(c_t \rightarrow y_{t+1}\right)+\alpha\right] /\left[N\left(c_t\right)+\alpha \cdot|Y|\right.$ (1)
where, N(ct→ yt+1) is the number of training transitions from current category ct to target class yt+1, N(ct) is the total number of transitions observed from ct, |Y| = 5 is the number of target classes, and α = 1 is the Laplace smoothing parameter used in the reported experiments. For each test instance, the Markov baseline predicts the target class with the highest smoothed transition probability. The baseline is non-neural, interpretable, and fits with the context of a single-step prediction.
Paired statistical validation was performed on the same hold-out instances. McNemar's test with continuity correction was applied to paired accuracy differences, and paired bootstrap resampling was applied to macro-F1 and balanced accuracy, because these metrics are nonlinear and sensitive to class imbalance. The bootstrap used 2,000 resamples drawn with replacement at the level of the test instance, with the random seed fixed at 42. Reported intervals are percentile intervals at the 95% level. Because clicks belonging to one session are not independent observations, every macro-F1 interval was recomputed with a session-level clustered bootstrap that resamples complete sessions rather than individual clicks, and both sets of intervals are reported in Table 7. They agree closely: for the session block, the click-level interval is (0.0001, 0.0042) against a clustered interval of (0.0002, 0.0042), and across the three comparisons the clustered intervals are between two and eight percent narrower rather than wider, a difference within Monte Carlo error. The likely reason is that sessions in this benchmark are short, with a median of four clicks, so the effective number of independent units is close to the number of test instances. Every conclusion drawn below holds under either resampling unit. The discordant-pair counts underlying each McNemar test are given in Table 7, so that every reported statistic can be recomputed from the published tables. The comparisons of primary interest are not confined to the session block against the base random forest; they include each boosted learner against the same reference, in order to test whether the learning algorithm rather than the representation delivers a reliable gain.
Table 7. Paired significance tests against the base random forest (months 7-8 hold-out)
|
Comparison (vs. Base Random Forest) |
n01 |
n10 |
McNemar |
p |
Macro-F1 Difference |
95% CI (Click) |
95% CI (Session) |
|
Random forest + prefix-safe session |
498 |
310 |
43.28 |
<0.001 |
+0.0021 |
(0.0001, 0.0042) |
(0.0002, 0.0042) |
|
CatBoost + prefix-safe session |
623 |
522 |
8.73 |
0.003 |
+0.0117 |
(0.0095, 0.0140) |
(0.0096, 0.0140) |
|
LightGBM + prefix-safe session |
715 |
691 |
0.38 |
0.540 |
+0.0164 |
(0.0140, 0.0189) |
(0.0141, 0.0186) |
3.6 Leakage-audit protocol and reproducibility checklist
Algorithm 1 states the protocol formally, so that it can be applied to feature pipelines other than the one used here. The input is an event log carrying a session identifier, an ordering key, and an event attribute set; the output is a design matrix in which every column is verifiable as prefix-computable. Steps 1 to 3 construct the target. Steps 4 to 8 build the feature matrix under the prefix constraint. Step 9 is the audit itself: each candidate column is tested against an admissibility condition, and any column whose value would change if the session were truncated at the current click is rejected. Step 11 fixes the temporal split. The condition in Step 9 is the operative definition of a leakage-safe clickstream feature, and it is stated independently of the particular variables used in this study.
|
Algorithm 1. Prefix-only feature construction with leakage audit |
|
Input: event log E = {e1, ..., eN}; session key s(e); order key o(e); attribute set A(e); temporal split boundary tau Output: leakage-safe design matrix X; label vector y; split (train, test)
1: partition E into sessions S = {S1, ..., SM} by s(e) 2: for each session Sj: sort events by o(e) to give e{j,1} ... e{j,Lj} 3: for each event e{j,t}: if t < Lj then y{j,t} <- category(e{j,t+1}) else y{j,t} <- Exit 4: for each event e{j,t}: 5: P{j,t} <- {e{j,1}, ..., e{j,t}} // observed prefix 6: xbase <- A(e{j,t}) // current-click block 7: xprefix <- (f(P{j,t}) for each prefix statistic f) 8: x{j,t} <- xbase || xprefix 9: audit: for each column c of X: recompute c on the truncated log E' = U{j,t}P{j,t}, giving X'(c) if X'(c) ! = X(c) for any row then reject c // c is a function of unobserved future events else accept c 10: train <- {(x, y) : timestamp < tau} test <- {(x, y) : timestamp >= tau} 11: return X, y, (train, test)
Columns rejected by step 9 in the present study: completed session length Lj final-click indicator 1[t = Lj] normalized position t / Lj |
The complete set of hold-out metrics produced by this protocol is reported in Section 4 and is not restated here.
Section 4.2 reports the quantitative contrast between a diagnostic run that admits the rejected variables and the audited run that excludes them. That contrast is the empirical justification for the protocol.
4.1 Overall model comparison
Table 6 reports hold-out results under the prefix-only construction. LightGBM with the prefix-safe session block is the strongest configuration on every class-balanced measure: it attains the highest macro-F1 at 0.6313, the highest weighted-F1 at 0.6695, and the highest balanced accuracy at 0.6550. CatBoost follows closely at 0.6266 macro-F1. The first-order Markov baseline remains the most accurate model on raw accuracy at 0.7023, yet records the lowest macro-F1 among the non-trivial models at 0.6019. The two metrics therefore disagree, and the disagreement is informative rather than incidental: transition memory concentrates its predictions on the two dominant transition patterns, which raises the proportion of correct predictions while degrading performance on the remaining classes. Section 3.4.1 sets out why macro-F1 is treated as the primary metric here.
The strength of the first-order baseline merits explanation in its own right, since it is not the expected outcome once structural features are added. Three observations account for it. First, the feature importances reported in Section 4.5 are consistent with it: the current main category and the previous main category together account for approximately 0.35 of total Gini importance, and the clothing model, which is close to a refinement of category, accounts for a further 0.27. The tree learners therefore devote most of their capacity to reconstructing precisely the conditional distribution that a transition table stores outright. Second, the state space is small. With four continuation categories and one exit class, the transition table contains twenty-five cells estimated from 116,095 training transitions, so every cell is densely populated, and the maximum-likelihood estimate lies close to the underlying conditional. A structural learner cannot improve on a well-estimated conditional distribution unless the additional conditioning variables carry information beyond it. Third, apparel browsing exhibits strong local persistence, in that consecutive clicks frequently remain within the same category, and this is exactly the regularity a first-order chain captures. What the transition table cannot do is allocate probability sensibly across the minority classes, and this is where the boosted learners recover their advantage: the Markov baseline records the lowest macro ROC-AUC of the non-trivial models at 0.8005, against 0.8540 for LightGBM under the ranking metrics reported in Section 4.3.
Adding the prefix-safe session block to a random forest produces a small positive change. Macro-F1 moves from 0.6149 for the base forest to 0.6170 with the session block, a paired-bootstrap difference of +0.0021 with a 95% confidence interval of (0.0001, 0.0042), or (0.0002, 0.0042) when complete sessions rather than individual clicks are resampled. Across the six seeds examined in Section 4.7.1, the same difference averages +0.0016 with a standard deviation of 0.0003 and never changes sign, so the effect is real rather than an artifact of one initialization. Its magnitude is nevertheless the point. The corresponding difference for LightGBM against the same reference is +0.0164, with a confidence interval of (0.0140, 0.0189) and a six-seed mean of +0.0157; for CatBoost it is +0.0117, interval (0.0095, 0.0140). The gain attributable to the learning algorithm is therefore roughly ten times the gain attributable to the session representation. The claim made here is correspondingly precise: prefix-only session features contribute a small but consistent improvement, while the substantive and reproducible gain comes from replacing bagged trees with boosted trees. A macro-F1 difference of approximately 0.016 remains modest in absolute terms and is unlikely on its own to determine whether a deployment succeeds; what the evidence establishes is that it is reliable and consistently signed, not that it is large.
Table 7 reports the discordant-pair counts behind each comparison, and they expose a distinction that is easy to lose. McNemar's test evaluates paired accuracy, not macro-F1, and on this benchmark the two diverge sharply. LightGBM against the base forest produces 715 and 691 discordant pairs, an almost exact balance that yields a McNemar statistic of 0.38 and p = 0.540: the two models are indistinguishable in the proportion of clicks they classify correctly. Their macro-F1 difference is nonetheless +0.0164 with an interval excluding zero, because LightGBM redistributes its errors across classes rather than reducing their number. The session block inverts the pattern, with 498 against 310 discordant pairs, a McNemar statistic of 43.28 and p below 0.001, alongside a macro-F1 difference of only +0.0021. Reporting a McNemar p-value in support of a macro-F1 claim would therefore have produced two errors in opposite directions on this dataset. Each claim is matched to its own test throughout: McNemar for accuracy, paired bootstrap for macro-F1 and balanced accuracy.
4.2 Leakage audit: Diagnostic and audited feature sets contrasted
The claim that future-dependent features inflate performance is quantified here rather than asserted. Two runs were executed with the same learner, the same temporal split, and the same base features. The audited run applies the protocol of Algorithm 1. The diagnostic run additionally admits the three columns that step 9 rejects: completed session length, the final-click indicator, and click position normalized by completed session length. Table 8 contrasts the two.
Table 8. Diagnostic and audited feature sets contrasted (Categorical Boosting (CatBoost) + session block, identical split)
|
Metric |
Diagnostic Run |
Audited Run |
Inflation |
|
Accuracy |
0.8439 |
0.6996 |
+0.1443 |
|
Weighted F1 |
0.8440 |
0.6662 |
+0.1778 |
|
Macro-F1 |
0.8520 |
0.6266 |
+0.2254 |
|
Balanced accuracy |
0.8516 |
0.6549 |
+0.1967 |
|
Exit precision |
1.0000 |
0.3204 |
+0.6796 |
|
Exit recall |
1.0000 |
0.0789 |
+0.9211 |
|
Exit F1 |
1.0000 |
0.1266 |
+0.8734 |
|
Exit average precision |
1.0000 |
0.2415 |
+0.7585 |
The inflation is concentrated almost entirely in the exit class, which is the expected pattern, since each rejected column is a near-deterministic function of the exit label. Under the diagnostic run, exit precision, recall, F1, and average precision all reach exactly 1.0000. Perfect recovery of a class that depends on knowing where the session ends is not attainable from information available before the next click occurs, and it should be read as a diagnostic signature rather than as a result. Under the audited run, the same F1 is 0.1266. The aggregate figures move far less: accuracy rises from 0.6996 to 0.8439 and macro-F1 from 0.6266 to 0.8520. That asymmetry is the practically useful part of the audit. A reader who encounters only an aggregate score cannot tell whether a clickstream benchmark is leaking, because a 0.14 accuracy gap is within the range that a genuinely better model might produce; an exit or abandonment figure at or near 1.0000 should be treated as a strong indication that the pipeline requires auditing.
4.3 Ranking and threshold-free metrics
Because the operational use of the model is next-step prefetching and menu reordering rather than a single hard decision, Table 9 reports top-k accuracy and threshold-free ranking metrics. All tree models reach top-3 accuracy between 0.907 and 0.909 and top-2 accuracy of approximately 0.845. The session-aware and boosted models raise macro-ROC-AUC from 0.8005 for the Markov baseline to 0.8540 for LightGBM, and macro average precision from 0.5309 to 0.6489, which indicates better-ordered probability estimates across all five classes rather than an improvement at one decision threshold. Exit average precision rises from 0.1495 to 0.2438 over the same comparison.
Table 9. Top-k accuracy and threshold-free ranking metrics (one-vs-rest)
|
Model |
Top-2 |
Top-3 |
Exit AP |
Macro AP |
ROC-AUC |
|
Majority class |
0.4451 |
0.6164 |
0.1417 |
0.2000 |
0.5000 |
|
First-order Markov |
0.8439 |
0.9044 |
0.1495 |
0.5309 |
0.8005 |
|
Decision tree (base) |
0.8441 |
0.9067 |
0.1935 |
0.6085 |
0.8348 |
|
Random forest (base) |
0.8442 |
0.9073 |
0.1999 |
0.6188 |
0.8382 |
|
Random forest + prefix-safe session |
0.8449 |
0.9081 |
0.2372 |
0.6464 |
0.8529 |
|
LightGBM + prefix-safe session |
0.8446 |
0.9086 |
0.2438 |
0.6489 |
0.8540 |
|
CatBoost + prefix-safe session |
0.8450 |
0.9088 |
0.2415 |
0.6440 |
0.8526 |
These figures map onto concrete interface constraints. A top-3 accuracy of 0.9086 means that for roughly nine navigation steps in ten, the category the user selects next is among the three the model ranks highest. Three is a common capacity limit in e-commerce interfaces: mobile navigation bars and continue-browsing strips typically expose between two and four destinations before a further tap is required, and prefetch budgets are usually set at a small number of candidate pages in order to control bandwidth and cache pressure. Under a three-slot design, the difference between the Markov baseline at 0.9044 and LightGBM at 0.9086 corresponds to approximately four additional correctly anticipated steps per thousand. That is a small operational difference, and it is stated here so that the ranking figures are not read as a larger practical gain than they represent. The consequential comparison is with a static ordering rather than between learners: the majority-class ordering reaches top-3 accuracy of 0.6164, so a model-driven ordering anticipates the next category approximately 29 percentage points more often than a fixed menu. Top-2 accuracy of approximately 0.845 is the corresponding figure for a two-slot layout, and top-1 accuracy, reported as accuracy in Table 6, is the figure for an interface that surfaces a single suggestion.
4.4 Class-specific performance and the difficulty of exit prediction
Table 10 reports per-class precision, recall, and F1 for LightGBM with the prefix-safe session block, which Table 6 identifies as the strongest configuration. Exit reaches an F1 of 0.1530, with precision of 0.3176 and recall of 0.1008, and an average precision of 0.2438 against 0.1495 for the Markov baseline. The continuation classes are predicted well, with F1 between 0.7228 and 0.7882. The comparison with CatBoost is instructive: at almost identical exit precision, 0.3176 against 0.3204, LightGBM recovers 0.1008 of exit instances against 0.0789, which lifts exit F1 from 0.1266 to 0.1530. The margin between the two boosted learners on the aggregate metrics is therefore driven largely by the minority class. Even so, the model remains substantially more useful for anticipating continuation than for anticipating termination.
The gap between these two capabilities is the principal limitation of the audited benchmark, and it warrants examination rather than acknowledgement alone. Three explanations are consistent with the observed pattern, and they carry different implications for subsequent work.
The first explanation is that the decision to leave is partly exogenous to the click sequence. Termination may follow from interruption, fatigue, satisfaction of an information need, or a decision taken away from the interface. None of these leaves a trace in a log of category, model, color, price, and page. If this explanation holds, the prefix-only ceiling on exit is genuine, and no further feature engineering over the recorded fields will lift it materially.
Table 10. Class-specific metrics for the proposed model (Light Gradient Boosting Machine (LightGBM) + prefix-safe session) on the months 7-8 hold-out
|
Class |
Precision |
Recall |
F1-Score |
|
Exit (0) |
0.3176 |
0.1008 |
0.1530 |
|
Category 1 |
0.7081 |
0.8408 |
0.7688 |
|
Category 2 |
0.6648 |
0.7918 |
0.7228 |
|
Category 3 |
0.7135 |
0.7382 |
0.7257 |
|
Category 4 |
0.7710 |
0.8063 |
0.7882 |
The second explanation is that the informative signal exists but is not recorded in this dataset. The session-termination literature relies heavily on timing. Hatt and Feuerriegel model inter-click intervals explicitly and report that the continuous time between clicks carries substantial information about exit risk [26], while Sakar et al. combine pageview aggregates with a sequence model to estimate abandonment [27]. The present benchmark records click order but no timestamps at click resolution, no dwell time, no scroll depth, and no cart events. Under this explanation, the low exit F1 is a property of the data source rather than of the protocol, and the explanation is testable: the same audit applied to a log carrying dwell time should raise Exit performance while leaving continuation performance approximately unchanged.
The third explanation is that the task formulation disadvantages the minority class. Exit is treated here as a fifth value of a categorical target and is scored under an arg-max decision rule, which suppresses recall for a class with a low prior. Recall of 0.1008 against precision of 0.3176 is the characteristic signature of that mechanism, and the difference between the two boosted learners noted above shows how sensitive the result is to where the decision boundary happens to fall. Two reformulations follow directly. Exit prediction can be separated into a dedicated binary head, so that a threshold is tuned against an explicit cost ratio rather than fixed implicitly at arg-max; the threshold-free average precision of 0.2438 already indicates more usable ranking information than the F1 of 0.1530 suggests. Alternatively, termination can be modeled as a discrete-time hazard, that is, as the probability that a session ends at step t given that it has reached step t. This formulation matches the sequential structure of the decision, admits prefix-only covariates without violating the audit, and connects the task to the point-process treatment used in the termination literature [26].
Neither reformulation is implemented here, because each changes the prediction target and would require its own evaluation protocol and its own leakage audit. They are recorded as the specific next steps that the present result motivates, and they are listed again in Section 6.
4.5 Feature importance and behavioral interpretation
Table 11 lists the ten strongest features of the session-aware random forest by Gini importance. The random forest is used for this purpose because its importances are comparable across features on a single scale. The dominant predictors are the clothing model at 0.2710 and the current main category at 0.2367, followed by recent transition context in the previous main category at 0.1156 and the category two steps back at 0.0507. Among the prefix-safe session variables, current-category run length at 0.0379, prior same-category count at 0.0259, and prefix mean price at 0.0224 carry modest weight, while raw position variables fall outside the top ten entirely. This ordering is consistent with a leakage-free reading: the predictive signal lies in product and category state together with short transition history and local repetition, and not in the position of a click within a session whose length cannot be known in advance.
Table 11. Top-ten feature importances for the interpretability model (random forest + prefix-safe session)
|
Rank |
Feature |
Importance |
|
1 |
Clothing model |
0.2710 |
|
2 |
Current main category |
0.2367 |
|
3 |
Previous main category |
0.1156 |
|
4 |
Category two steps back |
0.0507 |
|
5 |
Price |
0.0460 |
|
6 |
Color |
0.0384 |
|
7 |
Current-category run length |
0.0379 |
|
8 |
Prior same-category count |
0.0259 |
|
9 |
Prefix mean price |
0.0224 |
|
10 |
Page |
0.0208 |
Because the random forest is not the strongest learner, importances for LightGBM and CatBoost are reported in Table 12, with the native split-based measure alongside permutation importance computed on the hold-out set. The two measures disagree so sharply that reporting either alone would mislead. LightGBM distributes its split gain broadly, assigning only 0.0183 to the current main category, yet permuting that same column costs 0.4102 of macro-F1, by far the largest effect for any feature in either model. The explanation is that split gain records how often and how profitably a variable is used for partitioning, whereas permutation importance records how much the prediction depends on it; a variable that a few early splits separate cleanly is used rarely and matters enormously. CatBoost, whose native measure already places the current category at 0.4190, shows far closer agreement between the two.
Table 12. Feature importances for the best-performing learners (LightGBM and CatBoost, prefix-safe session block)
|
Feature |
LightGBM Split Gain |
LightGBM Permutation |
CatBoost Native |
CatBoost Permutation |
|
Current main category |
0.0183 |
0.4102 |
0.4190 |
0.2313 |
|
Clothing model |
0.1162 |
0.0012 |
0.3555 |
0.1213 |
|
Prefix mean price |
0.1168 |
0.0001 |
0.0057 |
−0.0002 |
|
Click order/prefix length |
0.0923 |
0.0034 |
0.0097 |
0.0012 |
|
Day |
0.0875 |
0.0006 |
0.0019 |
0.0002 |
|
Price delta |
0.0647 |
−0.0005 |
0.0036 |
−0.0002 |
|
Current-category run length |
0.0548 |
0.0064 |
0.0203 |
0.0038 |
|
Prior same-category count |
0.0513 |
0.0008 |
0.0112 |
0.0008 |
|
Page |
0.0317 |
0.0103 |
0.0268 |
0.0085 |
|
Previous main category |
0.0153 |
−0.0013 |
0.0143 |
−0.0026 |
Two substantive points follow. The current main category is the single indispensable predictor for both boosted learners, which corroborates both the random-forest ordering and the strength of the transition baseline discussed in Section 4.1. The clothing model, by contrast, separates them: permuting it costs CatBoost 0.1213 of macro-F1 but LightGBM only 0.0012, so CatBoost depends heavily on the 217-value categorical field that its native handling encodes directly, whereas LightGBM recovers the same information from the ordinally encoded category and its prefix context. This is the clearest available account of why the two learners reach similar aggregate scores by different routes. Among the session variables, current-category run length carries the largest permutation effect in both models, at 0.0064 and 0.0038, which is consistent with the ablation in Table 3 attributing the session block's contribution to the repetition group.
4.6 Interpretation and validity considerations
Three findings define the contribution. The session block yields a small positive gain that is stable across seeds and across temporal splits, but it is approximately one tenth of the gain obtained by replacing bagged trees with boosted trees. That contribution is concentrated in the repetition variables rather than distributed across the block. And session termination remains the hardest element of the task under honest features. Every feature used remains computable from the current click and its observed prefix, and no completed-session length, final-click flag, or final-position normalization enters the pipeline at any stage. The resulting claim is deliberately narrow: under a leakage-safe protocol, boosted tabular learners improve class-balanced and ranking quality on this public clickstream task by a small but reliable margin, while termination remains difficult in the absence of future-dependent information.
4.7 Rolling temporal robustness
To test whether these conclusions survive movement of the train/test boundary, a rolling temporal evaluation was run over four successive splits: training on month 4 and testing on month 5; training on months 4–5 and testing on month 6; training on months 4–6 and testing on month 7; and training on months 4–7 and testing on month 8. Table 13 reports macro-F1 for the base random forest, for the forest with prefix-safe session features, and for LightGBM, together with the gains over the base forest. Both gains are positive in all four splits and neither changes sign. The session-feature gain averages +0.0020, ranging from +0.0011 to +0.0034; the LightGBM gain averages +0.0145, ranging from +0.0126 to +0.0164. The ratio between the two is therefore preserved as the boundary advances through time, and it matches the ratio observed on the primary hold-out. What the rolling analysis establishes is not that one effect is stable and the other is not, but that the difference in their magnitudes is itself a stable property of this benchmark rather than a feature of one particular split.
Table 13. Rolling temporal robustness (macro-F1)
|
Split (Train -> Test) |
Random Forest Base Macro-F1 |
Random Forest + Session Macro-F1 |
Session Gain |
LightGBM Macro-F1 |
LightGBM Gain |
|
4 -> 5 |
0.6185 |
0.6196 |
+0.0011 |
0.6322 |
+0.0137 |
|
4-5 -> 6 |
0.6063 |
0.6083 |
+0.0020 |
0.6189 |
+0.0126 |
|
4-6 -> 7 |
0.6135 |
0.6150 |
+0.0016 |
0.6299 |
+0.0164 |
|
4-7 -> 8 |
0.6213 |
0.6247 |
+0.0034 |
0.6365 |
+0.0152 |
|
Mean |
– |
– |
+0.0020 |
– |
+0.0145 |
4.7.1 Stability of the reported figures across random seeds
All results in this study were produced by a single documented pipeline under one declared random seed (42). The feature specification, the ordinal codebook, and the temporal split are fixed in the accompanying replication script, and every table is regenerated from that script rather than assembled from separate runs. Because macro-F1 for ensemble learners depends on the seed, the stability of each figure was measured across six seeds (0, 7, 42, 99, 123, 2024). Table 14 reports the results. The standard deviation of macro-F1 does not exceed 0.0005 for any configuration, which is below the fourth decimal place at which results are reported, and the sign of every reported gain is invariant across all six seeds. The majority, Markov and decision-tree configurations are deterministic and show no variation at all. Reported differences are therefore properties of the models rather than of a particular initialization, and the ordering of the session-block and learning-algorithm gains discussed in Section 4.1 holds under every seed tested.
Table 14. Stability of hold-out macro-F1 across six random seeds (0, 7, 42, 99, 123, 2024)
|
Configuration |
Mean |
SD |
Min |
Max |
|
Majority class |
0.0788 |
0.0000 |
0.0788 |
0.0788 |
|
First-order Markov |
0.6019 |
0.0000 |
0.6019 |
0.6019 |
|
Decision tree (base) |
0.6179 |
0.0000 |
0.6179 |
0.6179 |
|
Random forest (base) |
0.6156 |
0.0004 |
0.6149 |
0.6160 |
|
Random forest + prefix-safe session |
0.6172 |
0.0002 |
0.6170 |
0.6174 |
|
LightGBM + prefix-safe session |
0.6313 |
0.0000 |
0.6313 |
0.6313 |
|
CatBoost + prefix-safe session |
0.6266 |
0.0004 |
0.6262 |
0.6271 |
|
Gain: session block vs random forest base |
+0.0016 |
0.0003 |
+0.0012 |
+0.0021 |
|
Gain: LightGBM vs random forest base |
+0.0157 |
0.0004 |
+0.0153 |
+0.0164 |
|
Gain: CatBoost vs random forest base |
+0.0110 |
0.0005 |
+0.0105 |
+0.0117 |
4.8 Pipeline-validation run on YOOCHOOSE
A run on the YOOCHOOSE click log is reported in Table 15. It used the first 10,000 sessions in chronological order, comprising 39,218 click events. Sessions were split chronologically into 70% for training and 30% for testing, which yielded 27,619 training clicks and 11,599 test clicks. The prefix-only feature logic was retained without modification, and no final-click, completed-session-length, or post-click purchase information entered the predictors.
The full YOOCHOOSE release reports 33,040,175 click records, 1,177,769 buy records, 9,512,786 training sessions, and 2,312,432 test sessions. The sample used here carries the click fields session identifier, timestamp, item identifier, and item category. In this particular chronological sample, the item-category field takes a single value, so the five-class formulation collapses to a binary one of continuation versus exit.
This has a direct consequence for what the run can support, and the framing is stated plainly. Because the category field is degenerate, the run does not test next-category prediction at all, and it is not external validation of the results in Table 6. It is a validation of the pipeline. It establishes that the ordering, target construction, prefix-only feature extraction, chronological splitting, and audit steps execute correctly on a second public source with a different schema and a different scale. The majority and Markov baselines coincide at an accuracy of 0.7414, because a constant current category leaves the transition table with a single row. The random forest with prefix-safe session features records the strongest class-balanced result in this run, at macro-F1 of 0.5916 and balanced accuracy of 0.6457, which indicates that prefix-derived repetition and progression variables separate continuation from termination when category information is unavailable. That finding is limited but coherent, since in this degenerate setting the session block is the only source of signal present, and it is consistent with the ablation in Table 3 locating the block's contribution in the repetition variables. Any claim of cross-dataset generalization requires a run on the complete click file with a non-degenerate category field, which Section 6 identifies as the principal outstanding item.
Reproduction. These values were produced by executing the prefix-only protocol on the YOOCHOOSE click sample with the command: python yoochoose_prefix_safe_benchmark.py --clicks yoochoose-clicks-sample.dat --sample-sessions 10000. The script orders events within sessions, constructs the next-category and Exit target, computes prefix-only features, applies a chronological session split, and reports accuracy, weighted F1, macro-F1, and balanced accuracy.
A full-scale run should additionally report top-k accuracy and the diagnostic-versus-audited contrast of Table 8, so that the distortion introduced by final-click and post-click purchase variables can be measured on a second source. If that run reproduces the pattern observed on the primary dataset, the contribution extends to a cross-dataset auditing protocol. If it does not, the divergence identifies a boundary condition on the protocol and should be reported as such.
Table 15. Pipeline-validation run on 10,000 chronological YOOCHOOSE sessions under the prefix-only protocol
|
Model |
Accuracy |
Weighted F1 |
Macro-F1 |
Balanced Accuracy |
Status/Role |
|
Majority class |
0.7414 |
0.6312 |
0.4257 |
0.5000 |
Baseline frequency control |
|
First-order Markov |
0.7414 |
0.6312 |
0.4257 |
0.5000 |
Transition-memory baseline; identical to majority because the category field is constant |
|
Random forest (base) |
0.4181 |
0.4324 |
0.4161 |
0.5087 |
Current-event descriptors only |
|
Random forest + prefix-safe session |
0.6180 |
0.6417 |
0.5916 |
0.6457 |
Strongest class-balanced result in this run |
|
LightGBM + prefix-safe session |
0.7418 |
0.6334 |
0.4298 |
0.5016 |
Highest accuracy, negligible balance gain |
|
CatBoost + prefix-safe session |
0.7414 |
0.6312 |
0.4257 |
0.5000 |
Matches the majority baseline on this binary task |
The application scope is narrow, but it is real. A next-step category model can support low-cost interventions such as category prefetching, navigation-menu reordering, adaptive widget placement, and history-aware exploration prompts. Because the model consumes clickstream fields alone, it is cheaper to implement and to monitor than multimodal alternatives that require image pipelines and large-scale ranking infrastructure. Evidence that users respond to personalized recommendations while browsing supports the value of such interventions, although that literature addresses perception and intention rather than next-step prediction, and it is cited here as motivation rather than as method [29, 30].
The protocol also has a role at the level of system design, which is where its contribution to information-system practice lies. In a production analytics stack, session features are typically computed once and served both to offline evaluation and to online scoring. The admissibility condition in step 9 of Algorithm 1 can be implemented directly as a validation rule within the feature store: any derived column whose value changes when the session is truncated at the current event is rejected before it reaches either consumer. This converts the audit from a manual review step into an automated contract between the feature pipeline and the models that depend on it, which is the form in which it is most likely to be enforced in practice. The same rule doubles as a documentation artifact, since the list of rejected columns records why an audited benchmark reports lower figures than an unaudited pipeline would.
The workflow also has value for teaching and for peer review. Public data allow preprocessing choices, evaluation procedures, and reported metrics to be re-examined independently. The manuscript therefore contributes an experimental workflow for transparent work with navigation data, and not only a set of results.
The YOOCHOOSE component connects the protocol to a larger public session log carrying both click and purchase signals, which allows subsequent work to examine whether prefix-only modeling behaves comparably under category-navigation and purchase-oriented objectives [18].
More broadly, the study argues for a particular standard of evidence in applied machine learning. Claims resting on production A/B tests, conversion optimization, enterprise privacy management, or multimodal customer profiling are attractive but rarely replicable outside the originating organization. Benchmark evidence is less striking, but it is more persuasive when the claims are confined to what is observable and reproducible.
The primary benchmark contains no explicit purchase outcomes, no product descriptions, and no media assets, only structured clickstream fields. The prediction target is therefore the next category rather than purchase intent or conversion. Category identifiers are numeric rather than textual, which prevents finer domain decomposition. Work on multi-item purchase modeling and on deep sequential pipelines indicates the direction that becomes available once richer histories are recorded [31, 32].
The measurements come from a single apparel retailer over five months. Whether they transfer to electronics, groceries, or multi-vendor marketplaces is untested. The models are deliberately simple and interpretable, and recurrent, transformer-based, and graph-based sequence learners are not compared under this split; such a comparison would be informative and is proposed below [5, 9-11, 25].
One structural property of the feature set should also be recorded, because it bears on the ablation. The click-order field of the source data and the observed prefix length are the same quantity, since a session's clicks are numbered consecutively from its first event. Progression variables are therefore redundant with the base block by construction rather than uninformative in principle, which is the most likely reason that removing them from the complete session block raises macro-F1 rather than lowering it. A benchmark whose base block excluded click order would not exhibit this redundancy, and the progression group would have to be re-evaluated there.
The apparel setting may itself contribute to the difficulty of exit prediction. This explanation is advanced as a hypothesis rather than as a finding, because the present data cannot test it. Apparel browsing is frequently exploratory, visual and preference-driven: users compare styles, colors, prices and models without a fixed purchase plan, and may leave because of fatigue, distraction or uncertainty about fit rather than because of any pattern visible in the click sequence. The absence of dwell time, scroll depth and cart events in this benchmark makes such terminations especially hard to anticipate. Utilitarian domains such as electronics, office supplies and groceries may behave differently, since purchases there are more often governed by explicit specifications, known needs and repeat-purchase patterns. A single-domain dataset provides no contrast against which to test any of this. A direct test requires the same audited protocol applied to logs from at least one exploratory and one specification-driven retailer, with Exit average precision compared across them under identical feature availability. A weaker within-dataset test would compare Exit performance between sessions with high and low model-switching rates, on the reasoning that exploratory sessions should exhibit both higher switching and lower Exit predictability. Until such a test is conducted, the findings should be read as applying to visually driven, exploration-heavy retail contexts, with transfer to other domains left open.
The YOOCHOOSE component reduces but does not remove the single-dataset limitation. Because the sample used carries a constant category field and covers only the first 10,000 chronological sessions, the substantive empirical claims rest on the primary dataset alone. A run over the complete click file, with a category field that varies, is required before cross-dataset generalization is claimed.
Four directions follow. First, the benchmark extends naturally from next-category to next-item prediction. Second, exit propensity merits treatment as a separate task, ideally with timing or dwell-time signals that do not disclose the final click, and using the binary-head or discrete-time-hazard formulations set out in Section 4.4. Third, if public text or image data become available for the same catalogue, hybrid models could add semantic information to the tabular representation. Fourth, comparing tree ensembles, first-order Markov models and lightweight neural sequence learners on an identical audited hold-out would establish when additional model complexity is warranted. Replication on further clickstream sources remains the highest-value extension, since the rolling checks reported here establish temporal stability within one benchmark rather than transferability across retail domains.
This study specifies a prefix-only protocol for session-based clickstream benchmarking, formalizes it as an auditable algorithm, and applies it to next-category and exit prediction on public e-commerce data. The evaluation covers a majority baseline, a first-order transition model, tree ensembles, and two gradient-boosted learners, and reports class-balanced, ranking-aware, and threshold-free metrics under a strict temporal split. Every figure derives from a single documented pipeline under one declared seed, with stability verified across six seeds.
The audit is the principal contribution. Admitting variables that are defined only once a session has ended recovers the termination class perfectly, a result unattainable from information available before the next click, while moving the aggregate scores by a margin that a genuinely better model might plausibly produce. That asymmetry is what makes the audit useful in practice: it tells reviewers and practitioners which figure to distrust first, and the admissibility condition stated in Algorithm 1 gives them a means of preventing the problem, whether applied to a benchmark or embedded as a validation rule in a production feature pipeline.
The empirical findings are secondary to the protocol and are correspondingly modest. Boosted tabular learners improve class-balanced and ranking quality over bagged trees by a margin that is small in absolute terms, statistically reliable, and stable across seeds and across rolling temporal splits. The prefix-safe session block also contributes, but by roughly one tenth as much, and its contribution is concentrated in variables recording repetition rather than progression or transition. The transition baseline achieves the highest raw accuracy while ranking last among the non-trivial models on class-balanced measures, which illustrates why the choice of headline metric requires justification in tasks with skewed class distributions.
One methodological observation deserves emphasis beyond this dataset. Accuracy and macro-F1 responded to different interventions here, and the paired tests appropriate to each disagreed accordingly: the configuration with the largest macro-F1 gain was statistically indistinguishable from the baseline in accuracy, while the configuration with the clearest accuracy advantage barely moved macro-F1. Session termination likewise remains the hardest element of the task under honest features, and the manuscript reports it as such rather than concealing it behind an aggregate score. A pipeline-validation run on a second public source confirms that the audit executes unchanged on a different schema, though a full run with a non-degenerate category field is still required before cross-dataset claims are made. Taken together, the protocol, the audit, and the stated limits form a reusable basis for clickstream benchmarking in which the reported figures correspond to what a deployed system could actually know at the moment of prediction.
The primary dataset is publicly available from the UCI Machine Learning Repository [23] and the secondary dataset from the RecSys Challenge 2015 archive [18]; neither requires registration or a data-use agreement. The replication script that generates every table in this study, together with the exact package versions used and the JSON record of all reported figures, is archived at the location given below. Running it reproduces Tables 2, 3 and 6–14 from the raw CSV file in a single pass on ordinary hardware, without GPU acceleration. The random seed (42), the ordinal codebook, and the temporal split boundary are fixed in the script rather than passed at the command line, so a run performed by a third party is bit-for-bit comparable with ours. The three columns rejected by step 9 of Algorithm 1 are constructed by the script but used only to produce the diagnostic run of Table 8; a runtime assertion prevents them from entering any other model.
Repository. The replication code, the recorded output of every run, and the exact package versions used are available at https://github.com/moh1984/clickstream-leakage-audit.
[1] Necula, S.C., Păvăloaia, V.D. (2023). AI-driven recommendations: A systematic review of the state of the art in e-commerce. Applied Sciences, 13(9): 5531. https://doi.org/10.3390/app13095531
[2] Stalidis, G., Karaveli, I., Diamantaras, K., et al. (2023). Recommendation systems for e-shopping: Review of techniques for retail and sustainable marketing. Sustainability, 15(23): 16151. https://doi.org/10.3390/su152316151
[3] Wen, Z., Lin, W., Liu, H. (2023). Machine-learning-based approach for anonymous online customer purchase intentions using clickstream data. Systems, 11(5): 255. https://doi.org/10.3390/systems11050255
[4] Koren, Y., Bell, R., Volinsky, C. (2009). Matrix factorization techniques for recommender systems. Computer, 42(8): 30-37. https://doi.org/10.1109/mc.2009.263
[5] Hidasi, B., Karatzoglou, A., Baltrunas, L., Tikk, D. (2015). Session-based recommendations with recurrent neural networks. arXiv preprint arXiv:1511.06939. https://doi.org/10.48550/ARXIV.1511.06939
[6] Covington, P., Adams, J., Sargin, E. (2016). Deep neural networks for YouTube recommendations. In Proceedings of the 10th ACM Conference on Recommender Systems, Boston, Massachusetts, USA, pp. 191-198. https://doi.org/10.1145/2959100.2959190
[7] Cheng, H.T., Koc, L., Harmsen, J., et al. (2016). Wide & deep learning for recommender systems. In Proceedings of the 1st Workshop on Deep Learning for Recommender Systems, Boston, Massachusetts, USA, pp. 7-10. https://doi.org/10.1145/2988450.2988454
[8] Vaswani, A., Shazeer, N., Parmar, N., et al. (2017). Attention is all you need. In Advances in Neural Information Processing Systems, Long Beach, CA, USA, pp. 5998-6008.
[9] Kang, W.C., McAuley, J. (2018). Self-attentive sequential recommendation. In 2018 IEEE International Conference on Data Mining (ICDM), Singapore, pp. 197-206. https://doi.org/10.1109/icdm.2018.00035
[10] Wu, S., Tang, Y., Zhu, Y., Wang, L., Xie, X., Tan, T. (2019). Session-based recommendation with graph neural networks. In Proceedings of the AAAI Conference on Artificial Intelligence, Honolulu, Hawaii, USA, 33(1): 346-353. https://doi.org/10.1609/aaai.v33i01.3301346
[11] Sun, F., Liu, J., Wu, J., et al. (2019). BERT4Rec: Sequential recommendation with bidirectional encoder representations from transformer. In Proceedings of the 28th ACM International Conference on Information and Knowledge Management, Beijing, China, pp. 1441-1450. https://doi.org/10.1145/3357384.3357895
[12] Boka, T.F., Niu, Z., Neupane, R.B. (2024). A survey of sequential recommendation systems: Techniques, evaluation, and future directions. Information Systems, 125: 102427. https://doi.org/10.1016/j.is.2024.102427
[13] Sakalauskas, V., Kriksciuniene, D. (2024). Personalized advertising in e-commerce: Using clickstream data to target high-value customers. Algorithms, 17(1): 27. https://doi.org/10.3390/a17010027
[14] Alfaifi, Y.H. (2024). Recommender systems applications: Data sources, features, and challenges. Information, 15(10): 660. https://doi.org/10.3390/info15100660
[15] Kapoor, S., Narayanan, A. (2023). Leakage and the reproducibility crisis in machine-learning-based science. Patterns, 4(9): 100804. https://doi.org/10.1016/j.patter.2023.100804
[16] Ji, Y., Sun, A., Zhang, J., Li, C. (2023). A critical study on data leakage in recommender system offline evaluation. ACM Transactions on Information Systems, 41(3): 75. https://doi.org/10.1145/3569930
[17] Meng, Z., McCreadie, R., Macdonald, C., Ounis, I. (2020). Exploring data splitting strategies for the evaluation of recommendation models. In Proceedings of the Fourteenth ACM Conference on Recommender Systems, Virtual Event, Brazil, pp. 681-686. https://doi.org/10.1145/3383313.3418479
[18] Ben-Shimon, D., Tsikinovsky, A., Friedmann, M., Shapira, B., Rokach, L., Hoerle, J. (2015). RecSys challenge 2015 and the YOOCHOOSE dataset. In Proceedings of the 9th ACM Conference on Recommender Systems, Vienna, Austria, pp. 357-358. https://doi.org/10.1145/2792838.2798723
[19] Valencia-Arias, A., Uribe-Bedoya, H., González-Ruiz, J.D., Santos, G.S., Ramírez, E.C., Rojas, E.M. (2024). Artificial intelligence and recommender systems in e-commerce: Trends and research agenda. Intelligent Systems with Applications, 24: 200435. https://doi.org/10.1016/j.iswa.2024.200435
[20] Quinlan, J.R. (1986). Induction of decision trees. Machine Learning, 1(1): 81-106. https://doi.org/10.1023/a:1022643204877
[21] Breiman, L. (2001). Random forests. Machine Learning, 45(1): 5-32. https://doi.org/10.1023/a:1010933404324
[22] Pedregosa, F., Varoquaux, G., Gramfort, A., et al. (2011). Scikit-learn: Machine learning in Python. Journal of Machine Learning Research, 12: 2825-2830.
[23] Clickstream Data for Online Shopping. (2019). UCI Machine Learning Repository. https://doi.org/10.24432/C5QK7X
[24] Rendle, S., Freudenthaler, C., Schmidt-Thieme, L. (2010). Factorizing personalized Markov chains for next-basket recommendation. In Proceedings of the 19th International Conference on World Wide Web, pp. 811-820. https://doi.org/10.1145/1772690.1772773
[25] Li, J., Ren, P., Chen, Z., Ren, Z., Lian, T., Ma, J. (2017). Neural attentive session-based recommendation. In Proceedings of the 2017 ACM on Conference on Information and Knowledge Management, Raleigh, North Carolina, USA, pp. 1419-1428. https://doi.org/10.1145/3132847.3132926
[26] Hatt, T., Feuerriegel, S. (2020). Early detection of user exits from clickstream data: A Markov modulated marked point process model. In Proceedings of The Web Conference 2020, Taipei, Taiwan, pp. 1671-1681. https://doi.org/10.1145/3366423.3380238
[27] Sakar, C.O., Polat, S.O., Katircioglu, M., Kastro, Y. (2019). Real-time prediction of online shoppers’ purchasing intention using multilayer perceptron and LSTM recurrent neural networks. Neural Computing and Applications, 31(10): 6893-6908. https://doi.org/10.1007/s00521-018-3523-0
[28] Requena, B., Cassani, G., Tagliabue, J., Greco, C., Lacasa, L. (2020). Shopper intent prediction from clickstream e-commerce data with minimal browsing information. Scientific Reports, 10(1): 16983. https://doi.org/10.1038/s41598-020-73622-y
[29] Li, Y., Deng, X., Hu, X., Liu, J. (2024). The effects of e-commerce recommendation system transparency on consumer trust: Exploring parallel multiple mediators and a moderator. Journal of Theoretical and Applied Electronic Commerce Research, 19(4): 2630-2649. https://doi.org/10.3390/jtaer19040126
[30] Yin, J., Qiu, X., Wang, Y. (2025). The impact of AI-personalized recommendations on clicking intentions: Evidence from Chinese e-commerce. Journal of Theoretical and Applied Electronic Commerce Research, 20(1): 21. https://doi.org/10.3390/jtaer20010021
[31] Park, M., Oh, J. (2024). Enhancing e-commerce recommendation systems with multiple item purchase data: A bidirectional encoder representations from transformers-based approach. Applied Sciences, 14(16): 7255. https://doi.org/10.3390/app14167255
[32] Wei, P., Shu, H., Gan, J., et al. (2025). Sequential recommendation system based on deep learning: A survey. Electronics, 14(11): 2134. https://doi.org/10.3390/electronics14112134