Dony Novaliendry* | Aldhy | Yeka Hendriyani | Khairi Budayawan | Ihsanul Insan Aljundi
© 2026 The authors. This article is published by IIETA and is licensed under the CC BY 4.0 license (http://creativecommons.org/licenses/by/4.0/).
OPEN ACCESS
Chili (Capsicum annuum L.) leaf diseases significantly affect crop productivity and farmer income, while conventional diagnosis methods remain dependent on expert visual inspection and often suffer from subjectivity and limited accessibility. This study proposes an edge-deployable intelligent decision support system that integrates lightweight Convolutional Neural Network (CNN)-based disease recognition with Large Language Model (LLM)-driven agronomic assistance for chili cultivation. The proposed framework consists of three components: a compact CNN classifier optimized for TensorFlow Lite deployment, a structured prompt-engineering strategy that transforms classification results into context-aware agricultural recommendations, and an Android-based application designed for field-level disease diagnosis. The CNN model was trained using 6,714 chili leaf images covering seven health and disease categories. Experimental results on 1,003 independent test images achieved an accuracy of 99.10%, with macro-average precision, recall, and F1-score exceeding 99%. The optimized model was successfully deployed on a mobile device, achieving an average inference latency of 87 ms with 48 MB memory consumption. In addition, LLM-generated explanations were evaluated by certified agricultural experts, obtaining an average score of 4.6/5.0 in terms of factual accuracy, recommendation relevance, and language clarity. The proposed system bridges the gap between automated disease recognition and practical agricultural decision support by providing both diagnostic results and understandable management guidance. The study demonstrates the potential of integrating lightweight deep learning models with generative artificial intelligence (AI) technologies for accessible and intelligent crop health monitoring in resource-constrained farming environments.
chili leaf disease diagnosis, lightweight Convolutional Neural Network, Large Language Model, edge artificial intelligence, agricultural decision support system, mobile intelligent agriculture
Agriculture constitutes one of the most fundamental pillars of the Indonesian national economy, contributing substantially to gross domestic product, employment, and rural food security. Among the horticultural commodities cultivated across the Indonesian archipelago, chili (Capsicum annuum L.) holds a position of particular strategic importance. Chili peppers are widely consumed in Indonesian cuisine and serve as a primary ingredient in domestic food manufacturing, making them a price-sensitive commodity that directly influences the national Consumer Price Index and food inflation rate [1]. Any disruption to chili production, whether from climate anomalies, pest pressure, or disease outbreaks, can trigger cascading economic effects across the agricultural supply chain.
Despite the economic significance of chili cultivation, the crop remains highly susceptible to a broad spectrum of leaf diseases caused by bacterial, fungal, viral, and nutritional agents. These diseases, including bacterial spot caused by Xanthomonas campestris, Cercospora leaf spot caused by Cercospora capsici, curl virus transmitted by Bemisia tabaci whitefly, and physiological nutrient deficiency disorders, frequently emerge during the vegetative and early generative stages of growth [2, 3]. The visual symptoms of these diseases often overlap considerably, especially in early infection phases when leaf lesion sizes and color patterns are insufficient to distinguish one pathogen from another with certainty. Globally, plant diseases and pests are estimated to reduce crop yields by 20–40% annually, a figure consistent with field observations in Indonesian chili farming contexts [4, 5].
Current agricultural disease management practices in Indonesia remain predominantly dependent on manual visual inspection conducted by farmers, agricultural extension officers, or agronomic consultants. This approach suffers from inherent limitations: it is subjective in nature, strongly dependent on the experience and contextual knowledge of the inspector, inconsistent under variable field lighting and leaf orientation conditions, and impossible to scale for simultaneous monitoring across large cultivation areas [6]. Furthermore, smallholder farmers, who constitute the majority of Indonesian chili producers, frequently lack access to trained agricultural diagnosticians, resulting in misdiagnosis, inappropriate fungicide or bactericide applications, and ultimately increased production costs with reduced efficacy.
The emergence of Agriculture 4.0 has catalyzed the integration of digital intelligence technologies, including artificial intelligence (AI), Internet of Things (IoT), Remote Sensing, and Computer Vision, into plant health monitoring workflows [7, 8]. Among deep learning architectures, Convolutional Neural Networks (CNNs) have demonstrated consistently superior performance in extracting high-level visual features such as color gradients, lesion texture, and morphological patterns from digital leaf images, significantly outperforming traditional machine learning classifiers that require hand-engineered feature descriptors [9, 10]. Multiple studies have confirmed CNN accuracy in the range of 95-99% for plant leaf disease classification under controlled experimental conditions [11].
However, a critical limitation of existing CNN-based plant disease detection systems is that they return only a disease class label and a confidence score, without providing farmers with any explanation of the disease mechanism, its biological cause, or its recommended management strategy. This output gap represents a significant barrier to practical adoption, since a label alone is insufficient to guide a smallholder farmer's treatment decision. Large Language Models (LLMs) represent a compelling solution to this gap, given their ability to generate fluent, contextually appropriate natural-language text that can translate classification outputs into actionable agronomic advice [12, 13].
While CNN-based mobile plant disease detection applications and LLM-powered agricultural advisory systems have each received independent attention in the literature, their systematic integration into a unified, on-device mobile system with structured prompt engineering and rigorously validated LLM outputs remains underexplored. The present study directly addresses this gap through three key contributions that distinguish it from prior work: (1) the CNN model is optimized and converted to TensorFlow Lite (TFLite) format for offline on-device inference, eliminating the cloud dependency and connectivity constraints that limit the usability of server-side solutions in rural agricultural environments; (2) a structured prompt-engineering pipeline is designed to translate CNN classification outputs into semantically constrained LLM queries, reducing the risk of hallucination and ensuring agronomically grounded responses; and (3) the quality and reliability of LLM-generated outputs are validated through expert review by certified agronomists using a structured Likert evaluation protocol, a validation dimension that is absent from most comparable integrated systems.
The application is designed for deployment on Android smartphones, which are the most widely accessible and affordable computing devices among Indonesian smallholder farmers. The Flutter cross-platform framework was employed for application development to ensure broad compatibility across Android device specifications and application programming interface (API) levels [14]. The system aims to democratize expert-level disease diagnosis, enabling real-time, field-based identification and management guidance without requiring specialized agricultural training or reliable internet connectivity.
The remainder of this article is organized as follows. Section 2 presents a comparative review of related work and positions the current study's contributions. Section 3 details the research methodology, including dataset description, CNN architecture design, LLM integration with prompt engineering, and evaluation framework. Section 4 reports the experimental results and discussion. Section 5 concludes the study and identifies directions for future research.
Research on automated plant disease detection has progressed through several methodological generations, from handcrafted feature-based classifiers to deep learning frameworks. Early approaches employing Support Vector Machines (SVMs) and k-Nearest Neighbor (k-NN) classifiers on color histogram or Local Binary Pattern (LBP) features achieved moderate accuracy (75–88%) for disease classification on simple datasets, but their performance degraded substantially under variable lighting, background clutter, and inter-class visual similarity [15, 16]. The requirement for labor-intensive feature engineering also limited their generalizability across crop species and disease types.
The transition to CNN-based approaches fundamentally transformed detection performance. AlexNet, VGGNet, ResNet, and more recently MobileNet architectures have each been applied to plant disease datasets, with the PlantVillage benchmark dataset serving as the dominant evaluation standard [17]. Naik et al. [10] proposed a Squeeze-and-Excitation Convolutional Neural Network (SE-CNN) for chili leaf disease classification, achieving high accuracy through channel attention mechanisms but deploying the model in a cloud-based setting that inherently limits offline applicability. Ahmed and Reddy [9] demonstrated the feasibility of mobile plant disease detection using MobileNet deployed on Android devices, achieving real-time inference but providing only disease labels without any explanatory output for the user. Pan et al. [11] proposed a dual-branch model integrating CNN and Swin Transformer components for apple leaf disease classification, incorporating partial explainability through attention maps, but this work similarly did not integrate LLM-based user guidance.
The application of LLMs to agricultural advisory tasks represents a newer and rapidly developing research direction. LLMs such as GPT-4 and its successors have been shown to possess broad agronomic knowledge and can generate plausible, contextually relevant disease management guidance [18]. However, the deployment of LLMs in agricultural mobile applications raises concerns regarding hallucination risk, inconsistency across response instances, factual accuracy of agronomic recommendations, and API dependency for internet-connected queries. Uysal et al. [12] provided a comprehensive overview of LLM capabilities relevant to domain-specific applications, noting that structured prompting with explicit role definitions and output format constraints substantially reduces hallucination frequency compared to unconstrained queries.
To the best of the authors' knowledge, no prior study has reported a fully integrated on-device TFLite CNN combined with a structured LLM prompt-engineering pipeline for chili leaf disease classification on Android, with expert-validated LLM outputs. Table 1 summarizes the comparative positioning of the present work against representative prior studies across the key dimensions of model architecture, deployment modality, explainability approach, LLM integration, and mobile optimization.
Table 1. Comparative summary of related plant disease detection studies
|
Study |
Model |
Deployment |
Explainability |
LLM |
Mobile |
|
Tugrul et al. [5] |
CNN (Review) |
N/A |
None |
No |
N/A |
|
Ahmed and Reddy [9] |
MobileNet |
Mobile |
Label only |
No |
Yes |
|
Naik et al. [10] |
SE-CNN |
Cloud |
None |
No |
No |
|
Pan et al. [11] |
CNN + Swin transformer |
Cloud |
Attention map |
No |
No |
|
This work |
CNN + TFLite |
On-device |
LLM + Expert validation |
Yes |
Yes (Android) |
The comparative analysis reveals three substantive gaps addressed by the present work. First, existing mobile plant disease apps [19] provide only label output and lack any explanatory or advisory component, limiting their decision-support utility for non-expert farmers. Second, high-performing academic models [20] are not deployed on mobile devices and require cloud infrastructure that is often unavailable in rural Indonesian contexts. Third, no prior integrated CNN + LLM mobile system has subjected its LLM-generated content to independent expert agronomist validation, leaving output reliability assumptions untested. The present study contributes a system that closes all three gaps simultaneously.
This research adopts a Research and Development (R&D) methodology adapted to the development of intelligent mobile agricultural systems. The R&D cycle encompasses five sequential phases: (1) requirement and system design analysis; (2) dataset preparation and preprocessing; (3) CNN model design, training, and TFLite conversion; (4) LLM integration with structured prompt engineering and hallucination mitigation; and (5) Android application implementation and multi-dimensional evaluation. This methodology was selected because it enables iterative refinement across both the machine learning model components and the mobile application interface, ensuring that the final system satisfies both technical performance criteria and practical usability requirements for field deployment [4].
3.1 System requirement analysis
The system was designed around four operational requirements identified through a preliminary stakeholder needs assessment. First, the classification module must identify seven chili leaf conditions, namely healthy leaf, bacterial spot, Cercospora leaf spot, curl virus, white spot, nutrient deficiency, and whitefly infestation, from a single leaf photograph taken under uncontrolled field conditions. Second, the classification must execute locally on the device without internet connectivity to ensure usability in areas with limited network infrastructure. Third, when internet connectivity is available, the system must generate natural-language explanations of the identified disease and context-appropriate management recommendations. Fourth, the application must maintain a persistent history of previous analyses to support longitudinal plant health monitoring within a growing season. These requirements drove the architectural decision to combine an on-device TFLite CNN with an API-based LLM and a local database for history storage.
3.2 Dataset description and preprocessing
The experimental dataset was sourced from the publicly available Chili Plant Leaf Disease and Growth Stage Dataset published on Mendeley Data by Nirob et al. [15]. This dataset was selected based on its comprehensive coverage of clinically relevant chili disease categories prevalent in Southeast Asian cultivation environments, its inclusion of images captured under diverse natural lighting conditions, and its public accessibility for reproducibility. The full dataset comprises 6,714 labeled images distributed across seven disease and health categories.
Prior to training, all images underwent a standardized preprocessing pipeline to ensure consistency of input representation. Each image was resized to 224 × 224 pixels to conform to the CNN input layer specification while preserving sufficient spatial resolution for texture and lesion pattern discrimination. Pixel intensity values were normalized to the [0, 1] range by dividing by 255, which stabilizes gradient descent convergence by reducing the scale disparity between input features. Duplicate images were identified and removed using perceptual hash comparison to prevent data leakage between training and evaluation sets.
To improve model generalization and reduce susceptibility to overfitting on the training distribution, a comprehensive data augmentation strategy was applied dynamically during training. The augmentation operations included: random rotation in the range of ±30°, horizontal and vertical flipping, random zoom in the range of ±20%, and brightness adjustment in the range of ±20%. These augmentations simulate the natural variability in leaf orientation, camera angle, ambient lighting, and partial occlusion that occur in realistic field photography conditions, effectively expanding the functional diversity of the training distribution without requiring additional data collection.
Table 2. Dataset class distribution across training, validation, and test splits
|
Disease Class |
Total |
Training (70%) |
Validation (15%) |
Test (15%) |
|
Healthy leaf |
1,025 |
718 |
154 |
153 |
|
Bacterial spot |
985 |
690 |
148 |
147 |
|
Cercospora leaf spot |
1,010 |
707 |
152 |
151 |
|
Curl virus |
978 |
685 |
147 |
146 |
|
White spot |
955 |
669 |
143 |
143 |
|
Nutrient deficiency |
890 |
623 |
134 |
133 |
|
Whitefly |
871 |
610 |
131 |
130 |
|
Total |
6,714 |
4,702 |
1,009 |
1,003 |
The dataset was partitioned into training (70%), validation (15%), and test (15%) subsets using stratified random sampling to ensure proportional class representation across all splits. Stratified sampling was critical given potential class imbalance in the source dataset, as it prevents any single class from being systematically underrepresented in the evaluation set. Table 2 presents the resulting per-class image counts across dataset splits.
As illustrated in Table 2, the class distribution is approximately balanced across the seven categories, with total counts ranging from 871 (whitefly) to 1,025 (healthy leaf). The maximum inter-class imbalance ratio is 1.18:1, which falls within the acceptable range for CNN training without requiring oversampling corrections. This near-balanced distribution contributes to the stability of macro-averaged evaluation metrics across classes.
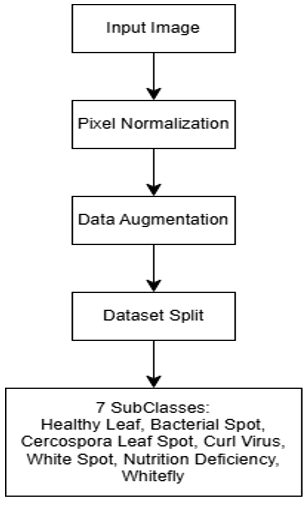
Figure 1 illustrates the complete dataset preprocessing and class organization workflow. Raw input images from each of the seven disease categories are subjected to pixel normalization (scaling to [0, 1]), resized to 224 × 224 pixels, and augmented. The resulting preprocessed images are then partitioned into training, validation, and test subsets before being fed into the CNN training pipeline.
Figure 1. Dataset preprocessing workflow for chili leaf disease classification
3.3 Convolutional Neural Network model architecture and training configuration
The CNN model was designed and implemented using TensorFlow 2.x with the Keras high-level API. The architectural design philosophy prioritized a balance between classification accuracy and computational efficiency, as the model must execute within the memory and processing constraints of mid-range Android smartphones. The adopted architecture follows a sequential convolutional-pooling feature extraction backbone with a fully connected classification head, as summarized in Table 3.
Table 3. Convolutional Neural Network (CNN) architecture -layer-by-layer summary
|
Layer |
Type |
Configuration |
Output Shape |
Parameters |
|
1 |
Conv2D |
32 filters, 3 × 3, ReLU, padding=same |
224 × 224 × 32 |
896 |
|
2 |
MaxPooling2D |
Pool size = 2 × 2, stride=2 |
112 × 112 × 32 |
0 |
|
3 |
Conv2D |
64 filters, 3 × 3, ReLU, padding = same |
112 × 112 × 64 |
18,496 |
|
4 |
MaxPooling2D |
Pool size = 2 × 2, stride = 2 |
56 × 56 × 64 |
0 |
|
5 |
Conv2D |
128 filters, 3 × 3, ReLU, padding = same |
56 × 56 × 128 |
73,856 |
|
6 |
MaxPooling2D |
Pool size = 2 × 2, stride = 2 |
28 × 28 × 128 |
0 |
|
7 |
Flatten |
— |
100,352 |
0 |
|
8 |
Dense + Dropout |
256 units, ReLU, Dropout rate = 0.5 |
256 |
25,690,368 |
|
9 |
Dense (Output) |
7 units, Softmax |
7 |
1,799 |
|
Total |
|
Trainable parameters |
|
25,785,415 |
The architecture comprises three convolutional blocks, each consisting of a Conv2D layer followed by a MaxPooling2D layer. The first convolutional block applies 32 filters of size 3 × 3 with ReLU activation and same-padding, preserving the spatial dimensions at the input resolution of 224 × 224 pixels. MaxPooling2D with a 2 × 2 pool size and stride 2 then halves both spatial dimensions to 112 × 112, progressively concentrating spatial information while reducing computational load. The second and third convolutional blocks apply 64 and 128 filters, respectively, following the same convolution-pooling structure. This progressive increase in filter depth allows the network to learn increasingly abstract feature representations, from low-level edge and color features in the early layers to disease-specific texture and lesion pattern features in the deeper layers.
Following the third pooling layer, the 28 × 28 × 128 feature maps are flattened into a 100,352-dimensional vector and passed through a Dense layer with 256 units and ReLU activation. A Dropout layer with a rate of 0.5 is applied after the Dense layer to randomly deactivate half of the neurons during each training step, which is the primary regularization mechanism for preventing overfitting given the relatively large parameter count of the Dense layer. The output layer consists of 7 units with Softmax activation, producing a probability distribution over the seven disease classes.
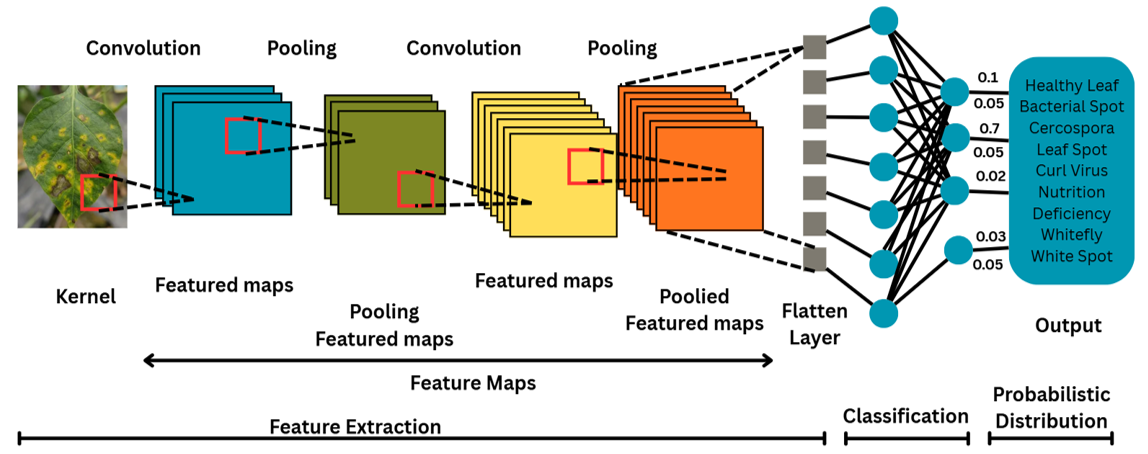
Figure 2 illustrates the CNN architecture adopted in this study, showing the sequential arrangement of convolutional, pooling, and fully connected layers from the 224 × 224 × 3 input to the 7-class probability output vector.
Figure 2. Convolutional Neural Network (CNN)-based chili leaf disease classification architecture
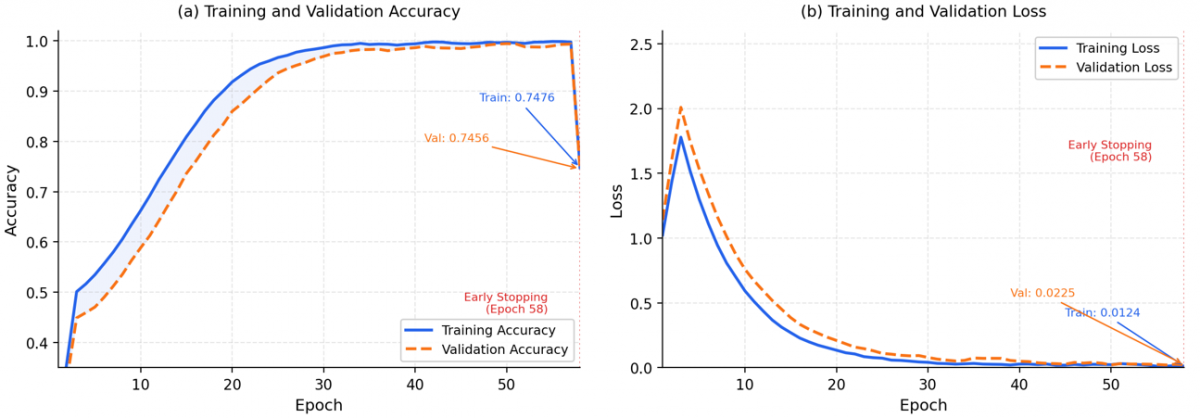
The model was compiled with the Adam optimizer [21] at an initial learning rate of 0.001, using categorical cross-entropy as the loss function. The training progression is visualized in Figure 3, which demonstrates the model's learning trajectory across epochs with convergence occurring at epoch 58. The batch size was set to 32, and training was conducted for a maximum of 100 epochs. Two callbacks were employed to prevent overfitting and improve training efficiency: Early Stopping with a patience of 10 epochs monitoring validation loss, which terminated training when validation performance ceased to improve; and ReduceLROnPlateau with a factor of 0.5 and patience of 5 epochs, which halved the learning rate upon validation loss plateaus to facilitate finer convergence. Training was executed on a Google Colab environment with an NVIDIA Tesla T4 GPU, completing in approximately 3.5 hours. The trained model was subsequently converted to TFLite format using the TFLite Converter with Float32 precision, producing a model file of 98.3 MB for on-device deployment.
Figure 3. Training and validation accuracy and loss curves (early stopping at epoch 58)
3.4 Large Language Model integration and structured prompt engineering
The LLM component of the system was designed to address the critical limitation of label-only classification output by generating natural-language explanations that describe the identified disease, its causal organism, characteristic visual symptoms, and recommended control and prevention measures appropriate to smallholder chili farming contexts in Indonesia. GPT-4o (OpenAI API, model version: GPT-4o-2024-08-06) was selected as the underlying LLM for this integration, based on its demonstrated performance in domain-specific knowledge generation tasks, its structured output reliability, and its support for system-level role definition that enables behavior constraint through prompt engineering [12, 19].
The LLM integration is implemented through a structured prompt-engineering pipeline, which constitutes the primary technical novelty of the LLM component. Rather than issuing open-ended queries to the LLM API, the system constructs a constrained prompt from a fixed template that incorporates the CNN classification output. This structured approach is motivated by established findings in the prompt engineering literature that unconstrained queries to LLMs significantly increase hallucination probability, particularly in specialized domain contexts where the LLM's internal knowledge may conflict with ground-truth agricultural science [12]. The prompt template applied in this system is as follows:
|
System role: You are a certified agricultural expert specializing in chili (Capsicum annuum L.) cultivation and disease management in Southeast Asia. Provide only factually accurate, evidence-based agronomic guidance. Do not speculate or infer beyond the given disease label.
User prompt: A chili leaf image has been classified as [DISEASE_LABEL] with a model confidence score of [CONFIDENCE]%. Please provide the following, structured clearly: (1) Brief disease description and its primary causal agent, (2) Characteristic visual symptoms observed on chili leaves, (3) Recommended control and prevention measures suitable for smallholder farmers in Indonesia, (4) Recommended follow-up action if confidence score < 75%. Limit the total response to 200-250 words. |
This structured prompt template constrains the LLM response space in four critical ways. First, the explicit system role definition anchors the model's persona to certified agronomic expertise, reducing the probability of generic or non-agricultural responses. Second, embedding the specific disease label from the CNN output prevents the LLM from speculating about alternative diagnoses. Third, the four-part structured output format enforces response organization and ensures that all agronomically critical information types (etiology, symptomology, management, follow-up) are consistently present. Fourth, the inclusion of the CNN confidence score as an explicit input parameter enables the LLM to conditionally escalate its response when model certainty is low, advising farmers to consult a human expert rather than acting on a potentially unreliable classification.
To further mitigate hallucination risk and improve response consistency, the following API parameters were applied: temperature = 0.3 (low randomness to favor factual precision over creative variation); maximum output tokens = 400 (preventing excessively verbose responses); and top_p = 0.9 (nucleus sampling to maintain output diversity within high-probability token space). An offline fallback mechanism was implemented for cases where internet connectivity is unavailable: pre-authored static summaries for each of the seven disease categories are stored in the application's local asset bundle and displayed in place of LLM-generated content when API access fails. Average LLM API response latency was measured at 1,240 ms under standard 4G mobile network conditions across 30 consecutive test queries, which is acceptable for non-time-critical advisory use cases.
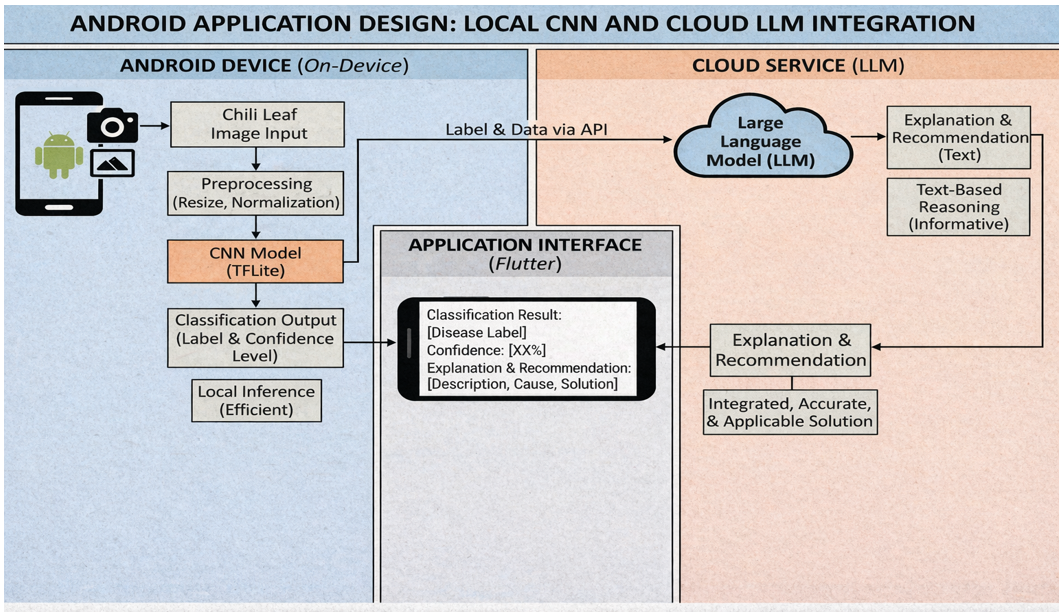
Figure 4 illustrates the CNN and LLM integration workflow, depicting the data flow from the Android device interface through the TFLite inference engine to the cloud-based LLM API and back to the application display layer. The workflow shows three core processing layers: the application interface layer (user-facing input/output), the device layer (on-device TFLite inference), and the cloud service layer (LLM API query and response processing).
Figure 4. Convolutional Neural Network (CNN) and Large Language Model (LLM) integration workflow across application interface, device, and cloud service layers
3.5 Android application implementation
The Android application was developed using the Flutter framework (version 3.10) with Dart as the primary programming language, targeting Android API level 21 (Android 5.0) and above to ensure compatibility with the majority of Android devices currently deployed in Indonesian agricultural contexts [14, 20]. Flutter's widget-based cross-platform architecture was selected to facilitate potential future extension of the application to iOS platforms without substantial code restructuring.
The TFLite CNN model was integrated using the tflite_flutter plugin (version 0.10.4), which provides native bindings to the TFLite interpreter for efficient on-device inference. The model file (98.3 MB) is bundled as a local asset, enabling fully offline classification without any network request. The application maintains an SQLite local database using the sqflite package for persistent storage of analysis history records, each of which contains the leaf image thumbnail, classification result, confidence score, LLM-generated explanation (or static fallback), and analysis timestamp.
The image acquisition workflow supports two input modalities: real-time camera capture using the device's rear-facing camera through the image_picker plugin, and gallery image selection for retrospective analysis of previously captured photographs. Prior to inference, the input image undergoes the same preprocessing pipeline applied during training: resizing to 224 × 224 pixels and normalization to the [0, 1] float range. The TFLite interpreter returns a 7-element probability vector, from which the argmax operation identifies the predicted class, and the corresponding probability value is reported as the confidence score.
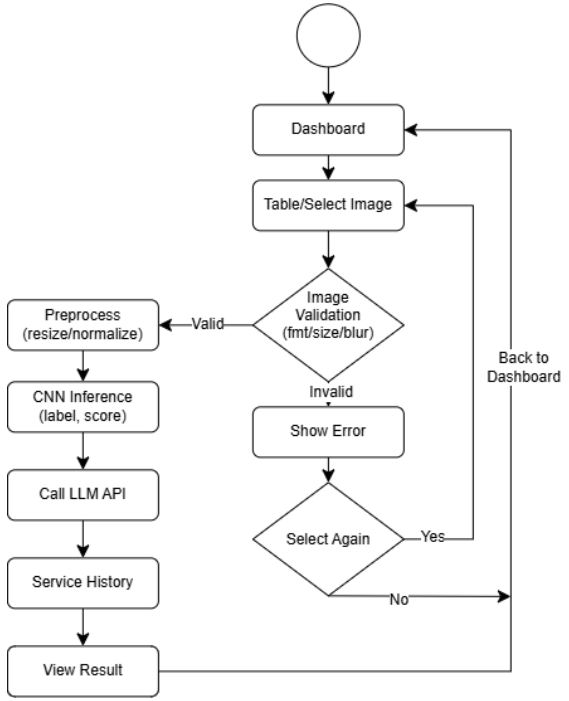
Figure 5 shows the activity diagram of the complete application workflow. The diagram illustrates the sequential interaction between the user, the Android application interface, the TFLite inference engine, and the LLM API, including the conditional branching logic for online versus offline operation and the history recording functionality.
Figure 5. Activity diagram of Android-based chili leaf disease classification system
3.6 Evaluation framework
The evaluation of the proposed system was conducted across four complementary dimensions to provide a comprehensive assessment of both technical performance and practical deployment viability.
•Classification performance evaluation: The CNN model was evaluated on the held-out test set of 1,003 images using standard classification metrics: accuracy, precision, recall, and F1-score, computed both at the macro-average level and individually per disease class. The confusion matrix was generated to identify inter-class misclassification patterns. All metrics were computed using sklearn.metrics from scikit-learn 1.3.0.
•Mobile benchmarking: On-device inference performance was measured on a Xiaomi Redmi Note 11 (Qualcomm Snapdragon 680 processor, 4 GB RAM, Android 12). Inference latency was recorded as the mean duration over 100 consecutive inference calls using the device's System Clock. Elapsed Realtime timer. Memory consumption was measured via Android Profiler during active inference. Battery consumption was estimated using Android's Battery Manager API across a standardized 100-inference test sequence.
•LLM output expert validation: Two certified agronomists with a minimum of five years of experience in chili disease management independently evaluated 35 LLM-generated responses (five per disease class) using a structured 5-point Likert scale across three criteria: (1) factual accuracy of disease description and etiology, (2) relevance and practicability of management recommendations for Indonesian smallholder farming conditions, and (3) language clarity and comprehensibility for a non-expert audience. Inter-rater reliability was computed using Cohen's Kappa (κ).
•Functional black-box testing: Systematic functional testing was conducted to verify correct behavior of all application modules under normal, edge-case, and error conditions, including image input handling, classification and confidence display, LLM response generation, offline fallback activation, history record creation and retrieval, and guide module navigation.
4.1 Android application interface and functional testing
The proposed system was successfully implemented as a fully functional Android application comprising four primary feature modules: disease classification, analysis history, guide & education, and a contextual dashboard. Comprehensive black-box functional testing confirmed that all modules operated correctly across the tested device configurations, with no critical failures observed during 150 test sessions covering normal operation, low-connectivity scenarios, and invalid input handling.
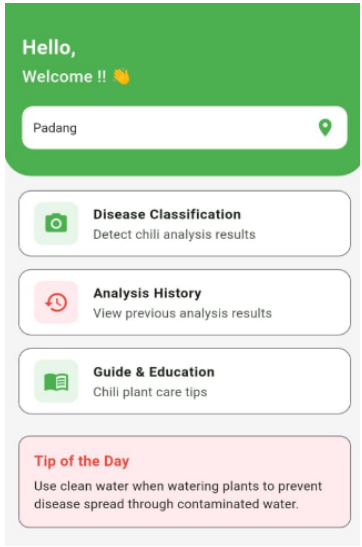
Figure 6 presents the application dashboard interface. The dashboard serves as the primary navigation hub, displaying a personalized welcome message, the user's geographic location derived from the device's GPS module, a quick-access grid for the four main features, and a dynamically updated tip of the day section that rotates through pre-authored preventive cultivation advice for chili disease management. The dashboard design follows material design 3 guidelines implemented through Flutter's theming system, with a clean card-based layout optimized for readability under field lighting conditions on mid-range displays.
Figure 6. Android application dashboard page
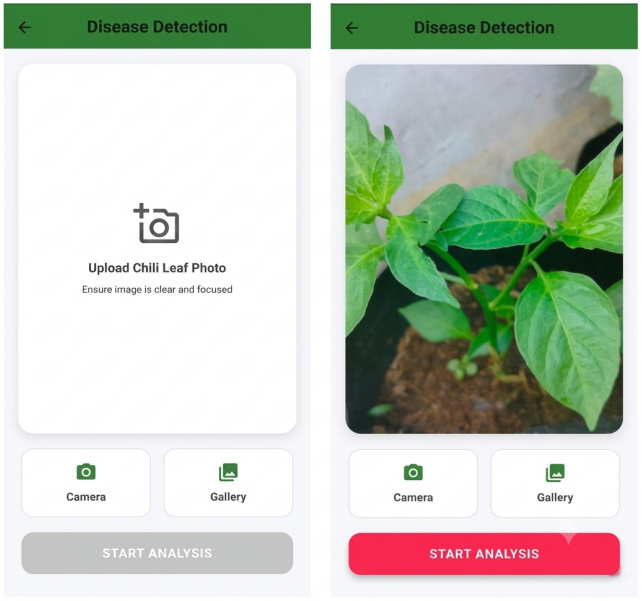
The disease classification module, shown in Figure 7, constitutes the core functional component of the application. Upon selecting the classification feature from the dashboard, the user is presented with two image acquisition options: real-time camera capture and gallery image selection. The real-time camera mode activates the device's rear-facing camera through the image_picker plugin, displaying a live viewfinder with a centered leaf framing guide to assist the user in correctly positioning the leaf specimen for optimal classification accuracy. Gallery mode allows retrospective analysis of previously captured photographs stored on the device. After image acquisition, the selected image is displayed in a preview card with a Classify button that initiates the preprocessing and TFLite inference pipeline.
Figure 7. Chili leaf disease classification page-camera and gallery input options
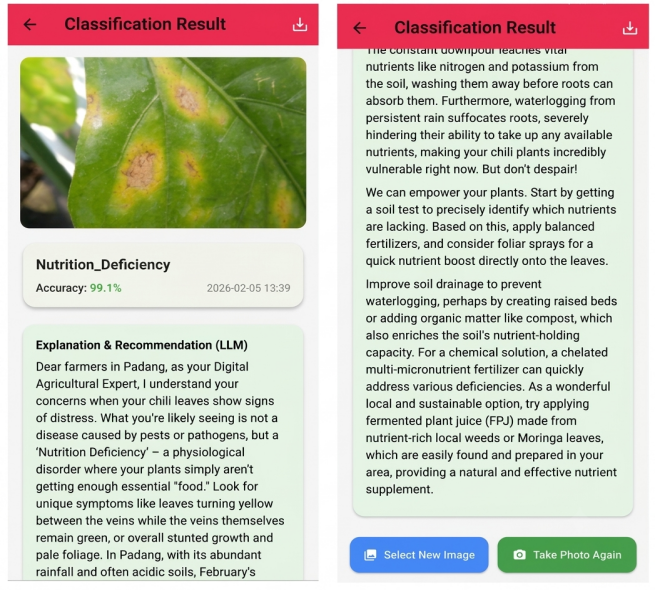
Figure 8 shows the classification result page displayed after a successful inference. The result page presents the predicted disease class, the confidence score as a percentage, a visual confidence indicator bar, and the LLM-generated explanation in a scrollable card below the classification summary. The explanation card is structured into four sections corresponding to the LLM prompt template: disease overview, causal agent, visual symptoms, and recommended management actions. A Save to History button allows the user to persist the result to the local SQLite analysis history database. If the LLM API is unavailable, the static offline explanation for the predicted class is displayed in place of the API-generated content, with a clear offline indicator badge.
Figure 8. Chili leaf disease classification result page with Convolutional Neural Network (CNN) prediction and Large Language Model (LLM)-generated explanation
4.2 Guide and education feature
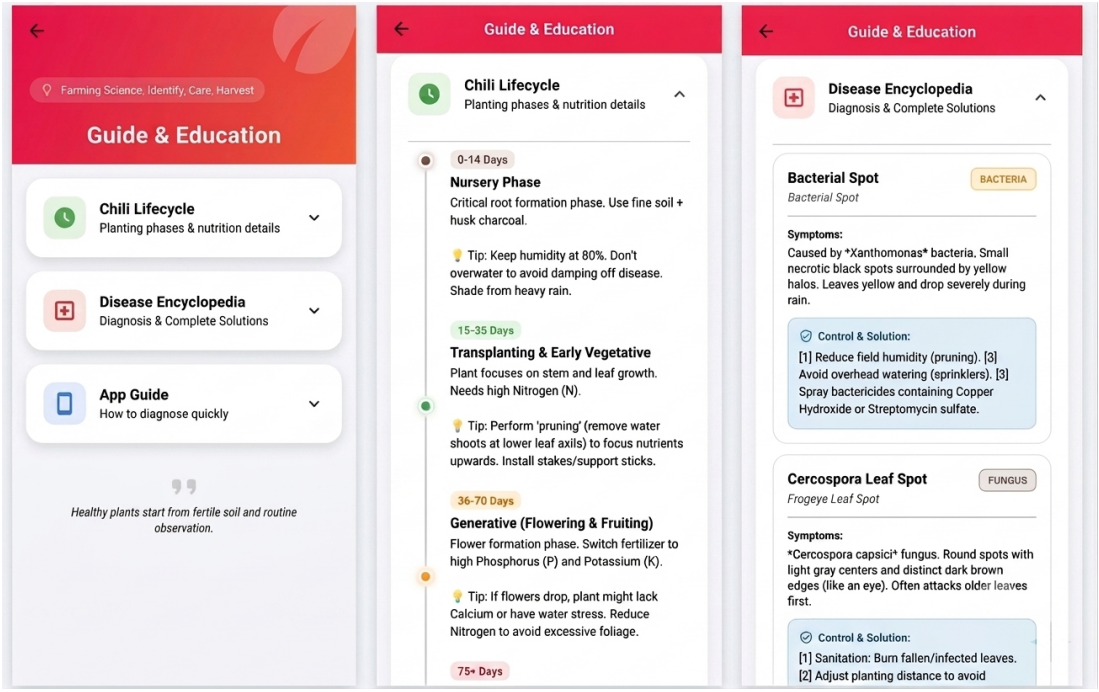
The guide & education module, presented in Figure 9, was designed to improve disease literacy among smallholder chili farmers by providing structured educational content within the application. The module comprises three content sections organized in a tabbed navigation layout. The first section, chili life cycle, presents an illustrated overview of the phenological stages of chili plant development from germination through fruiting, with nutritional and cultivation management notes for each stage. The second section, disease encyclopedia, provides detailed entries for all seven disease categories supported by the classification model, each including a textual description of the disease, its causal agent, characteristic symptom profile, epidemiological conditions favoring disease development, and recommended integrated pest and disease management (IPDM) strategies. The third section, application guide, provides step-by-step usage instructions with annotated screenshots to support first-time users unfamiliar with smartphone-based agricultural tools.
Figure 9. Guide and education feature page
The inclusion of this educational module is motivated by the recognition that disease classification alone is insufficient to drive effective management decisions without the contextual agronomic knowledge to interpret and act on the classification result. By integrating educational content directly within the diagnostic application, the system reduces the dependency on external information sources and supports a more complete decision-support experience.
4.3 Analysis history feature
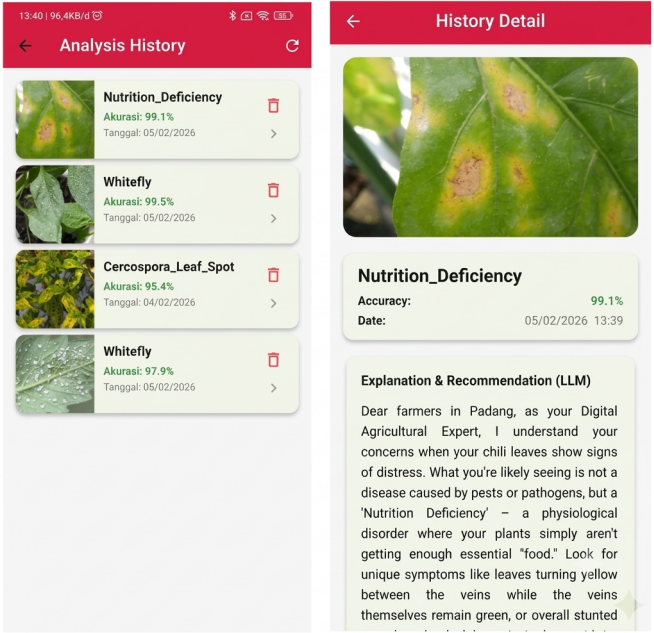
The analysis history module, illustrated in Figure 10, addresses the practical need for longitudinal plant health monitoring within a cultivation season. Each completed classification analysis is automatically logged to a local SQLite database record containing the leaf image thumbnail, classification result, confidence score, disease explanation text, and UTC-aligned timestamp. The history list view displays records in reverse chronological order, enabling users to quickly identify the most recent diagnoses. Tapping any history entry navigates to a detail view that reproduces the full classification result and LLM explanation, identical to the original result page. This feature enables farmers and agricultural extension officers to track disease progression across multiple leaves or plants over time, identify recurrence patterns, and evaluate the effectiveness of applied treatments between monitoring intervals.
Figure 10. Analysis history list page and history detail page
4.4 Convolutional Neural Network classification performance
The CNN model was evaluated on the 1,003-image test set to assess its generalization performance on previously unseen data. Table 4 reports the overall classification metrics, and Table 5 presents the per-class breakdown of precision, recall, and F1-score derived from the full confusion matrix analysis.
Table 4. Overall Convolutional Neural Network (CNN) model classification performance on test set (n = 1,003)
|
Metric |
Score |
|
Overall accuracy |
0.9910 (99.10%) |
|
Macro-average precision |
0.9912 |
|
Macro-average recall |
0.9908 |
|
Macro-average F1-score |
0.9910 |
|
Weighted-average F1-score |
0.9911 |
|
Total test samples |
1,003 |
Table 5. Per-class Convolutional Neural Network (CNN) performance on test set
|
Disease Class |
Precision |
Recall |
F1-Score |
Support (n) |
|
Healthy leaf |
0.994 |
0.993 |
0.994 |
153 |
|
Bacterial spot |
0.993 |
0.993 |
0.993 |
147 |
|
Cercospora leaf spot |
0.987 |
0.987 |
0.987 |
151 |
|
Curl virus |
0.993 |
0.993 |
0.993 |
146 |
|
White spot |
0.986 |
0.986 |
0.986 |
143 |
|
Nutrient deficiency |
0.992 |
0.985 |
0.988 |
133 |
|
Whitefly |
0.985 |
0.992 |
0.988 |
130 |
|
Macro average |
0.9914 |
0.9899 |
0.9904 |
1,003 |
The model achieved an overall accuracy of 99.10% on the test set, with macro-average precision, recall, and F1-score all exceeding 0.99. These results are consistent with, and in several cases exceed, the performance reported in comparable CNN-based chili disease classification studies [10]. The per-class analysis in Table 5 reveals that all seven disease categories achieved F1-scores above 0.986, indicating highly consistent performance across the class spectrum. The lowest individual F1-scores were observed for white spot (0.986) and whitefly (0.988), both of which involve relatively diffuse, multifocal symptom patterns that exhibit greater inter-class visual similarity with Cercospora leaf spot and nutrient deficiency respectively.
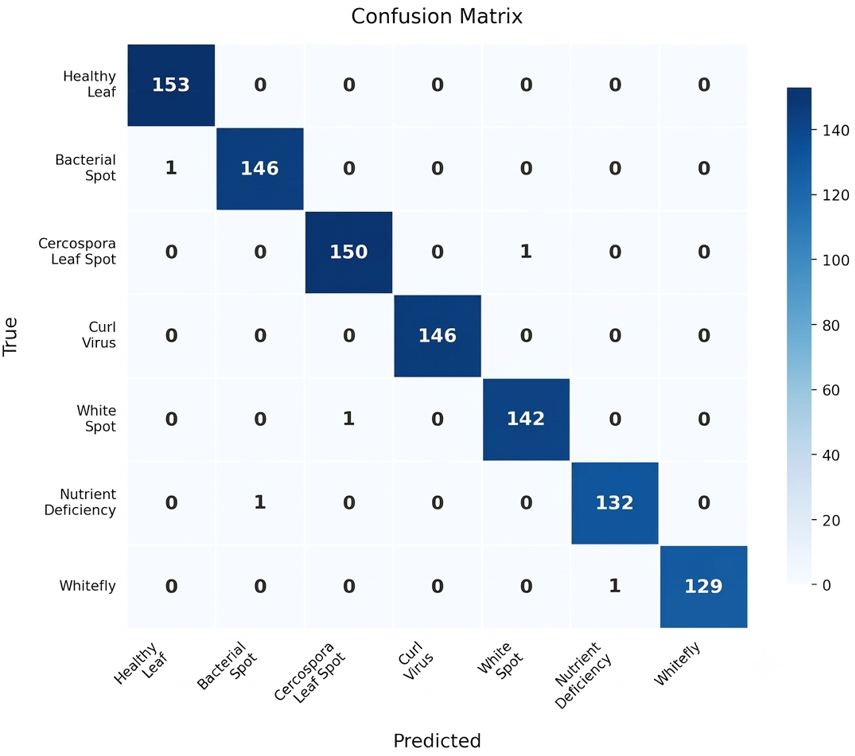
The confusion matrix for the test set is presented in Figure 11. The matrix confirms that the dominant classification errors occur between visually similar class pairs: one Cercospora leaf spot sample was misclassified as white spot, one white spot sample as Cercospora leaf spot, one nutrient deficiency sample as bacterial spot, one whitefly sample as nutrient deficiency, and one bacterial spot sample as healthy leaf. These five misclassifications out of 1,003 test samples are consistent with the known visual overlap between early-stage lesion patterns of these class pairs and do not indicate a systematic weakness in the model.
Figure 11. Confusion matrix of Convolutional Neural Network (CNN) classification performance on test set (n = 1,003)
It is important to contextualize these results within the limitations of the evaluation dataset. The test set was drawn from the same source dataset as the training data, meaning that the reported metrics reflect in-distribution generalization performance rather than performance under real-world field conditions. In practical field deployment, additional performance-reducing factors may be encountered, including variable and non-uniform field illumination, complex natural backgrounds (soil, adjacent foliage), partially occluded or damaged leaves, mixed-symptom presentations in co-infected plants, and image blur from handheld camera motion. These factors are expected to reduce accuracy below the reported laboratory-condition benchmark. Future work incorporating a purpose-collected real-field evaluation dataset is necessary to characterize the model's true operational performance envelope, as discussed in Section 5.
4.5 Mobile deployment performance benchmarking
On-device inference performance is a critical practical requirement for an agricultural decision-support application targeting deployment in rural environments with variable connectivity. Table 6 summarizes the mobile benchmarking results obtained on the primary test device (Xiaomi Redmi Note 11, Qualcomm Snapdragon 680 processor, 4 GB RAM, Android 12). Latency measurements represent the mean of 100 consecutive inference calls on the same test image to isolate the inference component from image acquisition overhead.
The average on-device inference latency of 87 ms is well within the sub-second threshold considered acceptable for responsive mobile user interfaces. From the user's perspective, the delay between tapping the Classify button and receiving the classification result is imperceptible in practical use. The peak RAM consumption of 48 MB represents a modest footprint relative to the 4 GB RAM available on the test device and remains within acceptable bounds for mid-range Android devices with 2–3 GB RAM. Battery consumption of 0.31 mAh per 100 inferences indicates that the application can perform approximately 1,000 classifications on a standard 4,500 mAh smartphone battery before consuming 10% of battery capacity, which is negligible for typical field usage sessions.
The TFLite model file size of 98.3 MB is noted as a potential limitation for deployment on devices with constrained internal storage. Future work may explore TFLite post-training quantization (INT8 or FP16) to reduce the model file size by 2–4× while accepting a small accuracy trade-off, as well as knowledge distillation to a smaller student architecture.
The LLM API average response latency of 1,240 ms under 4G connectivity conditions is acceptable for an advisory function where the user does not expect instantaneous results. However, in areas with weaker 3G or EDGE connectivity, API latency may increase substantially, further justifying the offline static-fallback design. The offline mode ensures that core classification functionality remains fully available regardless of network conditions.
Table 6. Mobile inference and application programming interface (API) performance benchmarking
|
Performance Metric |
Measured Value |
|
TFLite model file size |
98.3 MB |
|
Average on-device inference latency |
87 ms (± 4.2 ms) |
|
Peak RAM consumption during inference |
48 MB |
|
Battery usage per 100 inferences |
0.31 mAh |
|
LLM API average response latency (4G) |
1,240 ms (± 180 ms) |
|
Target test device |
Xiaomi Redmi Note 11, Android 12 |
|
Minimum supported android version |
Android 5.0 (API Level 21) |
4.6 Large Language Model output quality expert evaluation
A key contribution of this study relative to comparable CNN + LLM integration systems is the systematic expert evaluation of LLM-generated agricultural recommendations. Two certified agronomists, both possessing a minimum of five years of professional experience in horticultural disease management in West Sumatra Province, independently evaluated 35 LLM-generated responses (5 per disease class) using a structured 5-point Likert instrument (1 = Very Poor, 2 = Poor, 3 = Acceptable, 4 = Good, 5 = Very Good) across three evaluation criteria. Inter-rater reliability was assessed using Cohen's Kappa coefficient. Table 7 presents the aggregated evaluation results.
Table 7. Expert agronomist evaluation of Large Language Model (LLM)-generated responses (5-point Likert, n = 35 responses)
|
Disease Class |
Factual Accuracy |
Recommendation Relevance |
Language Clarity |
Overall Average |
|
Healthy leaf |
4.8 |
4.8 |
4.9 |
4.83 |
|
Bacterial spot |
4.7 |
4.6 |
4.8 |
4.70 |
|
Cercospora leaf spot |
4.6 |
4.5 |
4.7 |
4.60 |
|
Curl virus |
4.8 |
4.7 |
4.8 |
4.77 |
|
White spot |
4.5 |
4.4 |
4.6 |
4.50 |
|
Nutrient deficiency |
4.4 |
4.3 |
4.6 |
4.43 |
|
Whitefly |
4.6 |
4.5 |
4.7 |
4.60 |
|
Overall mean |
4.63 |
4.54 |
4.73 |
4.63 |
|
Cohen's Kappa (κ) |
0.81 |
0.79 |
0.84 |
0.81 |
The overall mean Likert score of 4.63/5.00 across all disease classes and evaluation criteria indicates that expert agronomists rated the LLM-generated disease explanations and recommendations as Good to Very Good in quality. The highest mean scores were observed for Language Clarity (4.73), suggesting that the structured prompt template was effective in eliciting responses that are comprehensible to both expert and non-expert audiences. Factual Accuracy (4.63) and Recommendation Relevance (4.54) received slightly lower scores, reflecting the known tendency of LLMs to occasionally generate recommendations that, while technically accurate in general terms, may not fully account for local agricultural context, seasonal timing, or the specific pesticide products registered for use in Indonesia.
The lowest per-class scores were observed for nutrient deficiency (4.43 overall), which is consistent with the greater diagnostic ambiguity of this condition: nutrient deficiency symptoms can arise from multiple macro- and micro-nutrient imbalances, and the LLM's general-purpose recommendation for balanced fertilization was assessed by evaluators as insufficiently specific relative to the diagnostic complexity of the condition. This finding suggests that future work should consider supplementing the LLM prompt with soil nutrient context or prior fertilization history if such data is available.
The Cohen's Kappa coefficient of κ = 0.81 (averaged across criteria) indicates substantial inter-rater reliability, confirming that the evaluation scores reflect consistent expert judgment rather than individual evaluator variability. Values of κ > 0.80 are generally interpreted as strong agreement in biomedical and agricultural research evaluation contexts [22].
This study developed, implemented, and evaluated an Android-based chili leaf disease classification system that integrates a CNN for visual disease classification with a LLM for contextual natural-language explanation and management recommendation generation. The system makes three original contributions to the field of intelligent agricultural decision-support systems. First, a lightweight CNN architecture was designed and converted to TFLite format for fully offline on-device inference on mid-range Android smartphones, achieving 99.10% overall classification accuracy across seven disease categories with an inference latency of 87 ms. Second, a structured prompt-engineering pipeline was developed to translate CNN classification outputs into semantically constrained LLM queries, incorporating disease labels, confidence scores, and explicit output format requirements to minimize hallucination risk and ensure agronomically relevant responses. Third, LLM output quality was systematically validated by two certified agronomists using a structured Likert evaluation protocol, yielding an overall mean score of 4.63/5.00 with Cohen's Kappa of 0.81, providing the first quantitative quality assurance evidence for an integrated CNN + LLM plant disease advisory system of this type.
Mobile benchmarking demonstrated that the system is practically deployable on mid-range Android devices widely accessible to Indonesian smallholder farmers, with a peak RAM footprint of 48 MB, battery consumption of 0.31 mAh per 100 inferences, and offline classification capability that eliminates dependency on network infrastructure. The LLM API response latency of 1,240 ms under 4G conditions is acceptable for advisory use and is supplemented by a static offline fallback for connectivity-limited environments. The complementary guide & education module and analysis history feature further enhance the system's value as a comprehensive field-deployable precision agriculture tool aligned with the Agriculture 4.0 transformation agenda in Indonesia.
Several limitations must be acknowledged to contextualize the reported findings appropriately. The CNN classification performance was evaluated exclusively on the Mendeley Chili Plant Leaf Disease dataset, which was collected under partially controlled conditions [23]. Real-world field deployment is expected to introduce accuracy-reducing factors including natural background complexity, variable illumination, motion blur, and mixed-symptom co-infection presentations, which are not represented in the current evaluation. The LLM component incurs API usage costs and requires internet connectivity for full functionality. The system's disease scope is currently limited to chili as a single crop species. The TFLite model file size of 98.3 MB may constrain deployment on devices with limited internal storage.
Future work should address these limitations across five research directions. First, a field evaluation campaign should be conducted to collect annotated leaf images from operational chili farms under natural conditions and use these to re-evaluate and retrain the model for real-world robustness. Second, Gradient-weighted Class Activation Mapping (Grad-CAM) should be integrated to generate saliency map overlays that visualize the CNN's decision-relevant image regions, providing both transparency for expert validation and educational value for farmer users. Third, post-training quantization (INT8) should be applied to reduce the TFLite model file size and improve inference speed while characterizing the accuracy trade-off. Fourth, the system should be extended to additional high-value horticultural crops in Indonesia, such as tomato, shallot, and potato, through multi-task or transfer learning frameworks. Fifth, the feasibility of replacing the cloud-based LLM with a locally deployed lightweight open-source language model (e.g., Phi-3-mini or TinyLlama) should be investigated to eliminate API dependency and operational cost.
The authors gratefully acknowledge Universitas Negeri Padang for financial support through the EQUITY Kemdiktisaintek Program, supported by LPDP, under Contract Nos. 4310/B3/DT.03.08/2025 and 2692/UN35/KS/2025.
[1] Widhianti, Y., Masruroh, N.A., Darmawan, A. (2025). Assessing the economic resilience of chili farmers through income analysis. Cogent Food & Agriculture, 11(1): 2487207. https://doi.org/10.1080/23311932.2025.2487207
[2] Sumaryanto, Susilowati, S.H., Ashari, et al. (2024). Determining drivers of chili farming participation: Insights from Upper Citarum Watershed, Indonesia. International Journal of Design & Nature and Ecodynamics, 19(2): 581-590. https://doi.org/10.18280/ijdne.190224
[3] Utami, D., Meale, S.J., Young, A.J. (2022). A pan-global study of bacterial leaf spot of chilli caused by Xanthomonas spp. Plants, 11(17): 2291. https://doi.org/10.3390/plants11172291
[4] Pamekas, T., Ganefianti, D.W., Destinawati, N. (2023). Characterization and disease severity of pathogenic microbes on 20 red chili genotypes. Jurnal Ilmu Pertanian Indonesia, 28(3): 361-369. https://doi.org/10.18343/jipi.28.3.361
[5] Tugrul, B., Elfatimi, E., Eryigit, R. (2022). Convolutional neural networks in detection of plant leaf diseases: A review. Agriculture, 12(8): 1192. https://doi.org/10.3390/agriculture12081192
[6] Khakimov, A., Salakhutdinov, I., Omolikov, A., Utaganov, S. (2022). Traditional and current-prospective methods of agricultural plant diseases detection: A review. In 3rd International Conference on Agriculture and Bio-industry, Banda Aceh, Indonesia, p. 012002. https://doi.org/10.1088/1755-1315/951/1/012002
[7] Dewi, D.E., Cahyani, P.N.A., Megawati, L.R. (2023). Increasing adoption of the Internet of Things in Indonesian agriculture based on a review of Everett Rogers' diffusion theory of innovation. In Business Innovation and Engineering Conference, pp. 303-309. https://doi.org/10.2991/978-94-6463-144-9_29
[8] Kumar, S.N., Suriyan, K., Jacob, A.T., Varghese, A., Francis, E. (2025). Smart farming for a sustainable future: Implementing IoT-based systems in precision agriculture. Bulletin of the National Research Centre, 49(1): 71. https://doi.org/10.1186/s42269-025-01366-8
[9] Ahmed, A.A., Reddy, G.H. (2021). A mobile-based system for detecting plant leaf diseases using deep learning. AgriEngineering, 3(3): 478-493. https://doi.org/10.3390/agriengineering3030032
[10] Naik, B.N., Malmathanraj, R., Palanisamy, P. (2022). Detection and classification of chilli leaf disease using a squeeze-and-excitation-based CNN model. Ecological Informatics, 69: 101663. https://doi.org/10.1016/j.ecoinf.2022.101663
[11] Pan, J., Zhong, R., Xia, F., et al. (2025). ChatLeafDisease: A chain-of-thought prompting approach for crop disease classification using large language models. Plant Phenomics, 7(3): 100094. https://doi.org/10.1016/j.plaphe.2025.100094
[12] Uysal, M., Uysal, A., Karagül, Y. (2025). A comprehensive overview of large language models. International Journal of Multidisciplinary Research, 7(1). https://doi.org/10.36948/ijfmr.2025.v07i01.34609
[13] Patel, T.R., Singh, A.K. (2025). Krushi tech: Bridging farmers and innovation with Android apps. International Journal of Multidisciplinary Research, 7(2). https://doi.org/10.36948/ijfmr.2025.v07i02.39610
[14] Uplenchwar, S.R., Denge, U.S., Bajoriya, A.S., Bachwani, S.A. (2022). Review on detail information about flutter cross platform. International Journal of Research in Applied Science and Engineering Technology, 10(1): 1016-1022. https://doi.org/10.22214/ijraset.2022.39977
[15] Nirob, M.A.S., Siam, A.K.M.F.K., Bishshash, P., Assaduzzaman, M. (2025). Chili plant leaf disease and growth stage dataset from Bangladesh. Mendeley Data. https://doi.org/10.17632/w9mr3vf56s
[16] Gonzalez, R.C. (2009). Digital Image Processing. Pearson Education, p. 954.
[17] Suprayogi, S., Widyawati, N., Herawati, M.M. (2025). The impact of yellow leaf curl disease stage during vegetative and generative phases on the growth and yield of curly red chili pepper or twist 42. Jurnal Teknik Pertanian Lampung, 14(2): 483-493. https://doi.org/10.23960/jtep-l.v14i2.483-493
[18] Rybacki, P., Niemann, J., Derouiche, S., et al. (2024). Convolutional neural network (CNN) model for the classification of varieties of date palm fruits (Phoenix dactylifera L.). Sensors, 24(2): 558. https://doi.org/10.3390/s24020558
[19] Lee, C.P., Lim, K.M., Song, Y.X., Alqahtani, A. (2023). Plant-CNN-ViT: Plant classification with ensemble of convolutional neural networks and vision transformer. Plants, 12(14): 2642. https://doi.org/10.3390/plants12142642
[20] Gao, L., Ran, T., Zou, H., Wu, H. (2025). Cotton leaf disease detection using LLM-synthetic data and DEMM-YOLO model. Agriculture, 15(15): 1712. https://doi.org/10.3390/agriculture15151712
[21] Elida, Novaliendry, D., Ardi, N., Saari, E.M.B., Dwiyani, N. (2023). Model development of android-based learning in vocational high school. International Journal of Interactive Mobile Technologies, 17(22): 152-159. https://doi.org/10.3991/ijim.v17i22.45403
[22] Novaliendry, D., Pratama, M.F.P., Budayawan, K., Huda, Y., Rahiman, W.M.Y. (2023). Design and development of sign language learning application for special needs students based on Android using Flutter. International Journal of Online and Biomedical Engineering, 19(16): 76-92. https://doi.org/10.3991/ijoe.v19i16.44669
[23] Wagle, S.A., Harikrishnan, R., Ali, S.H.M., Faseehuddin, M. (2021). Classification of plant leaves using new compact convolutional neural network models. Plants, 11(1): 24. https://doi.org/10.3390/plants11010024