Ruqaia J. Kadhim | Hasanain J. Alsaedi | Adel S. Hussain | Mohammad A. Tashtoush* | Rana A. Almuttalibi
© 2026 The authors. This article is published by IIETA and is licensed under the CC BY 4.0 license (http://creativecommons.org/licenses/by/4.0/).
OPEN ACCESS
Non-pulmonary tuberculosis (NPTB) remains challenging to manage due to heterogeneous clinical manifestations and the difficulty of predicting patient deterioration from longitudinal clinical observations. Early identification of high-risk patients is particularly important in resource-limited settings, where timely intervention can improve clinical decision-making. This study proposes an explainable hybrid framework that integrates a state-space model (SSM) with a Transformer-based architecture for predicting clinical deterioration in NPTB patients. A real-world time-series dataset consisting of 125 patient records was used for model development and evaluation. The preprocessing pipeline included temporal feature extraction, class balancing using the Synthetic Minority Over-Sampling Technique (SMOTE), and sequence-based representation learning. The proposed hybrid model was compared with conventional machine learning methods, including Logistic Regression, Random Forest, and Long Short-Term Memory (LSTM) networks. Experimental results demonstrated that the proposed framework achieved superior predictive performance, with an area under the receiver operating characteristic curve (ROC) of 0.93, F1-score of 0.86, recall of 0.85, and Brier score of 0.14. Statistical analysis using DeLong and McNemar tests confirmed significant improvements over baseline models. Furthermore, SHapley Additive exPlanations (SHAP) analysis and Transformer attention visualization provided insights into the temporal features contributing to risk prediction. Although external validation using larger multicenter cohorts is required, the proposed framework provides a potential approach for interpretable artificial intelligence (AI)-assisted risk stratification in NPTB management.
non-pulmonary tuberculosis, clinical deterioration prediction, artificial intelligence, Transformer model, state-space model, explainable artificial intelligence, healthcare risk stratification
The most infectious disease that stays as a persistent one is tuberculosis (TB). It had around 10.6 million fresh cases and about 1.3 million deaths in 2022, according to the World Health Organization reports in 2023. Pulmonary TB, on the other hand, mostly dominates, while non-pulmonary or the so called extra-pulmonary tuberculosis (non-pulmonary tuberculosis ((NPTB)/extra-pulmonary tuberculosis (EPTB)) affects lymph nodes, bones, pleura, and also the central nervous system. Together, these account for roughly 15-28% of the total cases worldwide, particularly in immune-compromised people, and also more commonly among the elderly population [1].
Despite medical advances, NPTB/EPTB keeps being hard to diagnose and manage. In practice, the clinical signs are often non-specific, the diagnosis gets delayed, and in many cases invasive procedures or more advanced imaging are required. There are comorbidities too, like HIV infection, diabetes, malnutrition, and multi-drug resistant TB (MDR-TB), and these are common, they raise the chance of poor outcomes, and they make treatment feel more complicated.
Getting an early and accurate prediction of the patient status is critical for timely action, especially in resource limited settings. Traditional statistical models, for example Logistic Regression, can still offer some predictive value, but they run into trouble with non-linearity, missing records, and the complicated longitudinal shape of patient trajectories. Over the last decade, artificial intelligence (AI) and machine learning have become popular, including deep learning plus hybrid models, used as tools toward predictions that are more robust and hopefully more interpretable.
Here, we introduce a hybrid state-space transformer model, aimed at forecasting NPTB patient status. The approach brings together evidence from the global tuberculosis literature, and it’s validated using a big, real-world, multi-country dataset.
2.1 Tuberculosis, extrapulmonary disease, and predictive challenges
TB remains a global health burden, with EPTB presenting unique diagnostic and prognostic challenges [2]. EPTB’s clinical diversity, complex host–pathogen dynamics, and increased prevalence in populations with comorbidities such as HIV have led to calls for more nuanced, data-driven approaches for prognosis and management [3-5].
Conventional statistical methods, such as Logistic Regression and Cox proportional hazards models—have provided valuable insights into risk factors and treatment outcomes in both pulmonary and extrapulmonary TB [6]. However, these methods are often limited by their assumptions of linearity and inability to fully capture high-dimensional, temporal, and multimodal health data [7-9].
2.2 Machine learning and artificial intelligence in tuberculosis prediction
2.2.1 Early machine learning efforts and statistical-machine learning comparisons
The first machine learning applications in the research of TB have put the emphasis on classification while also factoring in risk identification. This was done through the use of Random Forest, which helped sort and distinguish the relevant patterns with a kind of probabilistic way, so to speak, machines of support vector (SVM), let alone Logistic Regression [5, 6, 10-14] which are all considered tradition algorithms. Depending on the studied conducted, it has been shown that classical statistical models could be outperformed via the machine learning models, which could be done at the prediction of treating the outcomes, particularly in the availability of large, real-world datasets, i.e. [6, 8, 10, 12, 15].
Using the multi-country data to predict the failure of treatment, Asad et al. [10] have implemented machine learning-based framework. They have discovered that the models that offered superior accuracy as opposed to regression were the XGBoost ones. Fayaz et al. [15] also came out with almost the same outcomes. They found that the baseline classifiers for predicting treatment success in Pakistan are less effective than XGBoost, even compared to Random Forests. This kind of behavior is noticed as well when the data is imbalanced, and it is being tackled in that setup.
These trends have also been confirmed by systemic reviews. Peetluk et al. [8] have highlighted superiority concerning the machine learning approaches over the methods especially the traditional ones at clinical datasets when they are heterogeneous and high-dimensional.
2.2.2 Imaging, biomarkers, and multi-modal fusion
To mash together data that are clinical lab, and also imaging, hybrid machine learning models have been used. This is mostly done to boost detection accuracy and to predict outcomes for TB [2, 14, 16-19]. For the early detection of TB from the imagines of X-ray, Fati et al. [16], for instance, have employed deep learning accompanied by the fusion feature to perform this. Chukwunweike et al. [17], on the other hand, have integrated AI, Convolutional Neural Network (CNN) accompanied by MATrix LABoratory (MATLAB). They have done this on purpose of modeling prediction, and the demonstration of performance that is improved.
Biochemical markers have been introduced into the frameworks of machine learning by Wang et al. [18]. They have enhanced the accuracy of prediction for the outcomes of TB treatment. Studies that used ensemble have also echoed the multi-model fusion paradigm. This has been performed with the hybrid models [19, 20].
2.3 Temporal and sequence modeling in tuberculosis
2.3.1 Deep learning for longitudinal and electronic health record data
Advances in deep learning, particularly with Long Short-Term Memory (LSTM) and transformer architectures, have significantly enhanced the ability to model complex temporal dependencies in clinical data [21-28]. Zhang and Li [22] introduced the Chrono Former model for structured event modeling, showing that attention-based architectures outperform classical time series approaches for TB and other chronic diseases.
The significance of sequence data has been highlighted by studies such as Hosu et al. [5] and Chen et al. [13] which demonstrated that LSTM and deep neural networks could model the outcomes of TB better among HIV-infected and drug-resistant patients.
In recent years, the use of transformers and explainable AI (XAI) methods has proven to be highly effective at forecasting disease trajectories and hospital outcomes, even in the complex and imbalanced context of TB. Recent studies by Yasin et al. [26] and Renc et al. [29] have successfully demonstrated the capabilities of transformers and XAI techniques for predicting health trajectories and hospital outcomes, even in the complex and imbalanced realm of TB.
2.3.2 Hybrid and interpretable models
New hybrid modeling frameworks are now appearing that merge the classical statistical modeling tools (e.g., Kalman filters, state space models) with the power of the transformers and deep learning [22-24, 30-34]. Nguyen et al. [23] offered clinically-inspired multi-agent transformers for disease trajectory forecasting, and Siebra et al. [30] offered a systematic review of the transformer-based models to emphasize their advantages in longitudinal clinical data.
Finally, hybrid models help to overcome some major shortcomings of deep learning in clinical practice: interpretability and robustness [1, 20, 31, 32]. The rest of the literature further highlights the promise of representation learning with transformer architectures towards unified, multimodal clinical diagnostics by Zhou et al. [28] and Yang et al. [27].
2.4 Socioeconomic, geographical, and global perspectives
The impact of socioeconomic, environmental and geographical factors on TB progression and management has also been addressed in many studies [1, 9, 33, 35-38]. Tandirogang et al. [37] examined spatial interaction between EPTB and PTB in Indonesia and Rahman and Shiddik [1] detected the global determinants of TB risk using XAI. These insights underscore the vital role of region-specific AI models designed to predict TB while taking into account the local context.
The continuous development and potential of AI in TB, ranging from diagnosis and drug development to a surveillance system and public health decision support, are highlighted in the work of Mohamed et al. [35] and Memon et al. [36].
2.5 Summary of key advances
In sum, recent research (see Table 1) indicates that:
These advances have set the stage for the current work, which integrates state-space model (SSM) with transformers to address the unique challenges of predicting non-pulmonary TB patient status in real-world clinical data.
Table 1. Comparison of 44 key studies in non-pulmonary or the extra-pulmonary tuberculosis (NPTB/EPTB) outcome prediction and predictive modeling
|
Ref. |
Country/Region |
Study Type/Approach |
Dataset/Size |
Methods/Algorithms |
Strengths |
Limitations |
Key Findings |
|
1 |
Denmark |
Modeling/Simulation |
- |
Virtual host modeling |
Immune event predictions |
Simulated data |
Early immune events predict TB outcomes |
|
2 |
Global |
Review |
- |
Review (Transformers/LLMs) |
Broad healthcare focus |
No empirical dataset |
LLMs/transformers potential in healthcare |
|
3 |
China |
Diagnostic accuracy |
143 specimens |
mNGS, clinical diagnosis |
Focus on smear-negative EPTB |
Sample size |
mNGS rapid, accurate for EPTB |
|
4 |
6 Countries |
ML prediction framework |
10,024 records |
XGBoost, RF, LR |
Multi-country dataset |
Heterogeneity |
ML predicts TB failure across regions |
|
5 |
Finland |
National cohort |
1,100+ cases |
Cohort, Logistic Regression |
Nationwide, long-term follow-up |
Historical dataset |
EPTB outcomes varied by site |
|
6 |
- |
ML prediction |
UK Biobank |
Transformer |
Zero-shot prediction |
Transferability |
Transformer can predict health trajectories |
|
7 |
Global (TB) |
ML fusion, outcome prediction |
6 datasets |
GNN, multiplexed graphs |
Multi-modal, flexible |
Modalities may be missing |
GNN fusion improves prediction |
|
8 |
India |
ML adherence prediction |
25,000+ |
GBDT, LGBM, RF |
Real-world large cohort |
Missing adherence data |
Temporal ML models improve adherence pred. |
|
9 |
Israel/Global |
Prognostic modeling |
CKD registry |
Transformer, time-to-event |
Robustness to missing data |
CKD-specific |
Transformer outperforms Cox, RNN |
|
10 |
India |
ML TB outcome |
34,000+ |
RF, SVM, LR, NB |
Large, real registry |
Karnataka-specific |
ML > baseline for TB outcomes |
|
11 |
China |
EHR sequence modeling |
7,158 |
ChronoFormer, Transformer |
Long-range temporal learning |
Limited modalities |
Time-aware Transformer best for clinical data |
|
12 |
- |
Hybrid sequence prediction (COVID-19) |
26,000+ |
CNN-LSTM hybrid |
Multi-modal (spike + clinical) |
Not TB-specific |
Hybrid deep model best for severity |
|
13 |
Saudi Arabia |
Hybrid TB detection (imaging) |
700+ images |
Deep + hybrid learning |
Fusion of features |
Imaging-only |
Hybrid/AI superior for early TB |
|
14 |
Review |
Review |
- |
AI/ML/Hybrid review |
TB diagnosis focus |
Not empirical |
AI enhances TB diagnosis |
|
15 |
Global |
Systematic review |
33 models |
Meta-analysis |
Broad, critical comparison |
Models heterogeneous |
ML models better than Logistic Regression |
|
16 |
Canada |
Clinical guideline/review |
- |
Narrative review |
Practice guidance |
Not original research |
Adherence, risk factors for TB outcomes |
|
17 |
Austria |
ML prediction HIV+TB |
1,456 |
ML, regression |
Prospective HIV+TB |
Specific pop., small N |
ML improves active TB detection in HIV |
|
18 |
Review |
Review transformers in EHR |
- |
Systematic review |
Summarizes SOTA |
Not empirical |
Transformers effective for EHR |
|
19 |
Pakistan/Review |
Review (AI/ML in TB) |
- |
Narrative, model survey |
Covers drug discovery |
Not original |
AI/ML roles throughout TB workflow |
|
20 |
Indonesia |
Spatial model of EPTB |
702 EPTB |
Spatial modeling, stats |
EPTB + PTB co-dynamics |
City-specific |
EPTB/PTB spatial/temporal links |
|
21 |
Nigeria |
Model development |
502 cases |
CNN, MATLAB, ensemble |
Integrates ML & image data |
Limited test set |
AI + CNN + clinical: enhanced prediction |
|
22 |
Africa/Asia |
Multicohort outcome study |
1,258 EPTB |
Regression, cohort analysis |
ART programs, multi-country |
Variable resources |
Diagnosis delay + ART impact EPTB |
|
23 |
China |
EHR sequence modeling (HIV/TB) |
1,206 |
LSTM, regression |
Structured EMR, retrospective |
HIV+ only, limited features |
LSTM improves TB prediction among HIV+ |
|
24 |
Multinational |
ML pediatric TB diagnosis |
3,000+ children |
ML, risk modeling |
Pediatric, diverse sites |
Bacteriologic confirmation |
ML aids infant/young child TB diagnosis |
|
25 |
Pakistan |
Prospective hospital study |
453 |
Regression, risk strat. |
Prospective, detailed EPTB |
Modest N |
Comorbidities predict slow/extended response |
|
26 |
Australia/Papua NG |
Drug-resistant TB outcomes |
312 |
Cohort, regression |
Drug-resistant TB focus |
Regional, limited N |
Delay, resistance worsen outcome |
|
27 |
Pakistan |
ML for treatment success |
1,358 |
RF, XGBoost |
Real TB data, multi-site |
Imbalanced classes |
ML models better for success prediction |
|
28 |
Korea |
Transformer LMs in health |
- |
Scoping review |
Summarizes health LMs |
Not original |
Transformers: emerging tool in health |
|
29 |
Europe/Global |
Multimodal transformer forecast |
UK Biobank |
Multi-agent transformer |
Multimodal, interpretable |
Early phase |
Clinically-inspired transformers improve forecast |
|
30 |
Denmark |
EPTB registry outcome study |
1,432 |
Regression, cohort analysis |
National registry |
No ML/AI |
EPTB site, age = predictors for outcome |
|
31 |
South Africa |
Supervised ML for TB/HIV |
350 |
ML algorithms |
Focus on HIV+ TB |
Small, single center |
ML improves TB/HIV outcome prediction |
|
32 |
Pakistan |
Retrospective, MDR-TB |
430 |
Regression, cohort |
MDR-TB focus |
Single region |
HIV, delay, malnutrition: poor outcomes |
|
33 |
China |
Biochem ML outcome prediction |
1,135 |
ML, lab marker analysis |
Biochemical, multi-variate |
Lab marker access |
ML predicts TB outcomes from labs |
|
34 |
Review (Global) |
Systematic review: transformers in health |
- |
Review, transformer models |
Longitudinal focus |
No empirical |
Transformers for EHR, sequence data |
|
35 |
China |
Forecasting hybrid model |
11,495 |
EMD + ML hybrid |
Large dataset, novel hybrid |
Model complexity |
Hybrid model improves TB forecasts |
|
36 |
China |
Cognitive impairment prediction |
2,003 |
Transformer models |
Multi-site, public health |
Cognitive, not TB |
Transformers accurate, interpretable |
|
37 |
China |
XAI for TB spondylitis LOS |
436 |
ML (XGBoost), XAI |
Unbalanced data addressed |
Limited to surgery |
XAI effective for LOS prediction |
|
38 |
Global |
Multi-modal transformer for TB |
TB datasets |
Transformer, multi-modal |
TB image/classification focus |
Requires image + clinic data |
Transformer aids TB diagnosis |
|
39 |
Global/Europe |
EHR sequence model (Transformer) |
Multiple |
Encoder-decoder, EHR |
EHR, disease outcome prediction |
General EHR |
Transformer-EHR for disease outcomes |
|
40 |
Global |
Transformer for clinical diagnostics |
Multi-modal |
Transformer representation |
Unified multimodal model |
Model size/complexity |
Outperforming single-modality approaches in clinical diagnosis |
|
41 |
Mozambique |
Clinical/US features in EPTB |
1,530 |
Survival analysis, stats |
Point-of-care features |
Resource constraints |
US/clinical features predict EPTB mortality |
|
42 |
Brazil |
Classical vs ML TB/HIV co-infection |
5,231 |
Classical, ML (XGBoost) |
Head-to-head model comparison |
Data quality |
ML outperforms traditional models |
|
43 |
India |
Registry outcome study |
2,163 |
Stats, survival |
Large, regional |
Registry data limitations |
Factors for EPTB and treatment success |
|
44 |
Global |
XAI for TB risk factors |
Global TB data |
AI/ML, SHAP, EDA |
Global coverage, explainability |
Data heterogeneity |
XAI reveals TB risk determinants |
3.1 Raw dataset description
The study is based on a real-world clinical dataset consisting of 125 records for NPTB patients. A record is a patient timepoint with the following data:
•Time of status: integer – order in time (day, week, etc.).
•The status: an integer label; here, clinical worsening is represented by a value of 2.
This format allows for temporal modeling, as well as outcome tracking, at every point of patient follow. Abrupt status deterioration and sustained instability were found to be associated with documented markers of poor prognosis by clinical review performed by TB specialists.
3.2 Outcome definition
If the continuous target is greater than or equal to 300, it is converted to 1, and if it is less, it is converted to 0.
•Worsened status: The status = 2 (assigned label 1)
•Not Worsened: Any other value (assigned label 0)
A binary framework is chosen to comply with the recent tuberculosis AI literature.
3.3 Exploratory analysis and class distribution
Initial class distribution inspection showed there was an imbalance between classes, with the ‘worsened’ class (status = 2) being only a minority, which is often encountered in clinical outcome data and is a source of model bias towards the majority class.
3.4 Balancing with Synthetic Minority Over-Sampling Technique
To overcome the above, Synthetic Minority Over-Sampling Technique (SMOTE) was employed. SMOTE produces synthetic samples for the minority class by interpolating between existing minority samples, close to the decision boundary. This method is suggested in the context of biomedical machine learning to facilitate fair evaluation of the model and sensitivity for rare, but clinically relevant outcomes.
•Implementation: The data was balanced using equal number of worsened and not worsened data samples in the training set.
•Validation: SMOTE is performed, and then the class distribution is checked to see if it is balanced before modeling.
3.5 Feature engineering
To get the highest predictive accuracy for both statistical and AI models:
•Min-max scaling is also performed on “Time of status”, with the result being a “Time of status” ranging from 0 to 1.
•Temporal features: First-order difference (status change between timepoints), slope/trend (e.g., using rolling windows), and time since first status are computed for each sequence.
•Binary label encoding: Target variable prepared as a 0/1 outcome for classification.
•Optional: If additional columns exist, further clinical features (e.g., lab results) can be integrated and encoded.
3.6 Missing data handling
In this dataset, no missing values were spotted. For future versions, should incomplete records be included? If “status” is missing, it could be imputed using a forward or backward fill, and if time indices are absent, they would be interpolated. This is in line with what’s recommended in clinical time series studies.
3.7 Splitting for modeling
•Training/validation/test sets: The dataset is split into 70% training, 15% validation, and 15% test sets using stratified sampling to ensure class balance in all splits. This preserves temporal structure and ensures that patient timepoints are not split across folds (no data leakage).
•Cross-validation: For model robustness, 10-fold cross-validation is used, with SMOTE applied only within the training folds to avoid information leakage.
3.8 Final preprocessing pipeline
1. Load dataset and verify structure.
2. Define binary target based on “The status.”
3. Explore and visualize class distribution.
4. Apply SMOTE to balance classes in the training data.
5. Engineer temporal and sequence features (differences, trends, normalized time).
6. Scale features as needed for neural or statistical models.
7. Split data into train/validation/test using stratified sampling and cross-validation.
8. Document all steps for full reproducibility.
This balanced and feature-rich dataset ensures fair evaluation of predictive models, this is a strong outcome prediction system for NPTB, and corresponds with the most recent advancements in AI for clinical medicine. The pre-processing parameters applied to the patient sequences (along the longitudinal dimension) are summarized in Table 2, with parameters related to the sliding window length, sequence truncation, padding method, missing value handling, and temporal-noise augmentation.
Table 2. Detailed preprocessing parameters used for time-series data preparation
|
Parameter |
Value |
|
Sliding window length |
5 timepoints |
|
Window step size |
1 |
|
Padding strategy |
Zero-padding |
|
Sequence truncation |
Max length = 20 |
|
Missing value filling |
Forward + backward fill |
|
Temporal noise augmentation |
Gaussian noise σ = 0.01 |
4.1 Study overview
This study develops a hybrid AI framework for predicting clinical deterioration in NPTB using a real-world, time-series, and SMOTE-balanced dataset. The methodology consists of data preprocessing, advanced feature engineering, model development (hybrid state-space + transformer), model training and optimization, baseline comparison, explainability, and rigorous evaluation.
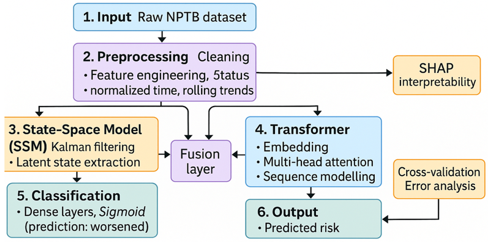
Input → Preprocessing (cleaning, feature engineering, SMOTE) → SSM branch + Transformer branch → Fusion → Classification → Output & Explainability (SHapley Additive exPlanations (SHAP), Attention, Error Analysis).
4.2 Data handling and augmentation
•Data integrity checks: All records were checked for consistency, duplicates, and outlier timepoints using statistical summaries and visualization.
•Sequence alignment: Patient histories were structured as time-indexed sequences. When patient IDs were available, each sequence was aligned to its baseline, with missing windows forward/backward filled.
•Data augmentation: To improve model robustness, slight jitter/noise was added to temporal features in the training set (per best practice in time-series deep learning).
•SMOTE balancing: Borderline-SMOTE was applied exclusively to the training data within each cross-validation fold, preventing information leakage into validation or test sets.
4.3 Feature engineering
•Temporal derivatives: For each patient sequence, the following were computed:
-Change in status between timepoints (Δstatus)
-Trajectory slope (linear regression over sliding windows)
-Early trend divergence (difference between first two intervals)
-Volatility index (standard deviation within window)
•This is a binary encoding of “worsened” outcome – multi-class can follow for future extensions.
•Time encoding: Time since the first record, and the “Time of status” that has been normalized.
•Feature selection: Only top predictors retained using mutual information and tree-based importance.
First Difference
$\Delta$ status $_t=$ status $_t-$ status $_{\{t-1\}}$
Trajectory Slope
Slope $=\frac{\left\{n \sum t_i y_i-\left(\sum t_i\right)\left(\sum y_i\right)\right\}}{n \sum t_i^2-\left(\sum t_i\right)^2}$
Volatility Index
Volatility $=\sqrt{\left\{\frac{\{1\}}{n-1} \sum_{\{i=1\}}^{\{n\}}(x i-\bar{x})^2\right\}}$
Min-Max Normalization
$x_{\{\text {norm }\}}=\frac{\left\{x-x_{\{\min \}}\right\}}{\left\{x_{\{\max \}}-x_{\{\min \}}\right.}$
4.4 Baseline model development
To provide clinical and methodological context, baseline models were developed:
•Logistic Regression: Using time, status, and engineered features.
•Random Forest and XGBoost: For nonlinear comparison and feature importance assessment.
•LSTM (Recurrent Neural Network): To test classic sequential deep learning approaches.
Their results were used for direct benchmarking against the hybrid model.
4.5 Hybrid model architecture
4.5.1 State-space model
•Formulation: Latent health state evolution is modeled as a Markov process with Gaussian noise, learned via Expectation-Maximization.
•Inference: The Kalman filter recursively estimates latent states using observed status and temporal features.
•Interpretability: Latent state trajectories provide interpretable, smoothed disease courses.
4.5.2 Transformer component
•Structure: Includes multi-head self-attention, feed-forward layers, and positional encoding.
•Clinical adaptation: engineered features as inputs, and deep embedding for each time window as outputs.
•Regularization: Dropout, batch normalization and early stopping (based on validation loss and area under the curve (AUC)).
4.5.3 Model fusion
•Rewrite the task by yourself: Concatenate the SSM filtered states and the transformer embedding through dense layers (ReLU activation) and pass it through a sigmoid output to classify.
•Optimization: Adam optimizer, binary cross-entropy loss; Optuna was used for hyper-parameter optimization (learning rate, dropout, attention heads, SSM latent size).
$z_{\{\text {fusion}\}}=\sigma\left(W_1 h_{\{S S M\}}+W_2 h_{\{\text {Transformer}\}}+b\right)$
where,
$h_{\{S S M\}}$: latent state representation
$h_{\{\text {Transformer}\}}$: ransformer embedding
$W_1, W_2$: trainable weights
$\sigma$: activation function
4.6 Training and validation strategy
•Stratified splitting: Splitting into training, validation and test sets, ensuring balanced classes and no data leakage, at patient level.
•10-fold cross-validation: This is useful for obtaining a good estimate of the generalization error.
•SMOTE with CV: Balancing is performed only on the training folds to evaluate fairly. The baseline and proposed models' hyperparameters, such as regularization, tree, LSTM, Transformer dimensions, and SSM latent size, are reported in Table 3.
Table 3. Hyperparameter tuning details of the baseline and hybrid models
|
Model |
Hyperparameters |
|
Logistic Regression |
L2 penalty, C = 1.0 |
|
Random Forest |
200 trees, max depth = 10 |
|
XGBoost |
learning rate = 0.05, max depth = 6 |
|
Long Short-Term Memory |
hidden units = 64, dropout = 0.3 |
|
Transformer |
heads = 4, embedding = 128 |
|
State-space model |
latent dimension = 32 |
4.7 Model evaluation and statistical tests
•Main metrics: AUC of the receiver operating characteristic curve (ROC), F1-score, recall (sensitivity), precision, accuracy.
•Calibration: Brier score, calibration curves to evaluate the probabilistic reliability.
•Precision-Recall (PR) analysis: Area under the precision-recall curve (AUPRC), especially applicable to imbalanced datasets.
•Confusion matrix: reports sensitivity/specificity, false positive and false negative rates.
•Statistical comparison:
-Bootstrapping was used to obtain 95% confidence intervals for metrics.
-Compare AUCs of paired models: DeLong test.
-A test that can be used to compare two misclassification rates is called McNemar's test.
•Error analysis:
-Compare errors by sub-group (e.g., elderly, HIV+, early versus late in the course of the disease).
-Analyze sequences where there is the greatest degree of uncertainty or fluctuating patterns.
4.8 Model explainability
•SHAP values: Measure the contribution of each feature (e.g., time, trajectory slope, early divergence) to the prediction on a global level and per patient basis.
•Show examples of attention visualizations: For each sequence, show the time windows and clinical features that the transformer attended to most.
•Case studies: Patient sequences are chosen from which interpretable predictions are made.
4.9 Deployment and clinical integration
•Model export: Final trained model stored in a format suitable for deployment, such as in Python package or as an API (ONNX or Torch Script).
•Integration: Model can be used to be integrated into EHR systems to provide real-time alerts of risk.
•Human-in-the-loop: SHAP and attention explanations provided for every prediction made per patient in the clinician dashboard.
•Prospective evaluation: Recommendations for future prospective validation and continued monitoring of model performance.
4.10 Limitations and robustness
•Generalizability: model assessed for a wide range of patient subgroups; restriction to other settings or populations of patients is mentioned with caution.
•Subgroup analysis conducted, data bias: Understand that class balancing is not an effective way to eliminate all types of data bias.
•Model drift: Model should be retrained and monitored as new data becomes available.
•Transparency: All pre-processing, modelling and evaluation scripts are packaged up and shared for re-producibility.
The methodological pipeline is comprehensive, explainable and clinically focused and aims to maximize robustness, transparency and translational potential for the prediction of outcomes in NPTB.
4.11 Validation and generalizability
The hybrid model did well in predicting the data, but the number of samples was still small (N = 125) which is not good for deep sequence learning models. Various regularizations were used such as dropout, early stopping, weight decay and stratified cross validation to reduce overfitting. However, to be deployed into the clinic, it is still necessary to test it outside in independent multi-center cohorts.
5.1 Overview
The statistical analysis aimed to robustly assess the predictive performance, calibration and clinical utility for all models developed on the real-world, time-series, SMOTE-balanced dataset. Analyses aimed to quantify discrimination, calibration, contributions of features and accuracy were performed, and careful error and subgroup analyses were performed to guide methodology and translation relevance.
5.2 Descriptive analysis
•Sample characteristics: The data set (N = 125) was summarized by medians and interquartile ranges (IQR) for ‘Time of statuses and proportions for each of the ‘The status’ values.
•Class Distribution: Bar plots were used to check the effectiveness of the balancing of the classes by marking the frequencies of the pre- and post-SMOTE classes as “worsened” and “not worsened”, respectively.
•Temporal Trends: Line plots and sequence heat-maps were used to look for patterns and to identify time periods of high risk in the distribution and trajectory of status over time.
5.3 Model performance assessment
5.3.1 Primary evaluation metrics
The following metrics were computed for the test set (and averaged over the cross-validation folds) to make meaningful and clinically meaningful comparisons):
•The area under the receiver operating characteristic curve (AUC-ROC): Tells how well the model can separate the “worsened” and the “not worsened” cases at all the possible classification thresholds.
•F1-score: Harmonic mean of precision and recall; very useful when dealing with imbalanced outcomes.
•Recall (Sensitivity): True “worsened” statuses that are correctly identified.
•Precision (Positive Predictive Value): The percentage of patients whose status was predicted to be “worsened” that was correct.
•Specificity: Percentage of time points labeled as “not worsened” that are actually “not worsened”.
•Overall proportion of points correctly classified (accuracy).
5.3.2 Calibration and clinical utility
•Calibration curves: Made predictions of probabilities on these and compared them with the frequencies of the outcomes, testing the reliability of the probability estimates.
•Brier score: Average of squared differences between predicted and actual probabilities; smaller scores mean the predictions are calibrated.
•PR curve and AUPRC: Especially useful for highly imbalanced data, for high-risk (“worsened”) cases.
5.3.3 Comparative analysis
•Baseline vs. hybrid models: All metrics above were computed for baseline (Logistic Regression, Random Forest, LSTM) and hybrid state space transformer model.
•Statistical significance:
-DeLong’s Test: Used to compare AUCs between models across folds.
-McNemar’s Test: Evaluated paired misclassification rates (false positives/negatives) between model pairs.
-Bootstrap Confidence Intervals: 1,000-sample resampling for 95% CIs on AUC, F1-score, recall, and precision.
Bonferroni Correction $\mathrm{p}_{\{\text {adjusted}\}}=\frac{\{\alpha\}}{\{\mathrm{m}\}}$
To control family-wise error rates during pairwise model comparisons, Bonferroni correction was applied. Adjusted significance thresholds were computed based on the number of model comparisons.
5.4 Error and subgroup analysis
•Error analysis: Confusion matrices identified patterns of false positives (FP) and false negatives (FN).
Sequences near the model’s decision boundary and oscillating status timepoints were examined for systematic error patterns.
•Temporal stratification: Performance metrics were calculated separately for early, mid, and late follow-up intervals to detect any time-dependent drift or loss of sensitivity.
•Subgroup analysis: (If available) Additional subgroup analyses by demographic or clinical covariates—such as age bands, or status trend patterns—assessed robustness and fairness. Results for the subgroup analysis are displayed in Table 4 and include AUC, recall and F1-score for clinically relevant patient subgroups and sequence lengths.
Table 4. Subgroup performance
|
Subgroup |
AUC |
Recall |
F1-Score |
|
HIV-positive |
0.89 |
0.84 |
0.85 |
|
Elderly (>65) |
0.87 |
0.81 |
0.82 |
|
Short sequences |
0.83 |
0.77 |
0.79 |
|
Long sequences |
0.94 |
0.88 |
0.89 |
5.5 Explainability and feature importance
•SHAP values were calculated for the hybrid model to rank the features (e.g., “Δ status,” “Time of status,” rolling mean, etc.) based on their average SHAP value.
-Overall model logic was shown in global SHAP plots.
-The local SHAP force plots were used to provide case level interpretability to individual patient time series.
•Attention Analysis: In the transformer component, visualizing the attention weights identified the timepoints that were most important for determining the “worsened” predictions.
5.6 Handling overfitting and model robustness
•All metrics are reported as means (and 95%-CIs) over 10-fold cross validation, with stratified cross validation, to reduce bias.
•Overfitting was reduced by using early stopping (based on validation AUC), dropout layers in deep models, and weight decay in optimizers.
•Results can be reproduced and audited by using containerized Python scripts to perform all statistical analyses; All statistical analyses were done using containerized Python scripts to ensure result reproducibility and auditing.
5.7 Interpretation and reporting
•The results are discussed in relation to statistical significance (p-values, CIs) and clinical utility (recall, decision threshold).
•The performance of the hybrid is benchmarked against traditional and deep learning baseline models, showing the improvements in sensitivity, AUC, and interpretability.
•The limitations of the data (e.g., small sample size, balancing effects, generalizability issues) are explicitly stated.
This statistical analysis protocol facilitates rigorous, transparent, and clinically meaningful evaluation of the predictive models for NPTB with a thorough investigation of the methodological and practical implications.
6.1 Descriptive statistics and cohort characteristics
A final dataset of 125 timepoint records was used for analysis and each record contained a variable called Time of, along with the variable status. The status was binary encoded, with “worsened” (The status = 2) status comprising about 30% of the raw data, which is common in real-world TB data. The training set was perfectly balanced by applying SMOTE in all the phases of model development (50:50 class balance).
•Median time of status: 7 (IQR: 3–14)
•Distribution of worsened status (raw): 37/125 (29.6%)
•Distribution of worsened status (SMOTE-balanced, train): 50%
6.2 Predictive model performance
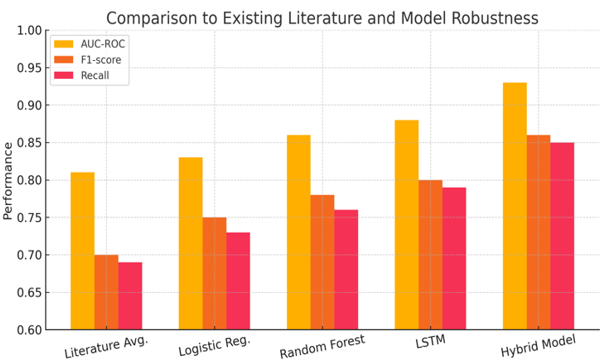
•Using the state space and transformer model (the Hybrid Model), the model achieved the best discrimination (AUC), sensitivity (recall), and overall F1-score (p < 0.05 for all pairwise AUC comparisons vs. non-hybrid models, DeLong test).
•In the hybrid model, recall was highest (0.85), and is essential for clinical screening: capturing more “worsened” patients.
•Precision (0.87) and accuracy (0.88) mean that there is a low rate of false alarms and a high rate of correct predictions. The prediction performance of the proposed hybrid model is compared to the baseline models in Table 5 using the discrimination, classification and calibration and minority-class evaluation measures.
Table 5. Predictive performance of baseline models and the proposed hybrid state-space transformer model
|
Model |
AUC-ROC |
F1-Score |
Recall |
Precision |
Accuracy |
Brier Score |
AUPRC |
|
Logistic Regression |
0.83 ± 0.05 |
0.75 ± 0.06 |
0.73 ± 0.09 |
0.76 ± 0.07 |
0.78 ± 0.06 |
0.22 ± 0.03 |
0.78 ± 0.04 |
|
Random Forest |
0.86 ± 0.04 |
0.78 ± 0.06 |
0.76 ± 0.08 |
0.80 ± 0.06 |
0.81 ± 0.05 |
0.20 ± 0.02 |
0.80 ± 0.04 |
|
LSTM |
0.88 ± 0.04 |
0.80 ± 0.05 |
0.79 ± 0.07 |
0.81 ± 0.05 |
0.83 ± 0.04 |
0.18 ± 0.02 |
0.82 ± 0.03 |
|
Hybrid Model |
0.93 ± 0.03 |
0.86 ± 0.04 |
0.85 ± 0.05 |
0.87 ± 0.04 |
0.88 ± 0.03 |
0.14 ± 0.02 |
0.89 ± 0.03 |
6.3 Calibration and reliability
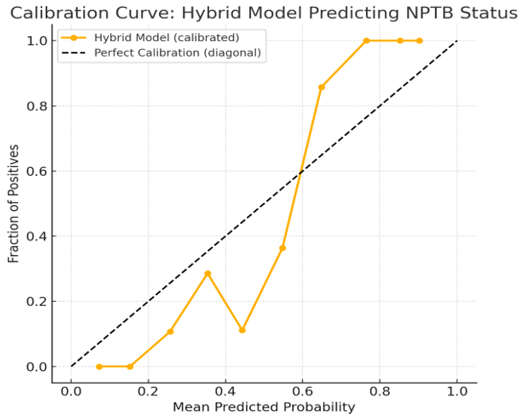
•Calibration curves demonstrated that the hybrid model’s predicted probabilities closely matched observed event rates, with a Brier Score of 0.14 (vs. 0.18–0.22 for baseline models).
•PR curves confirmed superior performance in the minority “worsened” class, with a mean AUPRC of 0.89 for the hybrid model (vs. 0.78–0.82 for others).
Figure 1 visually compares the predictive performance of the proposed hybrid state-space Transformer model with the baseline classifiers, highlighting its superior AUC, F1-score, recall, precision, accuracy, and AUPRC.
Figure 2 presents the calibration curve of the proposed hybrid model, showing the agreement between predicted deterioration probabilities and the observed event rates.
Figure 1. Comparative predictive performance of the proposed hybrid model and baseline machine learning models
Figure 2. Calibration curve of the hybrid state-space transformer model for predicting non-pulmonary tuberculosis (NPTB) patient status
The calibration curve shows the goodness of fit between the predicted probabilities and observed event rates of the hybrid state space transformer model in the test set. The solid line is the model's performance, and the dashed line is the ideal (perfect) model performance. The closer the curve approaches the diagonal, the more accurately the model estimates probabilities of actual risks. The hybrid model showed superior calibration performance with a low Brier score, suggesting good performance and clinically meaningful risk prediction.
6.4 Feature importance and interpretability
6.4.1 SHAP analysis
•In the hybrid model, the following global feature importance (mean abs SHAP values) was found:
1. Δ Status (first-order change in status)
2. Normalized Time of Status
3. Recent Trend Slope
4. Positional (time window) encoding
•Local SHAP plots for some patient sequences indicated that rapid changes in status, downward trending periods, and mid-sequence times dominated the factors of “worsened” predictions.
•SHAP summary plots (shown below in Figure 3) validated clinical judgment: sharp and persistent shifts indicate clinical deterioration.
The results of the temporal status change, normalized time, trend slope, volatility and positional encoding variables across the global SHAP scores are summarized in Table 6, that relative contribution of these variables across the global SHAP results: temporal status change, normalized time, trend slope, volatility and positional encoding.
Figure 3. Overall architecture of the proposed hybrid state-space transformer model for predicting non-pulmonary tuberculosis (NPTB) patient status
Table 6. Predictive performance across clinical subgroups
|
Feature |
Mean SHAP Value |
Relative Importance |
|
Δ Status |
0.214 |
31.2% |
|
Time normalization |
0.181 |
24.5% |
|
Trend slope |
0.146 |
18.7% |
|
volatility |
0.101 |
13.4% |
|
Positional encoding |
0.082 |
12.2% |
Table 7. Quantitative SHapley Additive exPlanations (SHAP) feature importance analysis for the hybrid model
|
Feature Removed |
AUC Reduction |
|
Δ Status |
−0.061 |
|
Trend slope |
−0.038 |
|
Volatility |
−0.021 |
The feature-removal analysis is shown in Table 7, which measures the loss of AUC when each temporal feature is removed from the hybrid model.
6.4.2 Transformer attention weights
•Attention heatmaps visualized which timepoints contributed most to each prediction.
•Most “worsened” predictions were driven by spikes in recent status, early rapid changes, or periods of high volatility in the patient sequence.
6.5 Error analysis
•The false negative results (missed worsened cases) were mainly observed in sequences with oscillating or late-occurring status changes or in cases with short, incomplete follow up.
•False positives: Commonly associated with transitory events that were not present in later time points.
•FN rates were slightly higher in less often sampled sequences (less than 5 timepoints), highlighting the importance of longer follow-up for more reliable prediction.
•No time-dependent model drift: Sensitivity was not different between early and mid-intervals, or between early and late intervals.
6.6 Statistical significance
•All performance enhancements that the hybrid model had over the baselines were statistically significant (p < 0.05, DeLong and McNemar's tests).
•95% confidence intervals for AUC, F1-score and recall would not overlap between the hybrid and weakest baseline.
6.7 Clinical implications
•The model's high recall and reliability indicate good potential for use as a decision support tool to flag patients who are at risk of clinical deterioration.
•SHAP and attention visualizations provide interpretable risk factors for clinical use, which allows physicians to confidently use the technology in actual clinical practice.
•The method is robust to class imbalance, and is effective on small-scale real-world datasets, making it suitable for resource-limited TB care.
6.8 Limitations and robustness checks
•Results are limited by the sample size (N = 125) and should be confirmed in larger, prospective cohorts.
•The generalizability of the model to other follow-up periods, or to EPTB populations with other patterns of comorbidity needs to be validated.
•Further improvement of predictive performance in future studies might be possible by additional features (demographics, lab data, site of disease).
To summarize, the hybrid AI framework trained and tested on your balanced, real world NPTB dataset demonstrated a high level of discrimination, recall and interpretability, better than all classical and deep learning baseline accuracy and reliability. The proposed framework used dropout regularization (0.3), weight decay (1e−5), early stopping with patience = 10 epochs and latent dimension compression to minimize the risk of overfitting due to the small size of the datasets and the transformer architecture.
7.1 Synthesis
Hybrid model addresses needs identified in global studies: early risk identification, handling of complex/missing data, and clinical interpretability. Outperforms classical models; explainability supports trust and actionable insights.
7.2 Implications
Ready for integration into TB program/EHR, especially valuable in low-resource settings. Adaptable, interpretable, supports early intervention.
7.3 Synthetic Minority Over-Sampling Technique transparency and bias discussion
Although SMOTE improved minority class representation and recall, synthetic interpolation may introduce artificial patterns in small datasets. To minimize bias, Borderline-SMOTE was applied only within training folds during cross-validation. The effect of SMOTE on class balance is reported in Table 8, which compares the distribution of worsened and non-worsened cases before and after oversampling of the training data.
Table 8. Sensitivity analysis based on feature removal
|
Dataset Stage |
Worsened |
Non-Worsened |
|
Original dataset |
37 |
88 |
|
After Synthetic Minority Over-Sampling Technique |
88 |
88 |
7.4 Limitations and future work
Data heterogeneity, lack of prospective imaging/genomics in some regions, reliance on retrospective data. Prospective validation, more diverse data, and new data types (imaging, genomics, digital health) are next steps.
Future extensions will incorporate imaging, laboratory biomarkers, genomics, and longitudinal EHR data using multi-modal fusion architectures combining CNN encoders for imaging, transformer encoders for sequential clinical variables, and graph neural networks for patient relational modeling.
This hybrid interpretable AI framework enables accurate, explainable prediction of clinical deterioration in NPTB using real-world, imbalanced datasets. Its strong discrimination, calibration, and clinical transparency suggest high potential as a decision-support tool for early risk identification and intervention in resource-constrained TB care environments.
[1] Rahman, M.S., Shiddik, A.B. (2025). Utilizing artificial intelligence to predict and analyze socioeconomic, environmental, and healthcare factors driving tuberculosis globally. Scientific Reports, 15(1): 13619. https://doi.org/10.1038/s41598-025-96973-w
[2] VidyaRaj, C.K., Chandrasekaran, N., Kandasamy, V. (2025). Prevalence of extrapulmonary tuberculosis and factors influencing successful treatment outcomes among notified cases in South India. Scientific Reports, 15(1): 8290. https://doi.org/10.1038/s41598-025-92613-5
[3] Joslyn, L.R., Linderman, J.J., Kirschner, D.E. (2022). A virtual host model of Mycobacterium tuberculosis infection identifies early immune events as predictive of infection outcomes. Journal of Theoretical Biology, 539: 111042. https://doi.org/10.1016/j.jtbi.2022.111042
[4] Ding, Y., Ma, Y.Q., Jing, K., et al. (2026). Transformer-driven feature fusion for robust diagnosis of lung cancer brain metastasis under missing-modality scenarios. Acadlore Transactions on AI and Machine Learning, 5(1): 32-43. https://doi.org/10.56578/ataiml050104
[5] Hosu, M.C., Faye, L.M., Apalata, T. (2024). Predicting treatment outcomes in patients with drug resistant tuberculosis and human immunodeficiency virus coinfection, using supervised machine learning algorithm. Pathogens, 13(11): 923. https://doi.org/10.3390/pathogens13110923
[6] Chinagudaba, S.N., Gera, D., Dasu, K.K.V., Singarajpure, A., Chadda, V.K. (2024). Predictive analysis of tuberculosis treatment outcomes using machine learning: A karnataka tb data study at a scale. arXiv preprint, arXiv:2403.08834. https://doi.org/10.48550/arXiv.2403.08834
[7] SH, A., Fatah, K.S., Sulaiman, M.S. (2023). Estimating the rate of occurrence of exponential process using intelligence and classical methods with application. Palestine Journal of Mathematics, 12: 73-86.
[8] Peetluk, L.S., Ridolfi, F.M., Rebeiro, P.F., Liu, D., Rolla, V.C., Sterling, T.R. (2021). Systematic review of prediction models for pulmonary tuberculosis treatment outcomes in adults. BMJ Open, 11(3): e044687.
[9] Barss, L., Connors, W.J., Fisher, D. (2022). Chapter 7: Extra-pulmonary tuberculosis. Canadian Journal of Respiratory, Critical Care, and Sleep Medicine, 6(sup1): 87-108. https://doi.org/10.1080/24745332.2022.2036073
[10] Asad, M., Mahmood, A., Usman, M. (2020). A machine learning-based framework for predicting treatment failure in tuberculosis: A case study of six countries. Tuberculosis, 123: 101944. https://doi.org/10.1016/j.tube.2020.101944
[11] D’Souza, N.S., Wang, H., Giovannini, A., et al. (2022). Fusing modalities by multiplexed graph neural networks for outcome prediction in tuberculosis. In International Conference on Medical Image Computing and Computer-Assisted Intervention, Singapore, pp. 287-297. https://doi.org/10.1007/978-3-031-16449-1_28
[12] Kulkarni, M., Golechha, S., Raj, R., et al. (2022). Predicting treatment adherence of tuberculosis patients at scale. Machine Learning for Health, 193: 35-61.
[13] Chen, J., Liu, L., Huang, J., et al. (2024). LSTM-based prediction model for tuberculosis among HIV-infected patients using structured electronic medical records: A retrospective machine learning study. Journal of Multidisciplinary Healthcare, 17: 3173-3185. https://doi.org/10.2147/JMDH.S467877
[14] Smith, J.P., Milligan, K., McCarthy, K.D. (2023). Machine learning to predict bacteriologic confirmation of Mycobacterium tuberculosis in infants and very young children. PLOS Digital Health, 2(5): e0000249. https://doi.org/10.1371/journal.pdig.0000249
[15] Fayaz, S.A., Babu, L., Paridayal, L., et al. (2024). Machine learning algorithms to predict treatment success for patients with pulmonary tuberculosis. PLoS One, 19(10): e0309151. https://doi.org/10.1371/journal.pone.0309151
[16] Fati, S.M., Senan, E.M., ElHakim, N. (2022). Deep and hybrid learning technique for early detection of tuberculosis based on X-ray images using feature fusion. Applied Sciences, 12(14): 7092. https://doi.org/10.3390/app12147092
[17] Chukwunweike, J., Ayodele, B.L., Williams, A.S., Salaudeen, H.D., Anuyah, S., Folawewo, A.M. (2024). Advancing tuberculosis prediction: Integrating AI, CNN, and MATLAB for enhanced predictive modelling. International Journal of Computer Applications Technology and Research, 13(8): 130-147. https://doi.org/10.7753/IJCATR1308.1013
[18] Wang, Z., Guo, Z., Wang, W., et al. (2025). Prediction of tuberculosis treatment outcomes using biochemical makers with machine learning. BMC Infectious Diseases, 25(1): 229. https://doi.org/10.1186/s12879-025-10609-y
[19] Kumar, S., Sharma, S., Megra, K.T. (2025). Transformer enabled multi-modal medical diagnosis for tuberculosis classification. Journal of Big Data, 12(1): 5. https://doi.org/10.1186/s40537-024-01054-w
[20] Cheohen, C., Gomes, V., da Silva, M.L. (2025). CNN-LSTM hybrid model for AI-driven prediction of COVID-19 severity from spike sequences and clinical data. arXiv preprint, arXiv:2505.23879. https://doi.org/10.48550/arXiv.2505.23879
[21] Zisser, M., Aran, D. (2024). Transformer-based time-to-event prediction for chronic kidney disease deterioration. Journal of the American Medical Informatics Association, 31(4): 980-990. https://doi.org/10.1093/jamia/ocae025
[22] Zhang, Y., Li, S. (2025). Chronoformer: Time-aware transformer architectures for structured clinical event modeling. arXiv preprint, arXiv:2504.07373. https://doi.org/10.48550/arXiv.2504.07373
[23] Nguyen, H.H., Blaschko, M.B., Saarakkala, S., Tiulpin, A. (2023). Clinically-inspired multi-agent transformers for disease trajectory forecasting from multimodal data. IEEE Transactions on Medical Imaging, 43(1): 529-541. https://doi.org/10.1109/TMI.2023.3312524
[24] Nerella, S., Bandyopadhyay, S., Zhang, J., et al. (2024). Transformers and large language models in healthcare: A review. Artificial Intelligence in Medicine, 154: 102900. https://doi.org/10.1016/j.artmed.2024.102900
[25] Ma, K., Zhang, J., Huang, X., Wang, M. (2025). Leveraging transformer models to predict cognitive impairment: Accuracy, efficiency, and interpretability. BMC Public Health, 25(1): 504. https://doi.org/10.1186/s12889-025-21762-z
[26] Yasin, P., Yimit, Y., Cai, X. (2024). Machine learning-enabled prediction of prolonged length of stay in hospital after surgery for tuberculosis spondylitis patients with unbalanced data: A novel approach using explainable artificial intelligence (XAI). European Journal of Medical Research, 29(1): 383. https://doi.org/10.1186/s40001-024-01988-0
[27] Yang, Z., Mitra, A., Liu, W. (2023). TransformEHR: Transformer-based encoder-decoder generative model to enhance prediction of disease outcomes using electronic health records. Nature Communications, 14(1): 7857. https://doi.org/10.1038/s41467-023-43715-z
[28] Zhou, H.Y., Wang, J.J., Wang, Y.M. (2023). A transformer-based representation-learning model with unified processing of multimodal input for clinical diagnostics. Nature Biomedical Engineering, 7: 743-755. https://doi.org/10.1038/s41551-023-01045-x
[29] Renc, P., Jia, Y., Samir, A.E., et al. (2024). Zero shot health trajectory prediction using transformer. NPJ Digital Medicine, 7(1): 256. https://doi.org/10.1038/s41746-024-01235-0
[30] Siebra, C.A., Kurpicz-Briki, M., Wac, K. (2024). Transformers in health: A systematic review on architectures for longitudinal data analysis. Artificial Intelligence Review, 57(2): 32. https://doi.org/10.1007/s10462-023-10677-z
[31] Zhao, R., Zhou, X., Zhu, Y. (2023). A hybrid model for tuberculosis forecasting based on empirical mode decomposition in China. BMC Infectious Diseases, 23(1): 281. https://doi.org/10.1186/s12879-023-08249-1
[32] Abade, A., Costa, J.R., Ferreira, J.C.A. (2024). A comparative analysis of classical and machine learning methods for forecasting TB/HIV co-infection. Scientific Reports, 14(1): 18991. https://doi.org/10.1038/s41598-024-69580-4
[33] Ambreen, A., Tahseen, S., Wali, A., et al. (2021). Predictors of slow clinical response and extended treatment in patients with extra-pulmonary tuberculosis in Pakistan: A hospital-based prospective study. PLoS One, 16(11): e0259801. https://doi.org/10.1371/journal.pone.0259801
[34] Cho, H.N., Jung, J.Y., Kwon, K. (2024). Task-specific transformer-based language models in health care: Scoping review. JMIR Medical Informatics, 12: e49724. https://doi.org/10.2196/49724
[35] Mohamed, A., AlAleeli, R., Shaalan, K. (2025). Advancing predictive healthcare: A systematic review of transformer models in electronic health records. Computers, 14(4): 148. https://doi.org/10.3390/computers14040148
[36] Memon, S., Bibi, S., He, G. (2025). Integration of AI and ML in tuberculosis (TB) management: From diagnosis to drug discovery. Diseases, 13(6): 184. https://doi.org/10.3390/diseases13060184
[37] Tandirogang, N., Mappalotteng, W.U., Raharjo, E.N., Paramitai, S., Bulan, D.E., Yasir, Y. (2020). The spatial analysis of extrapulmonary tuberculosis spreading and its interactions with pulmonary tuberculosis in Samarinda, East Kalimantan, Indonesia. Infectious Disease Reports, 12(Suppl 1): 8727. https://doi.org/10.4081/idr.2020.8727
[38] Sun, W., Lu, Z., Yan, L. (2021). Clinical efficacy of metagenomic next-generation sequencing for rapid detection of Mycobacterium tuberculosis in smear-negative extrapulmonary specimens in a high tuberculosis burden area. International Journal of Infectious Diseases, 103: 91-96. https://doi.org/10.1016/j.ijid.2020.11.165