Steven Chin Su Leong | Nor Maniha Abdul Ghani* | Mohd Ridzuan Mohd Said | Nur Zahirah Mohd Ali | Syamimi Mardiah Shaharum
© 2026 The authors. This article is published by IIETA and is licensed under the CC BY 4.0 license (http://creativecommons.org/licenses/by/4.0/).
OPEN ACCESS
Heart rate recovery (HRR) provides valuable information on cardiovascular autonomic regulation and functional recovery after exercise, yet conventional assessment methods often rely on predefined thresholds and may not capture individualized recovery dynamics. This study proposes a physiologically constrained deep learning framework for wearable photoplethysmography (PPG)-based HRR assessment in patients undergoing cardiac rehabilitation. The proposed model integrates convolutional neural networks, temporal convolutional networks, squeeze-and-excitation mechanisms, and gated transformer networks to learn both local and long-range temporal characteristics from 60-s HRR sequences. To incorporate physiological knowledge into model optimization, an exponential decay constraint was introduced to guide the learning of recovery trajectories. A total of 1,307 HRR samples collected from 34 patients with coronary artery disease were analyzed using strict patient-level data partitioning and an independent test cohort. The proposed framework achieved an accuracy of 92.98%, sensitivity of 88.89%, and area under the curve (AUC) of 0.9730 on the independent test set. Comparative experiments with conventional machine-learning approaches, ablation studies, and SHapley Additive exPlanations (SHAP)-based interpretation further demonstrated the effectiveness and physiological relevance of the proposed method. These findings indicate that integrating physiological constraints with deep learning can improve the analysis of wearable-derived HRR signals and may support intelligent monitoring strategies for personalized cardiac rehabilitation.
heart rate recovery, wearable photoplethysmography, Physiological constraint learning, deep learning, coronary artery disease, cardiac rehabilitation, cardiovascular monitoring
Coronary artery disease (CAD) remains a major contributor to global cardiovascular morbidity and mortality, particularly among ageing populations. Early detection and continuous monitoring are essential for timely intervention, and wearable sensors now provide continuous, non-invasive monitoring of physiological signals that enable early identification of abnormal cardiac patterns [1-5].
The increasing adoption of wearable technology has facilitated the large-scale collection of physiological signals such as heart rate (HR), heart-rate variability (HRV), and step count from individuals in daily life [6-8]. These data have been used to estimate cardiorespiratory fitness, predict hospitalization risk, and identify adverse cardiovascular outcomes [9-11]. Hybrid and Bayesian models have been developed to simulate personalized HR responses during workouts for more accurate fitness recommendations [12]. Heartbeat time-series analysis using machine learning has demonstrated diagnostic potential for differentiating health states based on HRV patterns [13], while non-linear modelling of RR-interval fluctuations has shown improved cardiovascular monitoring performance [14]. Recent studies have demonstrated that continuous heart rate recovery (HRR) monitoring from wearable ECG signals can identify cardiovascular risk groups. These findings support its use in large-scale population settings [15].
HRR is a key indicator of cardiovascular autonomic function, particularly following rehabilitation exercise. Delayed responses have been observed in individuals with type 1 diabetes and novice female runners [16, 17]. However, conventional HRR assessment methods are often based on fixed thresholds and may not fully capture the dynamic recovery behaviour observed across different individuals, potentially limiting their effectiveness for personalized CAD risk assessment during rehabilitation. As wearable devices continue to improve in signal fidelity, validation studies have confirmed their accuracy in heart-rate measurement during rehabilitation and exercise testing contexts, with acceptable error margins even among patients with cardiovascular disease [18].
Advances in machine learning and artificial intelligence have further supported applications in cardiovascular risk prediction, continuous monitoring, and short-term forecasting using physiological and wearable-derived HR and HRV data [19-22]. These technologies have also been applied in exercise physiology to classify athlete profiles, estimate perceived exertion, and model recovery dynamics [23-25]. A recent review highlights deep learning for biomedical signal analysis [26].
However, most existing HRR classification approaches remain purely data-driven, and physiological recovery behaviour is rarely incorporated directly into model training. As a result, the learned representations may not fully reflect known cardiovascular recovery mechanisms. This limitation is particularly relevant for HRR analysis, where post-exercise recovery is commonly characterized by an exponential decay pattern. This physiological behaviour reflects the gradual withdrawal of sympathetic activity and reactivation of parasympathetic regulation following exercise cessation.
Despite the growing application of deep learning in wearable cardiovascular monitoring, limited studies have explicitly incorporated physiological recovery mechanisms into HRR classification frameworks. Consequently, the potential benefits of integrating physiological recovery knowledge into wearable-based CAD assessment remain underexplored. This gap motivates the development of a learning framework capable of combining physiological knowledge with wearable-derived HRR data.
Therefore, this study proposes an exponential decay-constrained Convolutional Neural Network–Temporal Convolutional Network–Squeeze-and-Excitation–Gated Transformer Network (CNN-TCN-SE-GTN) framework for classifying HRR patterns using wearable-derived signals collected during cardiac rehabilitation. The framework incorporates a physiologically motivated exponential decay constraint during training. The objective is to encourage physiologically plausible recovery representations while maintaining classification performance for HRR assessment.
The main contributions of this study are threefold. First, an exponential decay-constrained CNN-TCN-SE-GTN framework is developed for HRR classification. Second, a physiologically motivated exponential decay constraint is incorporated to guide recovery representation learning. Third, the proposed framework is comprehensively evaluated using patient-level testing, ablation analysis, traditional machine-learning benchmarks, and SHapley Additive exPlanations (SHAP)-based interpretability analysis.
Ethical approval for this study was obtained from the institutional research ethics committee (IREC 2023-194). All procedures were conducted in accordance with relevant guidelines and regulations and adhered to the ethical principles outlined in the Declaration of Helsinki. Informed consent was obtained from all participants before they participated in the study.
Patients diagnosed with ischemic heart disease who had undergone coronary angiography were recruited for the study. Each patient was required to be clinically stable, capable of using smartphone-based rehabilitation applications, and at least 18 years of age. Exclusion criteria included patients with severe arrhythmias, recent myocardial infarction, or contraindications to exercise.
A total of 34 patients were enrolled. Multiple home-based rehabilitation sessions were collected from each participant, resulting in 1,307 HRR samples. Each rehabilitation session generated one HRR sample consisting of a 60-s post-exercise recovery segment. The number of sessions per patient ranged from 6 to 55 sessions. Because multiple sessions were collected from the same individual, patient-level separation was enforced during model development to prevent information leakage between training, validation, and testing datasets.
Clinical labels were assigned by a board-certified cardiologist based on coronary angiography findings and overall clinical assessment. Consequently, some diagnostic categories such as unstable angina (UA) were represented in both groups. Patients with UA without clinically significant coronary artery obstruction were classified as ‘Normal’, whereas patients with angiographically confirmed pathological findings were classified as ‘Abnormal’. Therefore, the binary labels reflected the final clinical interpretation of coronary angiography rather than the disease category itself. Patients with treated single-vessel disease (SVD) were classified as ‘Abnormal’ because they had a prior angiographically confirmed diagnosis of CAD. The binary labelling strategy was based on the final clinical diagnosis and angiographic findings rather than whether treatment had been performed.
HR data were collected from a standardized rehabilitation exercise protocol, which consisted of:
•120 s warm up
•180 s run slowly
•180 s run as fast as possible
•60 s cooling down
HRR data were recorded for 60 s beginning at the start of the cooling-down period using PPG-equipped wearables and uploaded to Firebase cloud storage for analysis.
2.1 Heart rate recovery feature extraction and statistical analysis
Statistical descriptors were derived from raw HRR sequences ({hr1, hr2, …, hr60}). These features were calculated for analysis and physiological characterization, but the final model used only the raw HRR sequence as input.
$\text {Drop: } H R_{\text {drop }}=h r_1-h r_{60}$ (1)
$\text {Slope: } H R_{\text {slope }}=\frac{h r_1-h r_{60}}{60}$ (2)
$\text {Variance: } H R_{v a r}=\frac{1}{n-1} \sum_{i=1}^n\left(h r_i-\overline{H R}\right)^2$ (3)
Baseline characteristics of patients were summarized. Continuous variables, such as age and HR, were expressed as mean ± standard deviation (SD). Meanwhile, categorical variables such as gender and clinical groups were reported as counts and percentages.
The normal and abnormal groups were compared using the following tests:
For an independent test, $\bar{x}_1$ and $\bar{x}_2$ represent the means of the two groups, $s_1^2$ and $s_2^2$ denote their respective variances, and $n_1$ and $n_2$ indicate the sample sizes of each group.
${ Independent } \,t_{ {test }}, t=\frac{\overline{x_1}-\overline{x_2}}{\sqrt{\frac{s_1^2}{n_1}+\frac{s_2^2}{n_2}}}$ (4)
The chi-squared test for categorical variables is defined as follows, where O and E represent the observed and expected frequencies, respectively:
$x^2=\frac{(O-E)^2}{E}$ (5)
Fisher’s Exact Test was used for 2 × 2 categorical comparisons with a small sample size or zero counts to determine the exact p-value for the association between groups, where $n=a+b+c+d$.
$p=\frac{(a+b)!(c+d)!(a+c)!(b+d)!}{a!b!c!d!n!}$ (6)
Analysis of variance (ANOVA) was used to test the age differences across clinical groups. Two-sided statistical tests were performed, and statistical significance was defined as p < 0.05. For results with very small p-values, p < 0.001 was reported to indicate strong statistical evidence. Effect sizes were additionally reported where appropriate.
$F=\frac{M S_{\text {between }}}{M S_{\text {within }}}$ (7)
2.2 Model development
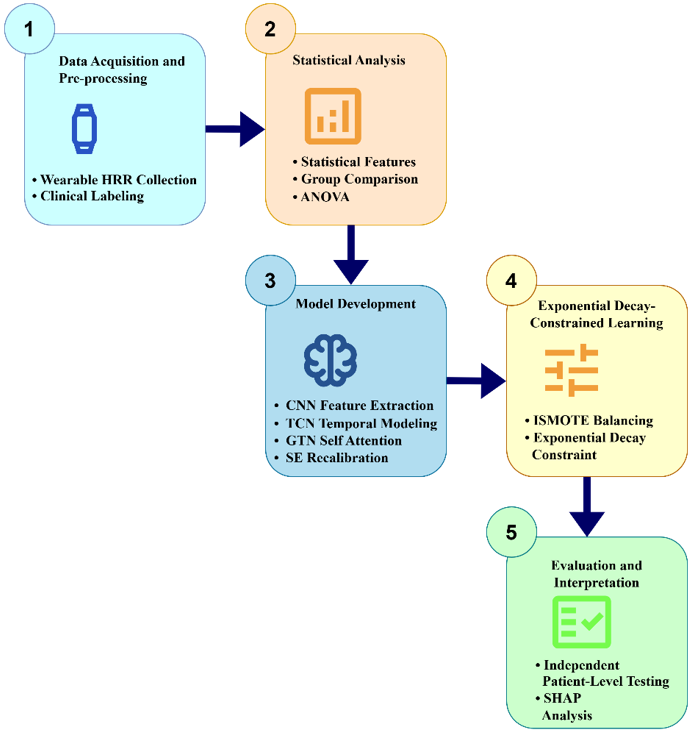
The hybrid model combines CNNs for local feature extraction, TCNs for temporal dependency modelling, SE blocks for adaptive feature recalibration, and a transformer (GTN) for long-range dependency analysis of HRR patterns (Figure 1).
The model used only the 60-second HRR sequence sampled at 1 Hz as input. Each HRR sample was represented as a 60 × 1 time-series vector corresponding to the recovery period immediately following exercise cessation. Demographic variables, clinical categories, and handcrafted statistical descriptors were excluded from the final model to evaluate the discriminative capability of HRR dynamics alone.
To address class imbalance, we applied the Improved Synthetic Minority Over-Sampling Technique (ISMOTE) in the training split only, which generates synthetic minority samples by interpolating between data point xi and one of its nearest neighbours xnn:
$x_{n e w}=x_i+\lambda\left(x_{n n}-x_i\right), \lambda \in[0,1]$ (8)
2.3 Exponential decay constraint
To investigate the influence of physiological recovery behaviour on model performance, several constraint functions were explored during model development. These constraints were designed to encourage recovery patterns that are consistent with known HRR characteristics.
Three constraint formulations were evaluated during the ablation study, including slope-based, variance-based, and exponential decay constraints. These constraints were assessed independently to determine their contribution to HRR classification performance.
$L_{{slope }}=\frac{1}{N} \sum\left( { slope }_{{pred }}- { slope }_{ {true }}\right)^2$ (9)
$L_{v a r}=\frac{1}{N} \sum\left(v a r_{p r e d}-v a r_{t r u e}\right)^2$ (10)
$H R(t)=H R_{ {rest }}+\left(H R_{ {peak }}-H R_{ {rest }}\right) e^{-k t}$ (11)
where, k denotes the exponential decay constant that controls the rate of HRR decline. In this study, k was estimated independently for each 60-s HRR session by fitting the observed HRR sequence to the exponential recovery equation using nonlinear least-squares curve fitting. Therefore, k was not treated as a fixed global parameter but was allowed to vary across sessions and patients.
$L_{\text {exp }}=\frac{1}{N} \sum\left(H R_{\text {pred }}(t)-H R_{\text {true }}(t)\right)^2$ (12)
The final model employed the exponential decay constraint because it demonstrated the best performance during the ablation study. The total training loss combined categorical cross-entropy with the exponential decay constraint in Eq. (13).
$L=L_{\text {class }}+\lambda L_{\text {exp }}$ (13)
where, $L_{\text {class}}$ represents the standard sparse categorical cross-entropy classification loss, $L_{\text {exp}}$ is the physiologically grounded exponential decay trajectory reconstruction penalty, and λ is the regularizing hyperparameter, which was fixed at 0.2 during model compilation to properly balance gradient updates between the classification and trajectory constraint tasks.
The slope and variance constraints were evaluated during model development but were not included in the final model because they provided lower classification performance than the exponential decay constraint.
2.4 Model training and evaluation data partition strategy
The dataset was standardized using z-score normalization parameters calculated exclusively from the training data to prevent data leakage. Only the 60-second HRR sequence was used as input for model development.
To evaluate true model generalization on entirely unseen individuals, strict patient-level data partitioning was enforced. Twenty-six patients were allocated to the model development cohort, consisting of 22 patients for training and 4 patients for internal validation, while 8 patients were fully reserved as an independent test cohort as shown in Table 1. All tracking sessions from a given patient were assigned exclusively to a single cohort partition. This manual patient-isolated holdout strategy guarantees 100% separation, ensuring that zero intra-patient data leakage occurred between the training, internal validation, and testing steps.
The model was trained using the Adam optimizer with a learning rate of 0.001, batch size of 32, and a maximum of 100 epochs. Early stopping (patience = 10) and adaptive learning-rate reduction (factor = 0.5, patience = 3) were employed to reduce overfitting and improve convergence.
Table 1. Dataset partition
|
Dataset |
Patients |
Samples |
|
Development Set |
26 |
1008 |
|
Training Partition |
22 |
839 |
|
Internal Validation Partition |
4 |
169 |
|
Independent Test Set |
8 |
299 |
|
Total |
34 |
1307 |
Following model development, the final model was evaluated on an independent test cohort consisting of eight previously unseen patients. Model performance was assessed at both sample level and patient level using accuracy, precision, sensitivity, specificity, F1-score, and area under the receiver operating characteristic curve (AUROC). Patient-level predictions were obtained by averaging the predicted probabilities across all sessions belonging to the same patient and assigning the final patient label based on the majority prediction.
$\text { Accuracy }=\frac{T P+T N}{T P+T N+F P+F N}$ (14)
$\text { Precision }=\frac{T P}{T P+F P}$ (15)
$\text { Sensitivity }=\frac{T P}{T P+F N}$ (16)
$F 1-\text { score }=2 \cdot \frac{\text { Precision } \text { ⋅ } \text { Recall }}{\text { Precision }+ \text { Recall }}$ (17)
$\text { Specificity }=\frac{T N}{T N+F P}$ (18)
3.1 Baseline characteristics of participants
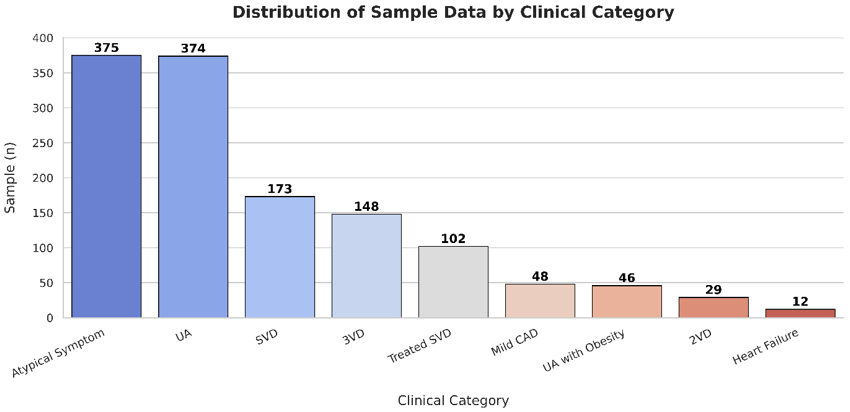
A total of 1307 HRR samples were analyzed. The mean age of the participants was 43.6 ± 10.5. The majority of the samples were from male patients (79.2%), while samples from female patients accounted for 20.8%. The most frequent clinical categories were atypical symptoms (28.7%) and UA (28.6%), followed by SVD (13.2%) and triple-vessel disease (3VD) (11.3%). Smaller subgroups included treated SVD (7.8%), Mild CAD (3.7%), UA with obesity (3.5%), double-vessel disease (2VD) (2.2%) and heart failure (0.9%). Table 2 and Figure 2 present the baseline demographic characteristics of participants. The dataset consisted of 731 Normal samples and 576 Abnormal samples. The distribution of samples across clinical diagnostic categories and binary classification labels is summarized in Table 3.
Table 2. Baseline demographic and clinical group distribution
|
Variables |
Overall (N = 1307) |
|
Age (years) |
43.6 ± 10.5 |
|
Male, n (%) |
1035 (79.2%) |
|
Female, n (%) |
272 (20.8%) |
|
Atypical symptom |
375 (28.7%) |
|
UA |
374 (28.6%) |
|
SVD |
173 (13.2%) |
|
3VD |
148 (11.3%) |
|
SVD but treated |
102 (7.8%) |
|
Mild CAD |
48 (3.7%) |
|
UA with Obesity |
46 (3.5%) |
|
2VD |
29 (2.2%) |
|
Heart Failure |
12 (0.9%) |
Table 3. Distribution of clinical categories according to binary classification labels
|
Clinical Group |
Normal |
Abnormal |
Total |
|
UA |
262 |
112 |
374 |
|
Atypical symptom |
375 |
0 |
375 |
|
SVD |
0 |
173 |
173 |
|
3VD |
0 |
148 |
148 |
|
SVD but treated |
0 |
102 |
102 |
|
Mild CAD |
48 |
0 |
48 |
|
UA with Obesity |
46 |
0 |
46 |
|
2VD |
0 |
29 |
29 |
|
Heart Failure |
0 |
12 |
12 |
|
Total |
731 |
576 |
1307 |
3.2 Comparisons between normal and abnormal groups
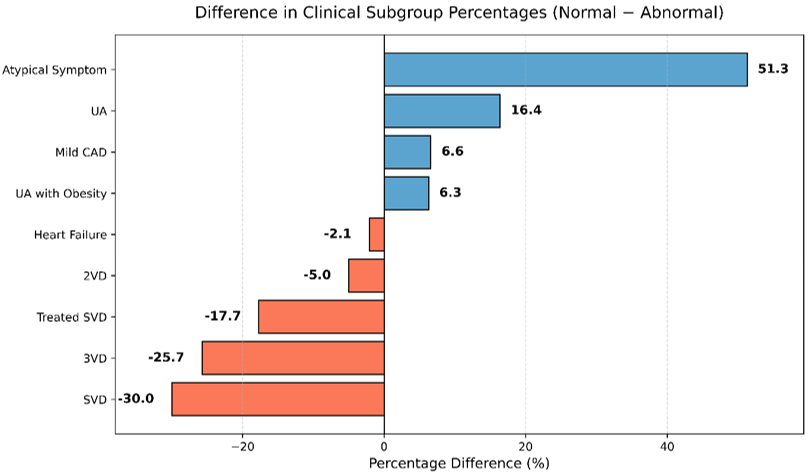
The comparison of demographic and clinical characteristics between the normal and abnormal groups is presented in Table 4 and Figure 3. The abnormal group was significantly older than the normal group (p < 0.05). No significant gender differences were observed. Significant differences were observed in clinical subgroup distributions between normal and abnormal groups.
Table 5 presents the statistical comparison of HRR-derived physiological features between normal and abnormal groups. Significant differences were observed for HR mean, HR drop, HR slope, and HR variance, with moderate effect sizes ranging from 0.47 to 0.79. In contrast, the estimated decay constant k showed no significant difference between groups (p = 0.108) and a negligible effect size (d = 0.10).
Table 4. Comparisons of normal vs. abnormal groups
|
Variables |
Normal |
Abnormal |
Test Statistic |
p |
|
Age (years) |
37.3 ± 6.4 |
51.6 ± 9.0 |
t = −32.37 |
<0.001, Cohen's d = 1.87 |
|
Gender, n |
Male: 575; Female:156 |
Male: 460; Female:116 |
X2 = 0.21 |
0.644 |
|
UA |
262 |
112 |
|
<0.001 |
|
Atypical symptom |
375 |
0 |
|
<0.001 |
|
SVD |
0 |
173 |
|
<0.001 |
|
3VD |
0 |
148 |
|
<0.001 |
|
SVD but treated |
0 |
102 |
|
<0.001 |
|
Mild CAD |
48 |
0 |
|
<0.001 |
|
UA with Obesity |
46 |
0 |
|
<0.001 |
|
2VD |
0 |
29 |
|
<0.001 |
|
Heart Failure |
0 |
12 |
|
<0.001 |
|
Overall Group |
|
|
X2 = 988.68, df = 8 |
<0.001 |
Table 5. Statistical comparison and effect size analysis of heart rate recovery (HRR)-derived features
|
Variables |
Normal Mean |
Abnormal Mean |
p-Value |
Cohen’s d |
|
HRR mean |
130.92 |
117.61 |
<0.001 |
−0.79 |
|
HRR drop |
22.98 |
16.33 |
<0.001 |
−0.51 |
|
HRR slope |
−0.383 |
−0.272 |
<0.001 |
0.51 |
|
HRR variance |
76.12 |
39.15 |
<0.001 |
−0.47 |
|
k |
0.0181 |
0.0221 |
0.108 |
0.10 |
3.3 Comparisons of mean age across clinical subgroups
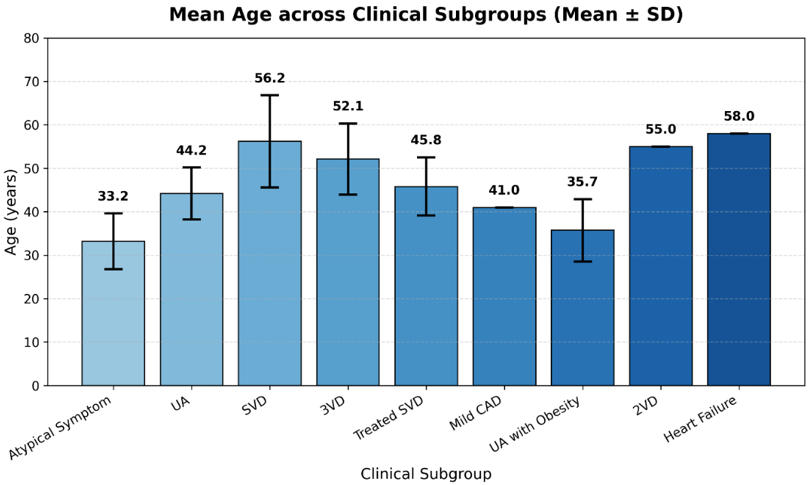
One-way ANOVA revealed significant differences in mean age across the nine clinical subgroups (F = 268.66, p < 0.05). Patients with heart failure and SVD had a higher mean age than those with atypical symptoms or UA. Table 6 and Figure 4 show the mean age across clinical subgroups.
3.4 Heart rate recovery pattern analysis
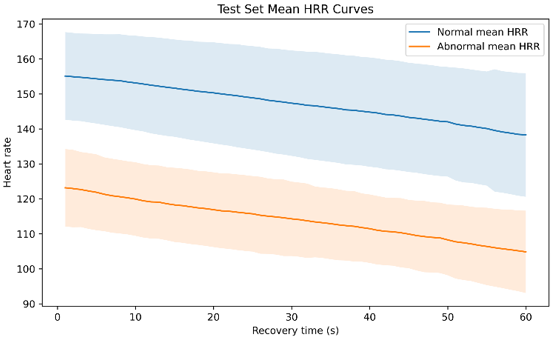
Figure 5 illustrates the mean HRR trajectories of the normal and abnormal groups in the independent test cohort. Both groups exhibited a progressive reduction in HR during the 60-s recovery period. However, distinct recovery patterns were observed between groups throughout the recovery interval. The normal group demonstrated a consistently different HRR trajectory compared with the abnormal group, indicating that temporal recovery dynamics contain discriminative information for CAD classification. The variability bands further show that the proposed framework was trained on physiologically heterogeneous recovery patterns.
Table 6. Mean age comparisons
|
Variables |
n |
Mean age ± SD (years) |
|
Atypical symptom |
375 |
33.2 ± 6.4 |
|
UA |
374 |
44.2 ± 6.0 |
|
SVD |
173 |
56.2 ± 10.6 |
|
3VD |
148 |
52.1 ± 8.2 |
|
SVD but treated |
102 |
45.8 ± 6.7 |
|
Mild CAD |
48 |
41.0 ± 0.0 |
|
UA with Obesity |
46 |
35.7 ± 7.2 |
|
2VD |
29 |
55.0 ± 0.0 |
|
Heart Failure |
12 |
58.0 ± 0.0 |
|
Overall |
N = 1307 |
43.6 ± 10.5 |
|
ANOVA |
|
F = 268.66, p < 0.001 |
Figure 5. Mean heart rate recovery (HRR) recovery trajectories for normal and abnormal groups in the independent test cohort (shaded areas represent ±1 standard deviation (SD))
3.5 Performance comparison on independent test set
An ablation study was performed to evaluate the contribution of each physiologically motivated constraint in Table 7, with additional metrics in Table 8. Five configurations were tested: no constraint, slope constraint, variance constraint, exponential decay constraint, and combined constraints. The combined model included slope, variance, and exponential decay constraints together.
The exponential decay constraint achieved the best overall performance, with the highest accuracy, specificity, and F1-score. Therefore, the exponential decay constraint was selected as the final model configuration. The combined constraint model did not improve performance, suggesting that adding multiple constraints may introduce competing optimization objectives.
Table 7. Test set performance (key metrics)
|
Model Configuration |
Accuracy |
AUC |
Sensitivity |
F1-Score |
|
No constraint |
0.9064 |
0.9722 |
0.8678 |
0.8824 |
|
Slope Constraint |
0.9064 |
0.9731 |
0.8974 |
0.8824 |
|
Variance constraint |
0.9097 |
0.9699 |
0.8689 |
0.8870 |
|
Combined Constraint |
0.8963 |
0.9725 |
0.8205 |
0.8610 |
|
Exponential Decay Constraint |
0.9298 |
0.9730 |
0.8889 |
0.9083 |
Table 8. Test set performance (additional metrics)
|
Model Configuration |
Precision |
Specificity |
|
No Constraint |
0.8678 |
0.9121 |
|
Slope constraint |
0.8678 |
0.8974 |
|
Variance constraint |
0.8689 |
0.9121 |
|
Combined Constraint |
0.9057 |
0.8205 |
|
Exponential decay constraint |
0.9286 |
0.9560 |
3.6 Comparison with traditional machine learning models on the independent test cohort
To benchmark the proposed framework, three traditional machine-learning models, namely Random Forest, XGBoost, and LightGBM, were evaluated using the same independent test cohort. As shown in Table 9 and Table 10, the proposed exponential-decay-constrained model achieved the highest overall accuracy (0.9298), AUC (0.9730), and F1-score (0.9083). Although Random Forest and XGBoost achieved competitive performance, their sensitivity values were lower than that of the proposed model. These findings suggest that incorporating temporal HRR dynamics through deep learning provides additional discriminative capability beyond conventional machine-learning approaches.
Table 9. Test set performance (key metrics)
|
Model |
Accuracy |
AUC |
Sensitivity |
F1-Score |
|
LightGBM |
0.8792 |
0.9441 |
0.8291 |
0.8362 |
|
Random Forest |
0.9130 |
0.9621 |
0.8376 |
0.8829 |
|
XGBoost |
0.9097 |
0.9590 |
0.8205 |
0.8767 |
|
Proposed Model |
0.9298 |
0.9730 |
0.8889 |
0.9083 |
Table 10. Test set performance (additional metrics)
|
Model Configuration |
Precision |
Specificity |
|
LightGBM |
0.8435 |
0.9011 |
|
Random Forest |
0.9333 |
0.9615 |
|
XGBoost |
0.9412 |
0.9670 |
|
Proposed Model |
0.9286 |
0.9560 |
3.7 Patient-level predictions on the independent test cohort
Table 11 presents the patient-level predictions for the independent test cohort. Mean abnormal probabilities were consistently higher in abnormal patients (0.5847-0.8506) than in normal patients (0.1724-0.3419), demonstrating clear discrimination between the two groups. All eight patients were correctly classified, demonstrating consistent model performance at the patient level.
Table 11. Patient-level predictions for the independent test cohort
|
ID |
Session |
True Label |
Predicted Label |
Mean Abnormal Probability |
|
P27 |
15 |
Abnormal |
Abnormal |
0.8506 |
|
P28 |
48 |
Abnormal |
Abnormal |
0.5847 |
|
P29 |
54 |
Normal |
Normal |
0.1750 |
|
P30 |
54 |
Abnormal |
Abnormal |
0.7990 |
|
P31 |
31 |
Normal |
Normal |
0.2026 |
|
P32 |
22 |
Normal |
Normal |
0.2198 |
|
P33 |
49 |
Normal |
Normal |
0.3419 |
|
P34 |
26 |
Normal |
Normal |
0.1724 |
3.8 Model complexity analysis
The proposed exponential decay-constrained CNN-TCN-GTN-SE model contained 222,118 trainable parameters with a total model size of 867.65 KB. The model required 25.47 s for training and achieved an average inference time of 11.48 ms per sample on the independent test set as depicted in Table 12.
Table 12. Model complexity and computational performance
|
Parameters |
Model Size (KB) |
Training Time (s) |
Inference Time (ms/Sample) |
|
222118 |
867.65 |
25.47 |
11.48 |
3.9 Model interpretability analysis using SHapley Additive exPlanations
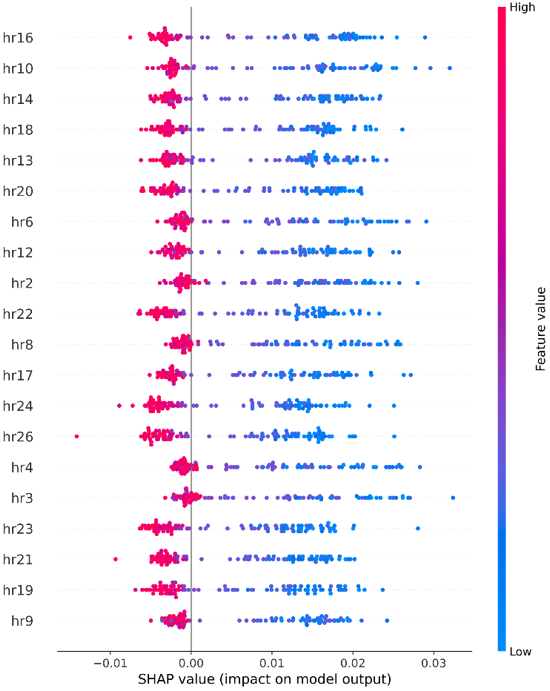
SHAP analysis was performed on the final exponential decay-constrained CNN-TCN-GTN-SE model using the independent test cohort. As shown in Figure 6, the most influential features were concentrated between approximately 10 and 20 seconds after recovery initiation, with hr16 exhibiting the highest contribution to the classification outcome. These results suggest that the model primarily relied on intermediate recovery dynamics rather than a single heart-rate measurement, indicating that temporal HRR patterns played an important role in distinguishing normal and abnormal recovery responses.
Figure 6. SHapley Additive exPlanations (SHAP) analysis
The proposed exponential decay-constrained CNN-TCN-SE-GTN framework achieved an independent test accuracy of 92.98% and sensitivity of 88.89%. These findings demonstrate the potential of wearable-derived HRR signals for distinguishing between normal and abnormal recovery responses. Patient-level evaluation correctly classified all eight patients in the independent test cohort, indicating that the learned HRR representations generalized beyond individual rehabilitation sessions. This is particularly relevant because multiple sessions were collected from each participant.
A key contribution of this study is the incorporation of an exponential decay constraint during training. Among the evaluated physiological constraints, the exponential decay formulation achieved the best performance in the ablation study. This result is consistent with the physiological behaviour of post-exercise HRR. By integrating physiological knowledge into the learning process, the proposed framework learned more representative HRR patterns while maintaining strong classification performance.
The proposed framework also demonstrated competitive performance compared with Random Forest, XGBoost, and LightGBM under the same evaluation protocol. A contextual comparison with related studies is presented in Table 13. Direct numerical comparison should be interpreted cautiously because the studies employed different datasets, patient populations, sensing modalities, and prediction objectives. Therefore, Table 13 is intended to provide context for the present work rather than a direct benchmark against previous studies. Nevertheless, the findings support the potential of combining temporal deep-learning architectures with physiological constraints for modelling wearable-derived HRR trajectories.
SHAP analysis indicated that the most influential features were concentrated between approximately 10 and 20 s after recovery initiation, suggesting that early-to-intermediate recovery dynamics contributed most strongly to classification performance. This finding is physiologically meaningful because autonomic reactivation is known to occur rapidly during the early phase of post-exercise recovery. The results further support that the proposed framework learned temporally relevant HRR characteristics rather than relying on isolated heart-rate measurements.
Several limitations should be acknowledged. The dataset consisted of 1,307 HRR sessions collected from 34 patients and was derived from a single rehabilitation programme. In addition, wearable PPG signals may be affected by motion artefacts and sensor placement variability. The study was also retrospective in nature and has not yet been validated in a prospective clinical setting. Future work should focus on larger multi-centre datasets and prospective clinical validation. Although all eight patients in the independent test cohort were correctly classified at the patient level, this finding should be interpreted cautiously because of the limited number of test patients. In addition, age differed significantly between the normal and abnormal groups; therefore, future studies should evaluate age-matched cohorts or adjust for age-related HRR variation. The current analysis reports computational feasibility at the model level, but deployment on embedded wearable hardware remains future work.
Table 13. Contextual comparison with related studies
|
Ref. |
Method |
Result |
Lim. |
Highlight |
|
[27] |
Transformer |
Accuracy: 93.4% |
Low interpretability |
HRR dynamics |
|
[28] |
CRNN |
Accuracy: 65% |
Low specificity |
HRR features |
|
[29] |
GBoost |
Sensitivity: 0.952 |
Imaging |
Wearable HRR |
|
[30] |
LGBM |
AUROC: 0.883 |
Static |
Dynamic HRR |
|
[31] |
Hybrid |
Accuracy: 98.7% |
Black-box |
Physics Loss |
|
This study |
CNN-TCN-SE-GTN |
Accuracy: 92.98% Sensitivity: 88.89% |
Small Cohort |
Exponential Decay Constraint |
This study presented an exponential decay-constrained CNN-TCN-SE-GTN framework for classifying HRR patterns using wearable PPG data collected during cardiac rehabilitation. The proposed framework combines temporal deep-learning architectures with a physiologically motivated exponential decay constraint. Strong performance was achieved on an independent patient-level test cohort. The ablation and interpretability analyses further demonstrated the value of incorporating physiological knowledge into the learning process. Early recovery dynamics were also identified as important contributors to HRR classification.
Overall, the findings support the potential of physiological constraint-based deep learning for wearable-based HRR analysis. Further validation in larger and more diverse populations is required. The findings provide a promising direction for future research in intelligent cardiac rehabilitation monitoring.
The Distinguished Research Grant Scheme has funded this work under the university reference number RDU233012. This grant has been conferred by the Research and Innovation Division, Universiti Malaysia Pahang Al-Sultan Abdullah.
|
Acc |
Accuracy, dimensionless |
|
AUC |
Area under the curve, dimensionless |
|
F1 |
F1-score, dimensionless |
|
HR(t) |
Heart rate at time t, bpm |
|
HRpeak |
Peak heart rate, bpm |
|
HRrest |
Resting heart rate, bpm |
|
HRmean |
Mean heart rate, bpm |
|
HRvar |
Variance of heart rate, bpm² |
|
HRdrop |
Heart rate drop, bpm |
|
k |
Exponential decay constant, s⁻¹ |
|
L |
Total loss function, dimensionless |
|
Lclass |
Classification loss, dimensionless |
|
Lexp |
Exponential decay loss, dimensionless |
|
Sens |
Sensitivity, dimensionless |
|
Spec |
Specificity, dimensionless |
|
t |
Time, s |
|
xi |
Input sample, dimensionless |
|
xnn |
Nearest neighbour sample, dimensionless |
|
xnew |
Synthetic sample (ISMOTE), dimensionless |
|
TP |
True positive, dimensionless |
|
TN |
True negative, dimensionless |
|
FP |
False positive, dimensionless |
|
FN |
False negative, dimensionless |
|
Greek symbols |
|
|
λ |
Weighting coefficient in loss function, dimensionless |
|
Subscripts |
|
|
class |
Classification component |
|
exp |
Exponential decay component |
|
i |
Sample index |
|
nn |
Nearest neighbour |
|
peak |
Peak value |
|
rest |
Resting value |
|
pred |
Predicted value |
|
true |
Ground truth value |
[1] Bayoumy, K., Gaber, M., Elshafeey, A., et al. (2021). Smart wearable devices in cardiovascular care: Where we are and how to move forward. Nature Reviews Cardiology, 18(8): 581-599. https://doi.org/10.1038/s41569-021-00522-7
[2] Jamieson, A., Chico, T.J.A., Jones, S., Chaturvedi, N., Hughes, A.D., Orini, M. (2025). A guide to consumer-grade wearables in cardiovascular clinical care and population health for non-experts. npj Cardiovascular Health, 2(1): 44. https://doi.org/10.1038/s44325-025-00082-6
[3] Hughes, A., Shandhi, M.M.H., Master, H., Dunn, J., Brittain, E. (2023). Wearable devices in cardiovascular medicine. Circulation Research, 132(5): 652-670. https://doi.org/10.1161/CIRCRESAHA.122.322389
[4] Islam, T.N., Imtiaz, H. (2024). A robust neural network for privacy-preserving heart rate estimation in remote healthcare systems. Healthcare Analytics, 5: 100329. https://doi.org/10.1016/j.health.2024.100329
[5] Alimbayeva, Z., Alimbayev, C., Ozhikenov, K., Bayanbay, N., Ozhikenova, A. (2024). Wearable ECG device and machine learning for heart monitoring. Sensors, 24(13): 4201. https://doi.org/10.3390/s24134201
[6] Chen, T.H. (2024). Can heart rate sequences from wearable devices predict day-long mental states in higher education students: A signal processing and machine learning case study at a UK university. Brain Informatics, 11(1): 1-18. https://doi.org/10.1186/s40708-024-00243-w
[7] Li, K., Cardoso, C., Moctezuma-Ramirez, A., Elgalad, A., Perin, E. (2023). Heart rate variability measurement through a smart wearable device: Another breakthrough for personal health monitoring? International Journal of Environmental Research and Public Health, 20(24): 7146. https://doi.org/10.3390/ijerph20247146
[8] Alugubelli, N., Abuissa, H., Roka, A. (2022). Wearable devices for remote monitoring of heart rate and heart rate variability-What we know and what is coming. Sensors, 22(22): 8903. https://doi.org/10.3390/s22228903
[9] Saldaña-Aristizábal, L., Rivas-Caicedo, J.L., Niño-Tejada, K., Patarroyo-Montenegro, J.F. (2025). Indirect AI-based estimation of cardiorespiratory fitness from daily activities using wearables. Electronics, 14(15): 3081. https://doi.org/10.3390/electronics14153081
[10] Kundrick, J., Naniwadekar, A., Singla, V., et al. (2025). Machine learning applied to wearable fitness tracker data and the risk of hospitalizations and cardiovascular events. American Journal of Preventive Cardiology, 22: 101006. https://doi.org/10.1016/j.ajpc.2025.101006
[11] Neshitov, A., Tyapochkin, K., Kovaleva, M., et al. (2023). Estimation of cardiorespiratory fitness using heart rate and step count data. Scientific Reports, 13(1): 1-13. https://doi.org/10.1038/s41598-023-43024-x
[12] Kayange, H., Mun, J., Park, Y., Choi, J., Choi, J. (2024). A hybrid approach to modeling heart rate response for personalized fitness recommendations using wearable data. Electronics, 13(19): 3888. https://doi.org/10.3390/electronics13193888
[13] da Silva, S.T., de Godoy, M.F., Gregório, M.L., Viana, R.L., Batista, A.M. (2023). Analysis of heartbeat time series via machine learning for detection of illnesses. Chaos Solitons and Fractals, 171: 113388. https://doi.org/10.1016/j.chaos.2023.113388
[14] Castillo-Aguilar, M., Mabe-Castro, D., Medina, D., Núñez-Espinosa, C. (2025). Enhancing cardiovascular monitoring: A non-linear model for characterizing RR interval fluctuations in exercise and recovery. Scientific Reports, 15(1): 1-14. https://doi.org/10.1038/s41598-025-93654-6
[15] Dogan, A., Bishnoi, A., Sowers, R.B., Hernandez, M.E. (2025). Continuous heart rate recovery monitoring with ECG signals from wearables: Identifying risk groups in the general population. IEEE Journal of Biomedical and Health Informatics, 29(8): 5493-5502. https://doi.org/10.1109/JBHI.2025.3550092
[16] Hyrylä, V.V., Eronen, T., Kupari, S., Venojärvi, M., Tikkanen, H.O., Tarvainen, M.P. (2025). Attenuated fast heart rate recovery suggests delayed parasympathetic reactivation after cessation of exercise in uncomplicated type 1 diabetes patients. Scientific Reports, 15(1): 1-8. https://doi.org/10.1038/s41598-025-09287-2
[17] Kaikkonen, P., Pasanen, K., Parkkari, J., Mustakoski, I., Vasankari, T., Leppänen, M. (2025). Recovery of heart rate and heart rate variability after a maximal cardiopulmonary exercise test in novice female runners. European Journal of Applied Physiology, 125(1): 71-79. https://doi.org/10.1007/s00421-024-05580-6
[18] Kitagaki, K., Hongo, Y., Futai, R., Hasegawa, T., Morikawa, H., Shimoyama, H. (2025). Validity of heart rate measurement using wearable devices during cardiopulmonary exercise testing in patients with cardiovascular disease: Prospective pilot validation study. JMIR Cardio, 9(1): e77911. https://doi.org/10.2196/77911
[19] Boussen, S., Benard-Tertrais, M., Ogéa, M., et al. (2024). Heart rate complexity helps mortality prediction in the intensive care unit: A pilot study using artificial intelligence. Computers in Biology and Medicine, 169: 107934. https://doi.org/10.1016/j.compbiomed.2024.107934
[20] Hannan, A., Cheema, M.S., Pires, I.M. (2024). Machine learning-based smart wearable system for cardiac arrest monitoring using hybrid computing. Biomedical Signal Processing and Control, 87: 105519. https://doi.org/10.1016/j.bspc.2023.105519
[21] De Sabbata, G., Simonini, G. (2025). Real-time forecasting from wearable-monitored heart rate data through autoregressive models. Journal of Healthcare Informatics Research, 9(2): 154-173. https://doi.org/10.1007/s41666-025-00191-y
[22] Lee, H., Yang, H.L., Ryu, H.G., et al. (2023). Real-time machine learning model to predict in-hospital cardiac arrest using heart rate variability in ICU. npj Digital Medicine, 6(1): 1-10. https://doi.org/10.1038/s41746-023-00960-2
[23] Cheng, R.B., Haste, P., Levens, E., Bergmann, J. (2024). Feature importance for estimating rating of perceived exertion from cardiorespiratory signals using machine learning. Frontiers in Sports and Active Living, 6: 1448243. https://doi.org/10.3389/fspor.2024.1448243
[24] Estrella, T., Capdevila, L. (2025). Identification of athleticism and sports profiles throughout machine learning applied to heart rate variability. Sports, 13(2): 30. https://doi.org/10.3390/sports13020030
[25] Rothschild, J.A., Stewart, T., Kilding, A.E., Plews, D.J. (2024). Predicting daily recovery during long-term endurance training using machine learning analysis. European Journal of Applied Physiology, 124(11): 3279-3290. https://doi.org/10.1007/s00421-024-05530-2
[26] Mutlu, A., Doğan, Ş., Tuncer, T. (2025). Artificial intelligence in electroencephalography: A comprehensive survey of methods, challenges, and applications. Acadlore Transactions on AI and Machine Learning, 4(3): 186-218. https://doi.org/10.56578/ataiml040304
[27] Banerjee, A., Salian, R.S., Vemulapalli, H.S., et al. (2025). Enhancement of stress ECG performance with machine learning: A single-center study. JACC: Advances, 4(10): 102141. https://doi.org/10.1016/j.jacadv.2025.102141
[28] Liang, H.Y., Hsu, K.C., Chien, S.Y., et al. (2025). Deep learning analysis of exercise stress electrocardiography for identification of significant coronary artery disease. Frontiers in Artificial Intelligence, 8: 1496109. https://doi.org/10.3389/frai.2025.1496109
[29] Guo, Y., Xia, C.X., Zhong, Y., et al. (2023). Machine learning-enhanced echocardiography for screening coronary artery disease. Biomedical Engineering Online, 22(1): 1-19. https://doi.org/10.1186/s12938-023-01106-x
[30] Du, Z.Z., Wang, S., Yang, O.Z., et al. (2024). Machine-learning-based prediction of cardiovascular events for hyperlipidemia population with lipid variability and remnant cholesterol as biomarkers. Health Information Science and Systems, 12(1): 51. https://doi.org/10.1007/s13755-024-00310-w
[31] Rehan, I., Rehman, M.U. (2025). Cardiovascular risk prediction in diabetes: A hybrid machine learning approach. Biomedical Physics and Engineering Express, 11(6): 065016. https://doi.org/10.1088/2057-1976/ae103a