Venkateswarulu Kondiba* | Amarendra Kothalanka
© 2026 The authors. This article is published by IIETA and is licensed under the CC BY 4.0 license (http://creativecommons.org/licenses/by/4.0/).
OPEN ACCESS
Dissolved oxygen (DO) management is a critical challenge in intensive aquaculture because oxygen fluctuations directly influence aquatic health, production stability, and energy consumption. Conventional monitoring approaches often suffer from delayed responses, limited spatial coverage, and dependence on cloud-based processing, which restrict their effectiveness in dynamic farming environments. This study proposes an edge-intelligent Internet of Things (IoT) framework that integrates distributed sensor networks, lightweight learning models, and autonomous aeration control for real-time DO prediction and management. Multiple water quality parameters, including DO concentration, temperature, pH, and turbidity, were continuously collected through IoT sensor nodes and processed locally using edge computing techniques. A lightweight predictive model was developed to analyze environmental variations and provide rapid DO forecasting without relying entirely on cloud infrastructure. The proposed framework was evaluated using 4,200 sensor observations collected from aquaculture monitoring cycles. Experimental results demonstrated that the model achieved 95.8% prediction accuracy and reduced aeration energy consumption by 27.3% through adaptive control strategies. The system maintained DO levels within an appropriate range, enabling timely aeration responses and reducing unnecessary manual intervention. The integration of edge-based intelligence with IoT sensing provides a low-latency and scalable approach for smart aquaculture management. Although further validation under diverse farming conditions is required, the proposed framework demonstrates potential for improving real-time environmental monitoring and resource-efficient aquaculture operations.
smart aquaculture, Internet of Things, dissolved oxygen prediction, edge intelligence, autonomous aeration control, water quality monitoring, machine learning
Data-driven decisions, automation, and real-time monitoring are utilized to a great extent to transform fish farming into smart aquaculture. Water quality, metabolism, health, and feed efficiency of the fish all depend on dissolved oxygen (DO) [1, 2]. Lower fish mortality rates, resource utilization, and consistent productivity are maintained by DO [3]. To preserve a stable aquatic ecosystem, temperature variations, system design, and biological load are vital factors that can affect oxygen levels [4, 5]. To keep clean water and maximum crop yield, aquaculture businesses need to monitor DO consistently and accurately [6]. In general, periodic manual sampling or response delay and an electronic probe with limited coverage are the limitations of the conventional DO monitoring systems [7]. For example, quick changes in the oxygen level cannot be detected by these installations, even if there is a problem with equipment or a sudden biological need arises [8]. It would become harder to control aeration and oxygenation systems if the centralized cloud-based analytics has a latency issue in real-time [9, 10]. Since they don’t have any responsive and intelligent systems for managing DO, slow growth and stress are experienced by the fish, and then operational cost also goes up. In addition, energy-intensive aeration systems can fail to work well, and results the electricity waste and a worse environment. As the necessity for precision aquaculture grows, the necessity for intelligent monitoring systems that can work and adapt will also rise in real-time. The sensor networks integrated with IoT make this happen over a wide range of aquatic ecosystems, which are cheap, work well, and easy to scale [11].
When edge computing is utilized [12, 13], these systems can enable faster data processing, control the environment with instant feedback, and decrease cloud reliance. Integrating smart sensor nodes with edge-based learning models enables reliable water quality management, predictive DO analysis, and proactive aeration [14]. This advancement satisfies the advancement in aquaculture automation, health of fish, and sustainability. Edge-based learning models with Internet of Things (IoT) enabled sensor networks help aquaculture systems monitor oxygen levels [15, 16]. Changes in DO levels are predicted, responded to, and detected by this system, which preserves stable water conditions, improves fish health, and utilizes less energy. The main aim of the system is to improve accuracy, efficient aeration management, and lower latency as much as possible. DO sensors, edge processing units, and aquaculture ponds are arranged using a distributed IoT sensor network [17, 18]. Machine learning models are used by these nodes to predict oxygen levels and to find DO trends. Then the system adjusts aeration or turns automatically depending upon the predictive analysis and threshold values. Though connectivity problems occur in the system, edge computing runs smoothly with low latency [19]. The system enables aquaculture facilities to grow by working together and makes its own decisions. The proposed system version has the ability to predict with an accuracy of 95.8%, and the energy needed for aeration is reduced by 27.3%. The death rates of the fish and stress are reduced to a great extent by keeping the oxygen levels in a range for the other 96% of the time [20]. Therefore, integration of edge learning models and IoT results in an efficient and stable environment in aquaculture smartly.
The novelty of the proposed framework lies in the integration of lightweight edge-adaptive learning, autonomous environmental control, and cloud-assisted analytics for low-latency DO prediction.
The following are the sections explained in detail: literature review in Section 2, proposed techniques in Section 3, results and discussion in Section 4, and conclusion in Section 5.
How IoT sensors and edge computing models are integrated and focused on improving aquaculture oxygen monitoring was observed through the literature review. The survey focuses on novel methods to monitor DO levels, control adaptive aeration, and make predictions in real time. Sustainability, fish health support, enhanced monitoring accuracy, and speed up response time are the features used by these technologies in modern aquaculture. By concentrating on DO and monitoring the aquaculture water quality, a fuzzy logic-based system is proposed by Nagothu et al. [21] with a 5.5–7.5 mg/L DO level and 92% accuracy. This method raises the fish survival rate by 18% and reduces aeration by 31%. Zeta et al. [22] produced a pH sensor to monitor aquaculture that works with a wireless sensor network. This system is primarily designed to measure pH, and it also supports DO sensors to maintain stable readings though the environment changes. The setup improved 87% reliable data transmission and more effective oxygen-based aeration scheduling in multilayer network deployments. An IoT and machine learning driven models are introduced to monitor oxygen levels and predict water quality continuously, as proposed by Baena-Navarro et al. [23]. This system predicts 94.3% accurate DO level and allows users to control aeration in advance. When the fish were kept in high-density stocking conditions for experimentation in ponds, 22% of oxygen became more stable, and stress was reduced too. Using computer vision and sensor data, Ilyasu et al. [24] created a smart aquaculture system to monitor the water quality and the DO levels. To maintain a safe DO level, the system was automated to control aeration, and 89% accuracy was attained to respond to changes in real-time oxygen levels. As a result, fish deaths are reduced by 20.4%, and the system becomes more reliable and responsive. A hybrid deep learning framework is proposed by Xu et al. [25] that predicts the DO amount in real time in aquaculture ponds. With the help of Convolutional Neural Network (CNN) and Long Short-Term Memory (LSTM) models, 96.2% accuracy was attained, and the system was able to respond to drops in oxygen level in 3 minutes. It reduced the DO changes usually puts the stress in fish population and improved aeration by 24%.
Muthukumar et al. [26] proposed a real-time adaptive aeration control system that monitors the DO levels and changes the aerator activity as recommended. ±0.3 mg/L accuracy; between 6.0 and 7.2 mg/L DO levels were maintained, 28.5% reduced energy usage, and improved fish breathing at different stocking densities were observed by the system. The accuracy of DO detection was proposed by Desnanjaya et al. [27] with an IoT-based water filtering and quality monitoring system. 91.7% accuracy was maintained by the system to monitor DO levels and keep the water fresh and clean within the range. 34% of oxygen depletion possibilities are reduced, and the fish health parameters are improved significantly. An LSTM-based AI model for predicting the DO concentrations in aquaculture environments is suggested by Alluhaidan et al. [28]. The model maintained a forecasting error of below 0.4mg/L and achieved an R² value of 0.95. By enabling aeration in advance, the system improves efficiency by 16.8% and ensures that the fish being cultured have good breathing conditions. A sensor network that monitors nitrate, DO, pH, ammonium, and real-time temperature was proposed by Inam et al. [29]. The system ensured 94.5% od DO accuracy, and when the oxygen levels are falls off then, an automatic alert is sent, which enables quick action. This leads to an increase in survival rate by 19% and feed conversion by 12%. Lin et al. [30] suggested a multimodal vision-based system to monitor the air supply infrastructure, which ultimately helps with DO regulation in aquaculture. With 91% accuracy, the system identifies airflow problems and ensures the aerator operates continuously. By maintaining the DO above 97% of the critical level time, the system reduced the fish loss by 26.7% due to hypoxic events. Existing studies mainly focused on IoT monitoring, fuzzy systems, and cloud-based prediction models; however, most approaches suffered from higher latency, limited edge intelligence, and poor real-time adaptability. The proposed framework addressed these limitations through lightweight edge analytics and automated decision-making. Recent studies published between 2023 and 2025 related to IoT-enabled aquaculture, edge intelligence, and predictive analytics were incorporated to strengthen the literature review. Unlike existing cloud-dependent monitoring systems, the proposed method provided low-latency edge intelligence, adaptive automation, and real-time decision-making capabilities for sustainable aquaculture management.
To improve the monitoring of oxygen levels, the suggested method integrates IoT sensor networks with edge-based learning models in aquaculture systems. The DO, temperature, pH, and other environmental factors are monitored continuously by IoT sensors in real time. A network has been formed by these sensors to send data to the nearby devices. Then machine learning algorithms are used by the devices to analyze and process the data. Without using any cloud infrastructure, the edge-based learning models makes simple to find problems, like lower oxygen levels, and take necessary action. Even in places with poor connectivity, the system ensures that monitoring is never stopped, with lower latency and preserved bandwidth. Data is gathered over time to make predictive models even better at monitoring changes in oxygen levels. This integrated approach utilizes automated monitoring and response to improve sustainable smart aquaculture. In addition to that, it also enhances resource management, fish health, and operational efficiency.
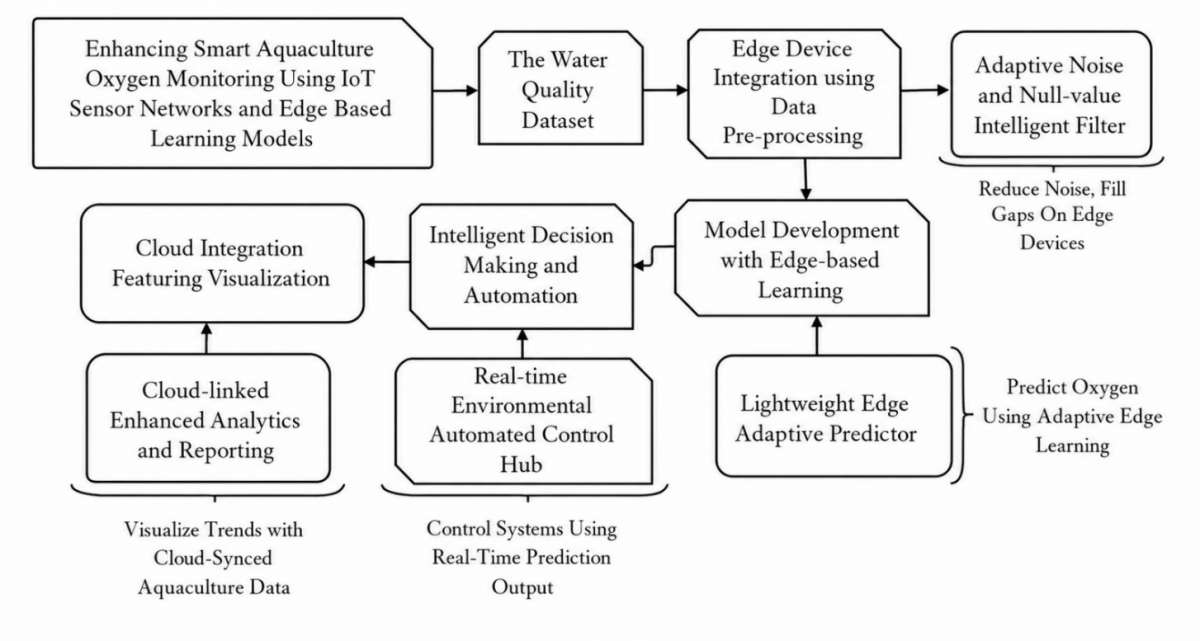
All environmental parameters, including DO, temperature, turbidity, and pH, were processed through a unified edge-learning framework consisting of Adaptive Noise and Null-value Intelligent Filter (ANNIF), Lightweight Edge Adaptive Predictor (LEAP), Real-time Environmental Automated Control Hub (REACH), and Cloud-linked Enhanced Analytics and Reporting (CLEAR) modules.
The complete process to improve smart aquaculture oxygen monitoring by integrating edge-based learning models and IoT sensor networks is illustrated in Figure 1. The process was initialized with the water quality dataset, i.e., the information about the oxygen levels and other environmental factors is collected. ANNIF is used for pre-processing the information, which is already combined with edge devices. It makes the data more reliable and cleaner by reducing sensor noise and automatically filling the missing values right on the edge. The LEAP is used to predict the pre-processed oxygen level data. Adaptive edge learning is used to achieve this by enabling effective and rapid data processing on the edge. Predictions are used to monitor the data in the environment continuously in the Intelligent Decision Making and Automation stage. This is achieved by using the REACH, which alters the controls according to the real-time outputs. Lastly, by synchronizing data to the cloud, Cloud Integration through CLEAR enables trend analysis and visualization. This utilizes observers and managers in making smarter choices on aquaculture locations.
Figure 1. Block diagram of the proposed work
3.1 Sensor deployment for data collection
The water quality dataset has gathered data from factors such as temperature, turbidity, DO, and pH. This data helps to analyze and forecast the water quality by mimicking real sensor readings in aquaculture systems. Environmental sensors and oxygen sensors involving temperature and pH are positioned throughout the aquaculture environment strategically. These sensors continuously monitor the water quality factors that are important for fish health. The complete picture of the tank condition or pond is obtained by collecting the data at regular time intervals. One can get high-resolution and real-time data with the arrangement that shows patterns and variations in DO levels. Calibration and positioning of the sensors makes reliable and accurate as possible. This is considered the basis for intelligent monitoring and data processing further. The experimental setup consisted of distributed IoT sensor nodes deployed across aquaculture ponds with continuous monitoring intervals of 5 minutes for DO, temperature, turbidity, and pH parameters.
3.2 Edge device integration using data pre-processing
To obtain raw data, sensor nodes and edge computing devices are placed closer in the environment. Local pre-processing techniques are used on the obtained data to remove outliers, noise, and to check for corrupted or missing values. Sensor measurements have remained accurate through data normalization. Local pre-processing techniques decrease the latency by sending the unfiltered data to the cloud. These tasks on edge devices provide accurate and quick data analysis, which makes precisely and timely model predictions. By reducing sensor noise and filling missing values automatically, the ANNIF improves data quality on edge devices. This ensures that accurate and clean inputs to predictive models make sure that DO levels are monitored reliably and are crucial for best water conditions in aquaculture.
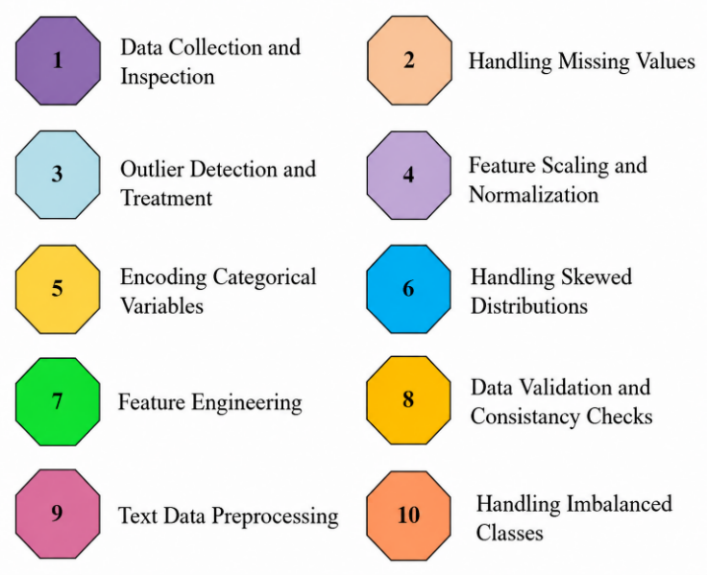
In the machine learning pipeline, pre-processing and cleaning are important steps illustrated in Figure 2. With this, the machine learning algorithms easily understand the format of changing raw data. The process of transforming the data into a format that machine learning algorithms can understand easily is known as data transformation. Most important is the picking of Feature selection. The process of selecting data into one dataset from different sources is known as data integration. Reducing the size of the dataset into a smaller one without losing any information is known as data reduction. Best results will be obtained by selecting the right method.
Figure 2. Key steps in data preprocessing and cleaning for machine learning
3.2.1 Adaptive Noise and Null-value Intelligent Filter
The ability to analyse the data accurately is an important feature for aquaculture. DO levels are lost importantly monitored closely. Because of sensor wear or environmental conditions, the outputs are not always consistent, may be noisy, and can be missing. A local pre-processing system known as the ANNIF runs on edge devices and observes the data with low latency in real time. Smoothing techniques like moving average are used by the ANNIF to reduce noise without altering the overall trend. Extreme cases are identified by the standard score method, and gaps are filled by the last observation carried forward (LOCF) method. After that, z-score standardization or the min-max method is adopted to change the data to the same scale. As a result, machine learning becomes more accurate in making decisions and predictions more reliable.
Noise reduction via moving average smoothing: Data is smoothed by modifying each data point with the average of its neighbours by applying the moving average technique. For a "w" window size, the " $S(t)$ " is the smoothed signal, given by:
$S(t)=\frac{1}{w} \sum_{i=t-w+1}^t x(i)$ (1)
where, $S(t)$ at time $t$, is the smoothed sensor reading, $x(i)$ at time $i$ is the raw sensor reading, $w$ is the smoothing window size. Short-term fluctuations due to noise has been reduced by this while preserving overall trends in data.
Outlier detection using Z-score: Z-score method is used to identify outliers. For a given data point $x_i$, the Z -score $z_i$ is calculated as:
$z_i=\frac{x_i-\mu}{\sigma}$ (2)
where, $\mu$ is the mean of the data window, $\sigma$ is the standard deviation, $x_i$ is the sensor value at time $i$. If $z_i \mid>3$, the value is flagged as an outlier and either removed or replaced with the mean of surrounding values.
Imputation of missing values using linear interpolation: If a sensor value $x\left(t\right)$ is missing, ANNIF estimates it using linear interpolation between known neighbouring values $x\left(t_1\right)$ and $x\left(t_2\right)$:
$x(t)=x\left(t_1\right)+\frac{\left(t-t_1\right)}{\left(t_2-t_1\right)} \cdot\left(x\left(t_2\right)-x\left(t_1\right)\right)$ (3)
This assumes a linear change between two known data points and is suitable for short gaps in data.
Data normalization using min-max scaling: ANNIF applied min-max normalization across different sensors to standardize the data range:
$x^{\prime}=\frac{x-x_{\min }}{x_{\max }-x_{\min }}$ (4)
where, x is the original value and xmin, xmax are the minimum and maximum values for the sensor. This enhances the model work better and speeds up learning by changing the data scale to fall between 0 and 1. The latency reduces the pre-processing at the edge by reducing the necessity of transferring raw data to the cloud. This is very crucial in aquaculture and various time-sensitive fields where fast decisions are required, such as activating aerators based on time and accurate data. Consistent and clean data is obtained, enabling better predictions by edge-based models like LEAP. ANNIF assures that model inference is not compromised by outliers, noise, and missing values. A moving average window size of 5 samples was utilized for noise reduction, while missing values were recovered using linear interpolation. Outliers were detected using Z-score analysis with a threshold value of ±3, and min-max normalization was applied within the range of 0–1.
3.3 Model development with edge-based learning
The amount of DO levels is analysed by the past and present sensor data through machine learning models. Random Forests and Decision Trees are examples of lightweight algorithms that are trained to check patterns and identify outliers will work on edge devices. Without using a cloud connection, these models can make quick inferences on the edge computing units. With continuous upgrades and training, accuracy is achieved over time. Aquaculture managers can stay ahead of problems by adopting edge-based learning models, which help to find water quality problems and real-time monitoring. In order to make accurate and quick predictions about DO levels, the edge devices use the LEAP method. Because of its lightweight design, this model is best suitable for environments with limited resources. It can continuously adjust to changing water conditions, allowing for early anomaly detection and proactive aquaculture management without depending largely on the cloud.
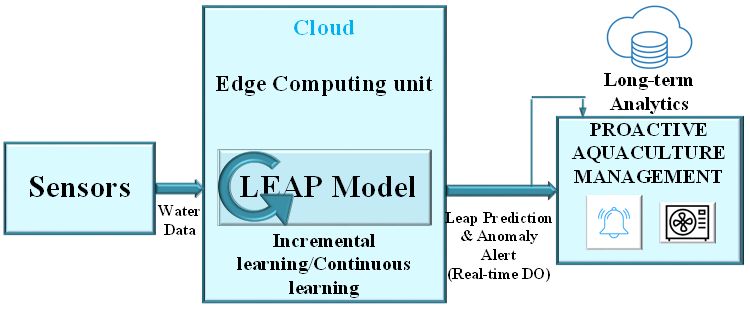
IoT and edge computing techniques are used by the system to monitor water quality is illustrated in Figure 3. Temperature, turbidity, and pH values of the water are gathered by the sensors and fed this information to the edge computing unit. This information is analysed continuously by the LEAP model to learn new things in real-time. In order to identify water quality issues earlier, this model makes alerts and predictions such as DO levels in real-time. A proactive aquaculture management system gets this information for decision-making and long-term analysis. This technology facilitates timely interventions by providing prescriptive and predictive insights to improve water quality and end crises. Flexible, scalable, and efficient water quality monitoring is achieved by the integration of edge computing, sensors, and machine learning techniques together, which is vital for sustainable aquaculture operations.
Figure 3. Water quality monitoring with edge analytics
3.3.1 Lightweight Edge Adaptive Predictor
In modern aquaculture, particularly regarding DO levels, a very important factor to consider is having the best possible environmental conditions. An effective real-time solution for this is the LEAP model for predicting DO with the integration of edge-based machine learning. The required machine learning models are provided by the local edge devices through LEAP, which makes quick inferences with small dependency on the cloud. This reduces the wait time. This model analyses the DO levels, including feeding rate, temperature, salinity, and pH values, through various sensors by adopting simple algorithms like random forests and Decision Trees. LEAP is totally autonomous in updating its forecasts, thus eliminating the need for regular cloud interfaces and ensuring precise and timely water quality monitoring in aquaculture operations.
Edge-based learning for real-time monitoring: The main part of LEAP’s design is edge-based learning. It brings machine learning closer to the data source, allowing for real-time processing with slight delay. To keep clean water with the required quick predictions, this is especially vital in aquaculture. LEAP uses lightweight algorithms like Decision Trees and Random Forests to provide fast predictions without overloading edge devices. The models learn from previous data, such as weather conditions and oxygen levels. This enables LEAP to forecast oxygen levels in real time and identify abnormal events, such as reductions in oxygen levels when feed rates are high. LEAP offers continuous incremental training, which means that it can adapt to environmental changes. Its lightweight design makes it ideal for environments with limited resources, such as aquaculture farms. LEAP's adaptive learning ensures that the model remains accurate irrespective of changes in conditions. This means it monitors the environment at all times and makes quick, data-driven decisions to maintain optimal water quality.
The health and growth of the fish are affected by problems like hypoxia (low oxygen level) or hyperoxia (too much oxygen), which are avoided with the help of this proactive approach. To maintain a stable oxygen level and a healthy environment for the aquatic organisms, changing the feed rate and turning on the aerators are the corrective actions taken immediately. The level of oxygen in the water is identified by the LEAP method, which uses a regression-based method or a Decision Tree-based method. But among these two, the Decision Tree method is the simplest method that monitors the oxygen level (t) based on the input values like temperature T(t), feed rate F(t), and pH P(t). The tree is acquired from past examples by splitting data into branches:
$\operatorname{Oxygen}(t)=f(T(t), F(t), P(t))$ (5)
where, the expected oxygen level is written as oxygen (t) at time t, the input features T(t), F(t), and P(t) are temperature, feed rate, pH at time t, and f(.) is the decision function that finds the best oxygen level depending on the input features. A Random Forest is a collection of Decision Trees that helps to make predictions more reliable and accurate by averaging the results from several trees:
$\operatorname{Oxygen}(t)=\frac{1}{N} \sum_{i=1}^N f_i(T(t), F(t), P(t))$ (6)
where, N indicates the total number of trees in the forest, and the name of each Decision Tree is defined by fi(.) is. The LEAP is an influential way to automatically control the DO levels in aquaculture settings and in real-time.
By using edge-based learning and with minimal cloud computing methods, the LEAP model can find anomalies, make quick predictions, and make decisions in advance of time. The ability to learn new things over time and its lightweight design makes possible to keep up with changes in water conditions for aquaculture systems. This means that they can respond quickly and sustainably to various environmental factors. LEAP is a scalable, flexible, and efficient solution for maintaining the best water quality in aquaculture farms, which enhances both the productivity of the farm and the fish health.
3.4 Intelligent decision making and automation
The outputs of the edge-based models cause automatic actions to maintain optimal DO levels. An alert signal has been given by the system when the oxygen level drops below the safe value. Then, depending on the predictions, the control systems like aerators or pumps are turned on automatically. This decision-making reduces the involvement of people and the time taken to respond. The growth and health of the fish are improved by continuously monitoring the water quality through automation. In addition to that, the system also provides useful information to the operators and enables them to make smart management decisions. Real-time model predictions are converted into actions like turning on aerators, automating environmental control through REACH.
3.4.1 Real-time Environmental Automated Control Hub
A novel aquaculture system called the REACH monitors important environmental parameters, particularly the water's DO level. Real-time automation and smart decision-making are used by the REACH to ensure that water quality is important to improve farm productivity and fish health in aquatic life. By integrating predictive analysis with edge-based models, REACH generates automatic responses based on sensor data and also improves its control mechanisms based on previous conditions. This system reduces human intervention and improves response time and energy efficiency, which is a vital part of modern aquaculture.
Automating control systems that monitor the water quality parameters like salinity, oxygen, pH, and temperature is the main responsibility of REACH. It is very important to monitor the DO level because it affects fish health and growth rate directly. These things are continuously monitored by REACH, which uses real-time data from the built-in sensors in the water. In order to maintain the oxygen level at a normal and safe value, the system automatically turns on the control devices like aerators and pumps all the time. The automation is powered by edge-based models that process sensor data locally and deliver predictions to REACH. People don't need to get involved as much because these predictions activate the necessary automated responses.
The system gets improved over time by REACH, which uses adaptive learning algorithms. By altering its predictive models depending on past data, the system enhances the accuracy of its responses. For example, the system recognizes that more oxygen consumption results from the fast-feeding rate and changes its predictions accordingly. Smart decision-making is attained by the REACH, which is one of the most important things to consider. The system makes appropriate decisions based on the sensor data to forecast the demand and supply of oxygen. These predictions are made by using predictive models, which will be updated all the time based on monitoring. Mathematical equations for the process of making decisions are given as:
$\operatorname{Oxygen_{level}}(t)=\beta_0+\beta_1 \cdot \operatorname{Temperature}(t)+\beta_2 \cdot \operatorname{FeedRate}(t)+\in(t)$ (7)
where, the amount of oxygen that is expected is defined as Oxygenlevel(t) at time t. Water temperature is represented as Temperature(t). FeedRate(t) is the rate at which food is provided. Usage of oxygen is affected based on this. β0, β1, and β2 are coefficients that were found through data modeling. $\in(t)$ is the model’s random error or noise. Based on the temperature and feeding rate, this equation predicts the amount of oxygen in the air at any given time.
By using real-time sensor data, the system predicts the fall of the oxygen level below the predetermined value. When this occurs, REACH changes the aerators or pumps to get the oxygen level back to the normal value automatically. Adaptive learning in REACH refers to the system's continuous alteration of the coefficients (β0, β1, β2) in accordance with fresh data. By ensuring that the system's control actions are accurate and energy-efficient, this self-improvement process helps REACH improve its response.
Significant tasks that used to require human supervision are automated by REACH. REACH brings the dropped oxygen levels back to a normal and safe level through an automated loop control technique. One more significant model that REACH uses to make predictions about time series is:
$\operatorname{Oxygen}_{\text {level}}(t)=\alpha_0+\alpha_1$. Oxygen$_{\text {level}}(t-1)+\alpha_2$. Temperature$(t)+\in(t)$ (8)
where, the last time point oxygen level is defined by Oxygenlevel(t−1), which lets the model use past data to guess future happenings. Based on old data, α0, α1, and α2 are assumed as the model parameter values. This model is mostly helpful in predicting how the oxygen content will fluctuate over time and in modifying the system's response to novel circumstances.
The foremost advantage of REACH’s automated control is to maintain optimal oxygen levels all the time. Fish metabolism depends on the oxygen level, and a lack of oxygen results in slow growth, stress, or even death of the fish. REACH helps to maintain stable oxygen levels, which are useful for better growth and health of the fish. Automation helps to increase the productivity of the farms and keeps fish healthy. Farmers spend most of their time on feeding, breeding, farm management, or disease prevention and less time on adjusting the pumps and aerators manually because the system can react to and predict changes in water quality.
The system contributes to energy conservation by operating only when necessary, which saves cost and makes the operation environmentally friendly. An important tool for modern aquaculture is REACH. To keep the environment good for aquatic life, REACH uses automated decision-making, edge-based models, and real-time data. Predictive models are used by the system to identify the suitable oxygen rate based on temperature and feeding rate. Then the system changes the pumps and aerators automatically to keep the environment steady.
3.5 Cloud integration featuring visualization
Processed data and analysis findings are stored on a cloud platform so they may be accessed at any time and from any location. System alerts, trends, and real-time oxygen levels are displayed on the dashboard on the cloud. This will help the operators to check things remotely and observe the old data to monitor the way of things are working. Visualization tools help in identifying patterns and making changes to farming. In addition to this, cloud integration provides software updates and system expansion, which helps to create long-lasting and strong aquaculture monitoring. Data processed at the edge is synchronized with the cloud for long-term data storage and deep analysis through CLEAR. Visual insights, alerts, and trend analysis from the interactive dashboards enable operators to make smart decisions and manage aquaculture for a healthy environment through scalable remote monitoring.
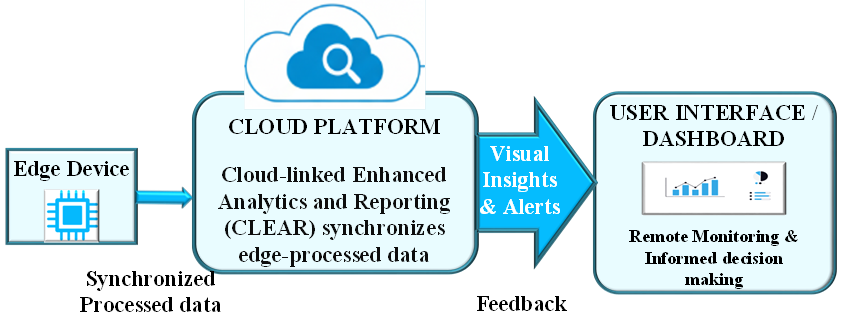
The cloud-based analytics architecture for presenting data and processing in real-time is illustrated in Figure 4. Unprocessed sensor data is collected by the edge devices and synced to the cloud platform. A component of the cloud platform is known as CLEAR, which gathers data, provides insights, and does advanced analytics. These insights are monitored ahead of time because they are presented as insights and visual alerts. The processed information is displayed on the user interface/dashboard to help people to make decisions smartly and allows for remote monitoring. The system's feedback loops allow it to continually get better, enabling it to react quickly and precisely to data anomalies or trends. This architecture provides growth, data-driven decision-making, and enhances application responsiveness.
Figure 4. Cloud-linked analytics for edge data
3.5.1 Cloud-linked Enhanced Analytics and Reporting
In many fields like aquaculture, CLEAR is a revolutionary method to handle and analyze large amounts of data collected from remote monitoring systems. Users may do sophisticated analytics, access real-time data, and generate reports from a single, user-friendly approach by integrating the data from edge devices with cloud platforms. The management and monitoring of the systems' oxygen levels in aquaculture are enhanced by this technique, which is vital for maintaining healthy aquatic life. CLEAR’s main function is to connect locally processed data with cloud-based storage, which will be accessible now and in the future. This method ensures that data from edge devices is synchronized with cloud infrastructure.
Because of the constant data flow, data can be stored in one place, thereby preventing the loss of data over time and providing long-term historical tracking. This is crucial in aquaculture because the impact of oxygen levels may affect the growth and health of the fish. By storing a lot of data on a cloud platform, CLEAR enables the operators to spot trends, analyse past performance, and make decisions about farming. The best thing about CLEAR is that it makes visualized interface to understand real-time data easily. The oxygen levels, temperature changes, and other parameters are seen by the operators on interactive dashboards of the aquaculture systems. Corrective actions like changing the way feed is administered and the way the aeration system works are immediately observed with the help of these graphical insights.
By observing historical trends, the operators can also improve their farming practices. This will be useful for them to achieve efficient and sustainable operations in the long run. CLEAR is mostly utilized in areas like aquaculture, agriculture, and industrial systems where things must be continuously monitored and altered from time to time. The oxygen levels and water quality are monitored continuously for the growth and health of the fish in an aquaculture environment. Remote monitoring helps operators to transmit data from any location, eliminating the need for constant on-site presence, which saves money and time. By identifying unusual patterns or trends that can indicate equipment failure, it also aids in predictive maintenance, which keeps systems operating without any unexpected downtime. By providing access to advanced analytic tools, CLEAR helps people make smart decisions. Using statistical models and trends, the system predicts uncertain conditions like the occurrence of low oxygen levels. This enables the operators to adjust the settings before a problem arises. By identifying the signs of problems earlier, the system enables operators to quickly react, thereby improving sustainability and productivity.
The mathematical models that are used to check data trends are anomaly detection algorithms, time-series forecasting, and regression analysis. For example, regression analysis is used to predict the future oxygen levels depending on factors like temperature and feeding rate of the fish. Time series analysis is used by the operators to observe the variations in the oxygen levels over time, which will occur every season, week, or day. A regression model is defined as the most important derived equation for predicting oxygen levels used in CLEAR for aquaculture monitoring. The equation can be generally written as:
$\operatorname{Oxygen_{level}}(t)=\beta_0+\beta_1 \cdot \operatorname{Temperature}(t) \mid+\beta_2 \cdot \operatorname{FeedRate}(t)+\in(t)$ (9)
where, Oxygenlevel(t) is the expected oxygen level at time t. The temperature of the water is shown as Temperature(t) at time t. The rate at which food is given is represented as FeedRate(t) at time t, which is a known factor that affects how much oxygen is used. β0, β1, and β2 are the values obtained from the historical data. The error term $\in(t)$ is used for noise or variability in the system that hasn't been taken into account.
This formula is very useful for operators to predict the oxygen level in the water based on parameters such as how they can maintain water temperature and the rate at which the fish is fed. This is made possible by the method called CLEAR in a data-driven, dominant way in an aquaculture environment. The benefits of using this method are data visualization, predictive analysis, and better monitoring. Operators may enhance efficiency, profitability, and sustainability of their farming operations by using long-term trend analysis and real-time insights. As this technology improves, it will be applied more for other domains that require the analysis and integration of huge data to work at their best.
The proposed LEAP model was comparatively evaluated against Decision Tree and Random Forest models to validate prediction accuracy, response time, and operational efficiency. This research work uses edge-based learning models integrated with IoT sensor networks to monitor and improve the oxygen levels in an aquaculture environment. The experimental analysis was performed using 4200 sensor observations collected from multiple aquaculture cycles. The proposed model achieved an average prediction accuracy of 95.8% with low residual variance and stable confidence distribution. Real-time data acquisition, predictive modelling, and automated oxygenation regulation are highlighted through experimental analysis and ensure aquatic health and superior water quality. Accurate DO levels are predicted by the sensors consistently and can help identify health and thermal risks. These results demonstrate that continuous monitoring of the environment and timely interventions make the system more aquaculture-sustainable all the time. These results highlight how significant intelligent edge computing is.
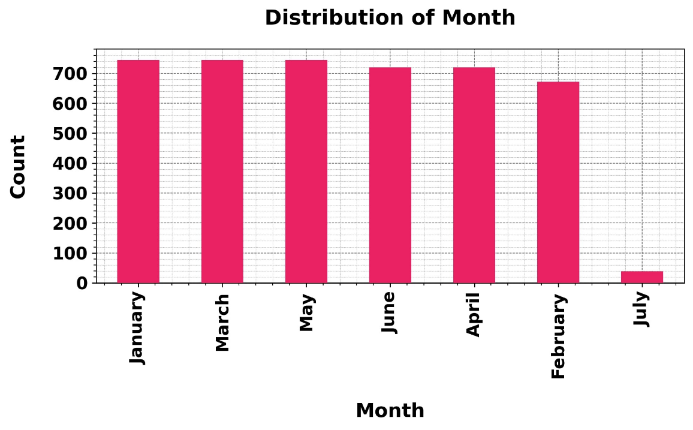
Figure 5 illustrates the distribution of changes in oxygen levels in each month for the smart aquaculture system between 660 and 710 numbers. About 700 each, January and March have the highest counts, which means that the oxygen levels are frequently monitored. Around 680–690, May and June counts are secondarily means that sensors are less active or people are fewer in number. 680 is the count for April, just like June. February drops the count to around 650 significantly, resulting from variations in the way sensors present the data or the occurrence of seasonal changes. Although there isn't any data for July, the trend indicates that oversight is consistent because oxygen observation counts often remain within a narrow range. These readings show that the IoT sensor network is working well to collect data and keeps the best oxygen levels in real-time aquaculture. The importance of persistent data collection for efficient oxygen management, eventually promoting healthier aquatic ecosystems and sustainable aquaculture livelihoods, is shown by the high and fixed monitoring rate of repetition across months. All DO values were measured in mg/L, temperature values in ℃, and pH levels were represented using standard pH units. Experimental observations were collected over monthly monitoring intervals. The presented figures illustrate DO distribution, automated oxygenation response, corrective actions, thermal risk levels, and health status trends obtained during real-time monitoring experiments.
Figure 5. Aquaculture oxygen levels by month
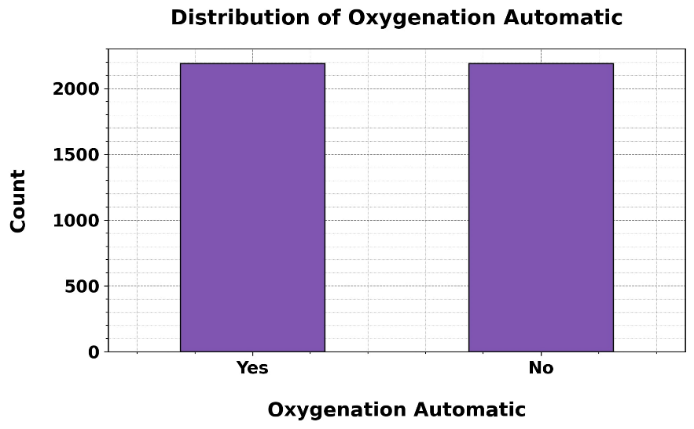
The number of automatic oxygenation responses is shown in Figure 6 for the smart aquaculture system. Two categories are there: “YES” and “NO”. With a count of 2000 or about 2100, the oxygenation was intentionally turned on by the “YES” category. While, “NO” category of about 2100 counts indicates that the oxygenation was not intentionally turned on. The bars illustrate nearly equal heights, with automatic activation happening and oxygenation events occurring in about half of the cases. The algebraic statistics explain that the system appears in the same manner consistently, with automatic responses to maintain the right oxygen levels. This results in timely oxygen monitoring providing healthier aquatic environments through the collaboration of edge-based learning models with IoT sensor networks. The information provided describes how the system's automatic real-time mediation contributes to the sustainability of aquaculture.
Figure 6. Oxygenation automatic distribution counts
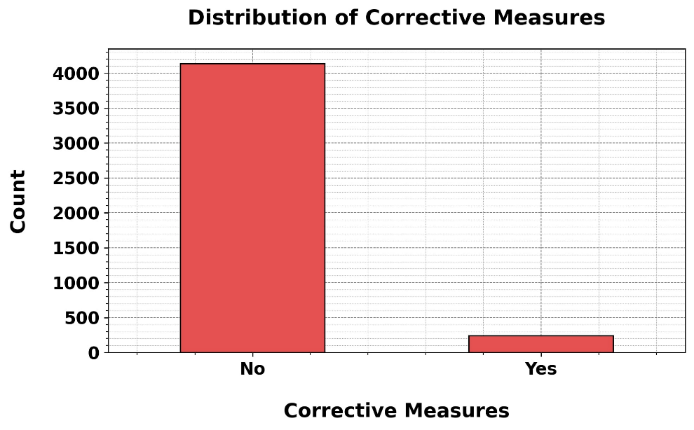
The supply of corrective measures implemented in smart aquaculture systems is depicted in Figure 7. The two sets are “YES” and “NO”. Almost 4000 people in the “NO” says that the corrective actions were not very often needed. Whereas 200 people, mostly in the “YES”, say that the remedial actions were considerably less often taken. The big difference in responses indicates that fewer changes are required for the system, though it maintains a good job of running smooth operations. The “NO” responses indicate that the system is taking the lead in observation and is robust in maintaining the prevention of excess drops in oxygen levels. The data collaboration of edge-based learning models and IoT sensor networks is useful for early detection of problems and automatically fixing them. Also, it can be helpful for sustainable aquaculture practice with small human intervention.
Figure 7. Corrective measures distribution count
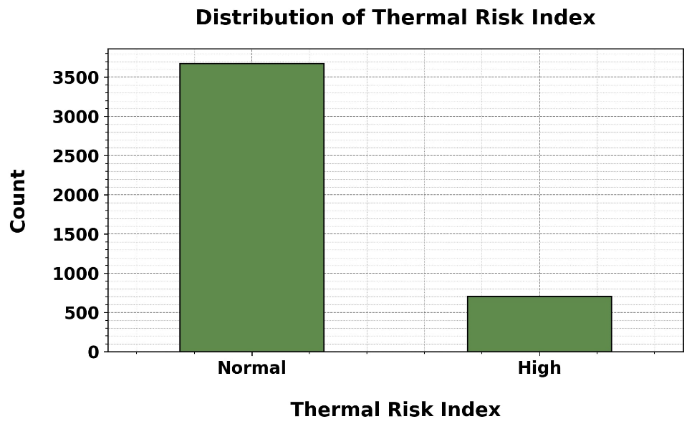
Figure 8 shows the distribution level of Thermal Risk Index in a smart aquaculture system. The "Normal" group has a much higher count, about 3500, which means that most of the measurements are in a safe thermal state. The "High" classification, on the other hand, has a much lower count, only about 500, instead of fewer cases of raised thermal risk. This lack of correspondence suggests that the system controls are popular within normal temperature ranges, with not many cases of thermal concern. The data focuses on the effectiveness of IoT sensor networks in maintaining constant temperatures in intensive care units and the function of edge-based learning models in timely detection and instruction on thermal fluctuations, thus guaranteeing a stable aquatic environment.
Figure 8. Thermal risk level distribution
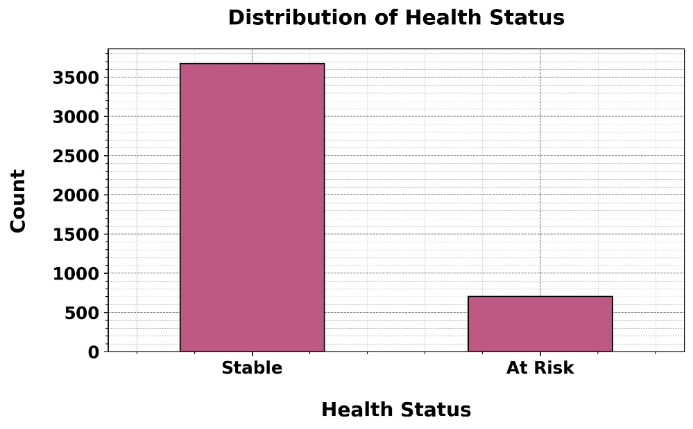
Figure 9 shows how health status is spread out in a smart aquaculture system. The "Stable" group has a much higher number, about 3500, which shows that most aquatic environments are still healthy and stable. The "At Risk" category, in contrast, has a lower count — roughly 500 — rather than fewer cases in the area where the health status is associated. This significant change illustrates that the areas where individuals observe things have low problem risk and are stable. The collaboration of edge-based learning models and IoT sensor networks provides good aquatic health and quickly finds possible risks to running aquaculture in a better way.
Figure 9. Health status distribution counts
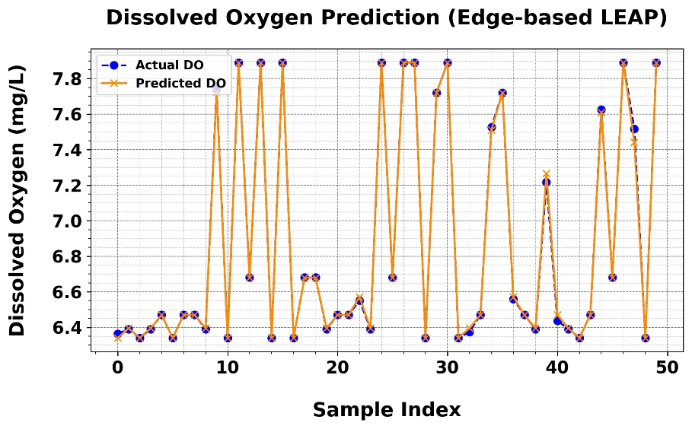
The relationship between expected and actual DO levels over 50 samples is depicted in Figure 10. The real DO values are mostly shown between 6.4 and 7.8 mg/L, represented as blue dots, whereas the predictions from the edge-based LEAP model are shown as orange lines. As per these predictions, the values often change their peaks and troughs around 7.8 mg/L and 6.4 mg/L. There exist some discrepancies, though the calculations are closer to real sizes, specifically when things change rapidly. This result indicates that the DO levels are accurately predicted by the edge-based LEAP model, along with a few variations. The graph shows that the oxygen levels are monitored continuously by this model, which is vital for maintaining optimal water conditions in aquaculture.
Figure 10. Dissolved oxygen (DO) prediction accuracy comparison
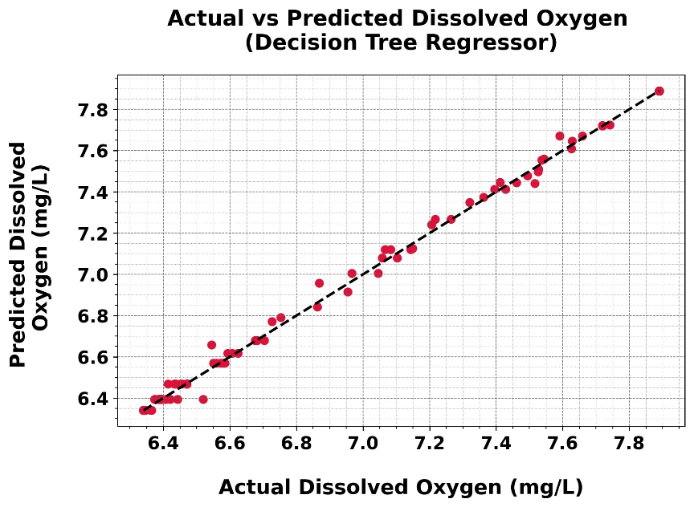
With the help of a Decision Tree algorithm, the actual DO levels and the predicted DO levels are compared as shown in Figure 11. From 6.4 to 7.8 mg/L, the actual DO values are represented on the x-axis, whereas the same range is used to show expected DO values on the y-axis. This results in the model predicting accurately, and the graph portrays the data points mostly as a diagonal line. Only a few errors are predicted by the model above and below the line as DO levels. This picture illustrates how effectively the edge-based learning model monitors oxygen levels, which are crucial for handling aquaculture health.
Figure 11. Actual vs predicted dissolved oxygen (DO) levels
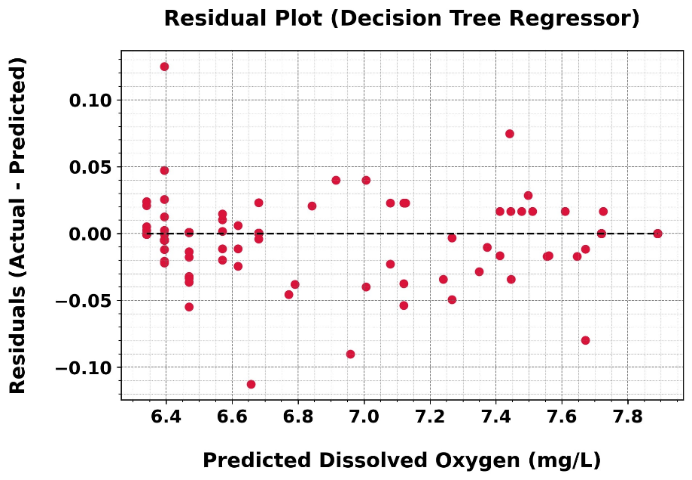
The differences between the actual DO levels and the predictions by the Decision Tree regressor are illustrated in Figure 12. 6.4 to 7.8 mg/L are the predicted DO values on the x-axis, and −0.11 to 0.11 mg/L are the residuals on the y-axis. The model predictions shown are accurate, as shown in Figure 12, where the maximum residuals are nearer to zero. Small prediction errors are located at slightly positive and negative residuals, with few locations exceeding ±0.05 mg/L. The model's ability to measure distributed oxygen levels, which is crucial for maintaining suitable aquaculture conditions, is demonstrated by the residuals' proximity to zero.
Figure 12. Prediction residuals for dissolved oxygen (DO) levels
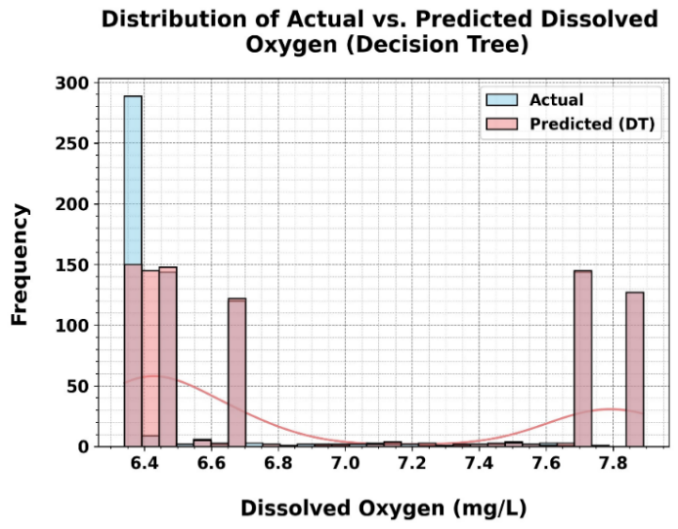
Figure 13 illustrates the variation between actual and expected DO levels in aquaculture. The y-axis displays the frequency of these values, while the x-axis displays the range of oxygen levels from 6.4 to 7.8 mg/L. The maximum is approximately 6.4 mg/L with a frequency of more than 250, according to the actual distributed oxygen readings (light blue bars). Subsequently, they reduce significantly, with few evaluations exceeding 7.0 mg/L. With distinct peaks at 6.6 and 7.8 mg/L, predicted distributed oxygen values (pink bars) are more dispersed throughout the range. This means that the model's predictions are more likely to happen. The deliveries are very close to each other, which suggests that the model accurately predicts distributed oxygen levels, allowing for the best possible monitoring in aquaculture systems.
Figure 13. Actual vs predicted distributed oxygen distribution (Decision Tree)
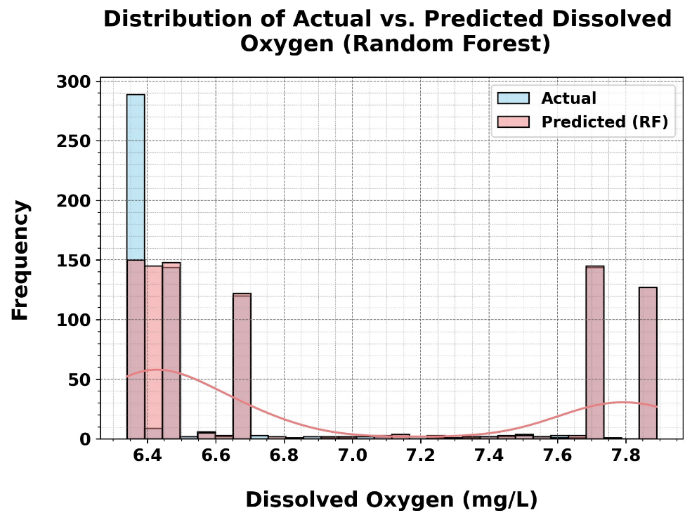
Figure 14 shows how DO levels in aquaculture are spread out, both in real life and in predictions. The x-axis shows distributed oxygen values between 6.4 and 7.8 mg/L, and the Figure shows how DO levels are distributed in aquaculture. The x-axis shows distributed oxygen values between 6.4 and 7.8 mg/L, and the y-axis shows how often each value occurs. The real distributed oxygen levels (blue bars) are mostly around 6.4 mg/L, with more than 250 cases. They then drop off quickly, and there are very few analyses above 7.0 mg/L. Predicted distributed oxygen values (pink bars) are more evenly spread out, with peaks around 6.6 mg/L and 7.8 mg/L, each with a prevalence of about 100–150. The comparison demonstrates how closely the model's predictions match real data, which are used to monitor the water's oxygen levels.
Figure 14. Actual vs predicted dissolved oxygen distribution (Random Forest)
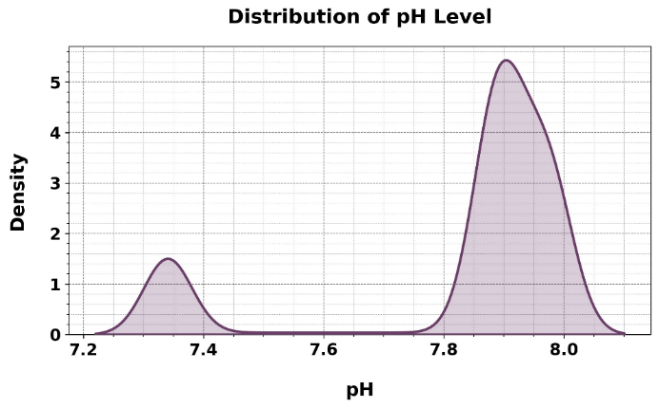
The pH level distribution in the aquaculture environment is depicted in Figure 15. From 7.2 to 8.2, various pH levels are displayed along with their density on the x-axis and y-axis, respectively. Two peaks can be seen in the data profiles: one is located at pH 7.3 and has a thickness slightly above 1. This choice is suggested because this combination is less common in the acidic to neutral range. At a pH above 8.0, the second peak occurs with a density of around 5.0, which is a higher concentration in a slightly alkaline environment. This results in the majority of pH values being approximately 8.0, which is ideal for a variety of aquaculture species. Conversely, a smaller range of measurements is around 7.3. The sudden water quality changes highlight how crucial it is to continuously monitor it. These concepts aid the development of edge-based learning models to preserve optimal pH levels, which enhances the health of aquatic habitats.
Figure 15. pH Level distribution in aquaculture
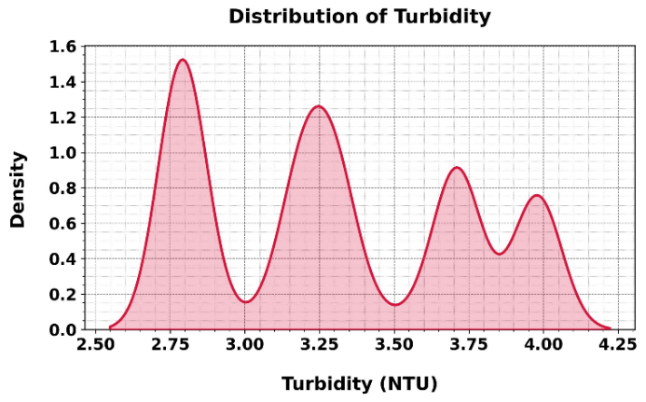
The turbidity level distribution expressed in NTU in the aquaculture environment is depicted in Figure 16. From 2.50 to 4.25 NTU, the turbidity distribution with its density values is shown on the x-axis and y-axis, respectively. A lot of peaks have been observed in the graph. Around 2.75 NTU, the highest density value occurs, which indicates that measurements are mostly nearer to this value. Near 3.20 NTU, another typical turbidity threshold, a minor peak with a density of around 1.0 appears. At about 3.75 NTU, the third peak is observed, which has a density of around 0.7 and exhibits greater turbidity values less frequently. According to the distribution labels, turbidity typically changes between 2.75 and 3.75 NTU, with minor variations occurring outside this range. These changes in the values highlight the requirement of continuous monitoring, which enables edge-based learning algorithms to enhance water clarity conditions, thereby maintaining the health of aquaculture ecosystems.
Figure 16. Turbidity distribution in aquaculture
Edge-based learning models and IoT sensor networks are integrated in aquaculture to acquire more uses. In research fields, it monitors the real-time environment more accurately and also predicts future changes. This helps to understand aquatic ecosystems. Water quality optimization, real-time corrective measures, temperature, and automated oxygenation are the various uses which keeps aquatic life healthy and reduce manual labour. Adopting this technology provides efficient use of resources, reducing the environmental impact of fish farming, and providing enough food and sustainable aquaculture. By reducing operating expenses and increasing productivity, helps the farmers to earn more money.
The intelligent aeration mechanism reduced unnecessary aerator operation by 27.3%, thereby lowering overall energy consumption and operational expenditure in aquaculture management.
This work shows that monitoring and improving smart aquaculture oxygen levels with integrated IoT sensor networks and edge-based learning models highlights how well a smart system can maintain optimal aquaculture conditions. Monthly oxygen monitoring counts varied from around 650 to 700, with January and March as the busiest months, and readings were close to 700. This demonstrates the consistency and frequency of data collection. Approximately 2,100 times, or nearly half of the 4,200 times it was seen, the automatic oxygenation system was activated, which suggests that it might react promptly to variations in oxygen concentrations. Out of 4,200 cases, system stability was maintained by only 200 interventions. The actual DO levels, ranging from 6.4 to 7.8 mg/L, matched the predicted values more closely, showing how accurate the prediction models were. The model's reliability is validated by the majority of residuals within ±0.11 mg/L. In addition to this, the water's pH and turbidity readings were mostly around 8.0 (density 5.5) and 2.75 NTU (density 1.4), indicating that the environment was being closely observed. The temperature was well-controlled, as verified by the thermal risk index, which showed over 3,500 normal readings and only 500 high-risk cases. Considering all, integrating IoT sensor networks with edge-based learning models enhances real-time oxygen management, decreases the need for manual intervention, and encourages sustainable aquaculture by enabling flexible and accurate environmental control. Although the proposed framework achieved high prediction accuracy and reduced energy consumption, the system was evaluated using limited environmental parameters. Future work may include salinity, ammonia, and weather-aware predictive analytics for large-scale aquaculture deployments. The experimental dataset, preprocessing configuration, and model implementation details can be made available upon reasonable request for research reproducibility purposes.
[1] Feng, H., Xiaoshuan, Z., Yang, K., Yu, J., Sun, Y., Han, B. (2025). Dissolved oxygen prediction and control for live transport of Plectropomus Leopardus using WSN and deep learning. SSRN Electronic Journal. https://doi.org/10.2139/ssrn.5234126
[2] Vagdevi, A., Mohan, P., Venkatesh, D., Chanikya, S., Ruthvik, V., Daniya, T. (2025). Smart dissolved oxygen regulation in aquaculture: A mobile app-based AI solution. In ICNKAI-2K25: International Level Conference on the Nexus of Knowledge Using AI and IoT. https://secp.prabodhanamfoundation.org/csn/index.php/csn-secp/article/view/12.
[3] Nayoun, M.N.I., Hossain, S.A., Rezaul, K.M., Siddiquee, K.N.E.A., Islam, M.S., Jannat, T. (2024). Internet of Things-driven precision in fish farming: A deep dive into automated temperature, oxygen, and pH regulation. Computers, 13(10): 267. https://doi.org/10.3390/computers13100267
[4] Le, N.T., Vo, C., Philippe, T., Nguyen, Q.H. (2024). Development of a smart dissolved oxygen monitoring system for water quality management and control devices in shrimp farms. Journal of Applied Science and Engineering, 28(3): 639-651. https://doi.org/10.6180/jase.202503_28(3).0019
[5] Zhou, J. (2025). Integration of real-time sequential root cause analysis and multivariate moving average-real-time sequential testing models for abnormal fish movement detection in aquaculture systems. Informatica, 49(23): 153-166. https://doi.org/10.31449/inf.v49i23.7660
[6] Correia, B., Pacheco, O., Rocha, R.J., Correia, P.L. (2025). Image-based shrimp aquaculture monitoring. Sensors, 25(1): 248. https://doi.org/10.3390/s25010248
[7] Liu, J., Zhang, C., An, D., Wei, Y. (2024). Development and application of an innovative dissolved oxygen prediction fusion model. Computers and Electronics in Agriculture, 227: 109496. https://doi.org/10.1016/j.compag.2024.109496
[8] Parra, L., Sendra, S., Garcia, L., Lloret, J. (2024). Smart low-cost control system for fish farm facilities. Applied Sciences, 14(14): 6244. https://doi.org/10.3390/app14146244
[9] Kanwal, S., Abdullah, M., Kumar, S., et al. (2024). An optimal internet of things-driven intelligent decision-making system for real-time fishpond water quality monitoring and species survival. Sensors, 24(23): 7842. https://doi.org/10.3390/s24237842
[10] Shete, R.P., Bongale, A.M., Dharrao, D. (2024). IoT-enabled effective real-time water quality monitoring method for aquaculture. MethodsX, 13: 102906. https://doi.org/10.1016/j.mex.2024.102906
[11] Olanubi, O.O., Akano, T.T., Asaolu, O.S. (2024). Design and development of an IoT-based intelligent water quality management system for aquaculture. Journal of Electrical Systems and Information Technology, 11(1): 15. https://doi.org/10.1186/s43067-024-00139-z
[12] Yang, J., Zhou, Y., Guo, Z., Zhou, Y., Shen, Y. (2024). Deep learning-based intelligent precise aeration strategy for factory recirculating aquaculture systems. Artificial Intelligence in Agriculture, 12: 57-71. https://doi.org/10.1016/j.aiia.2024.04.001
[13] Hemal, M.M., Rahman, A., Nurjahan, et al. (2024). An integrated smart pond water quality monitoring and fish farming recommendation aquabot system. Sensors, 24(11): 3682. https://doi.org/10.3390/s24113682
[14] Songpayome, P., Sutin, S., Sukmak, W., et al. (2024). A prototype pond water management system (dissolved oxygen, pH and temperature) for giant freshwater prawn farming in Pak Phanang, Southern Thailand. Heliyon, 10(10): e31231. https://doi.org/10.1016/j.heliyon.2024.e31231
[15] Chen, J., Xu, Y., Li, H., et al. (2025). The application of digital twin technology in the development of intelligent aquaculture: Status and opportunities. Fishes, 10(8): 363. https://doi.org/10.3390/fishes10080363
[16] Kannan, A.D., Lean, C.P., Chen, L., Kong, F.Y., Ng, P.K., Khan, M.R.B. (2024). Improving fish quality and yield: An automated monitoring system for intensive aquaculture. Malaysian Journal of Science and Advanced Technology, 4(2): 159-168. https://doi.org/10.56532/mjsat.v4i2.296
[17] Lee, S.Y., Jeong, D.Y., Choi, J., Jo, S.K., Park, D.H., Kim, J.G. (2024). LSTM model to predict missing data of dissolved oxygen in land-based aquaculture farm. ETRI Journal, 46(6): 1047-1060. https://doi.org/10.4218/etrij.2023-0337
[18] Demeekul, N., Puangsuwan, K., Rodcharoen, E., Techato, K., Kumar, A. (2025). Influences of dissolved oxygen sensor position on aeration efficiency of Venturi air injectors in aquaculture and wastewater treatment. International Journal of Agricultural and Biological Engineering, 18(3): 58-62. https://doi.org/10.25165/j.ijabe.20251803.8962
[19] Djainuddin, D., Fattah, F., Asis, M.A., Satra, R., Fattah, M.H., Abdalla, M.A.A. (2024). Monitoring oxygen levels of windu shrimp pond water using a dissolved oxygen sensor based on Wemos D1 R1. Bulletin of Social Informatics Theory and Application, 8(1): 133-143. https://doi.org/10.31763/businta.v3i1.163
[20] Nandy, M., Dubey, A. (2024). Effective surveillance of water quality in recirculating aquaculture systems through the application of intelligent biosensors. Natural and Engineering Sciences, 9(2): 234-243. https://doi.org/10.28978/nesciences.1575456
[21] Nagothu, S.K., Bindu Sri, P., Anitha, G., Vincent, S., Kumar, O.P. (2025). Advancing aquaculture: Fuzzy logic-based water quality monitoring and maintenance system for precision aquaculture. Aquaculture International, 33(1): 32. https://doi.org/10.1007/s10499-024-01701-2
[22] Zeta, B.M.A., Alam, S.U., Rahman, G.M.E.U., Ahmed, K.I.U. (2025). A low-cost pH sensor for real-time monitoring of aquaculture systems in a multi-layer wireless sensor network. Sensors, 25(9): 2824. https://doi.org/10.3390/s25092824
[23] Baena-Navarro, R., Carriazo-Regino, Y., Torres-Hoyos, F., Pinedo-López, J. (2025). Intelligent prediction and continuous monitoring of water quality in aquaculture: Integration of machine learning and Internet of Things for sustainable management. Water, 17(1): 82. https://doi.org/10.3390/w17010082
[24] Ilyasu, U., Sani, Z., Suleiman, T. (2025). Internet of Things-based smart fish farming: Application of smart sensors and computer vision to provide real-time monitoring and diagnosis in aquaculture. Journal of Basics and Applied Sciences Research, 3(2): 70-77. https://doi.org/10.4314/jobasr.v3i2.8
[25] Xu, L., Liu, W., Chengqing, C., et al. (2025). Hybrid deep learning framework for real-time DO prediction in aquaculture. Scientific Reports, 15(1): 24643. https://doi.org/10.1038/s41598-025-10786-5
[26] Muthukumar, K., Kumar, S.N., Kumar, V.R., Vetrivel, S., Prasath, S.V. (2025). Real-time adaptive aeration control and monitoring for aquaculture ponds. In The 2025 International Conference on Advanced Research in Electronics and Communication Systems (ICARECS-2025), Chennai, India, pp. 288-297. https://doi.org/10.2991/978-94-6463-754-0_26
[27] Desnanjaya, I.G.M.N., Nugraha, I.M.A., Ariana, A.A.G.B. (2025). Improved design and accuracy of real-time water quality and filtering systems for application in IoT-based aquaculture. Jurnal Riset Akuakultur, 20(1): 27-47. https://doi.org/10.15578/jra.20.1.2025.27-47
[28] Alluhaidan, A.S., Prabu, P., Aziz, R., Basheer, S. (2025). Enhanced LSTM-based AI model for accurate dissolved oxygen prediction in aquaculture systems. Smart Agricultural Technology, 12: 101140. https://doi.org/10.1016/j.atech.2025.101140
[29] Inam, A.S., Riam, S.Z., Islam, M.N., et al. (2026). Integrated sensor platform for real-time monitoring of nitrate, ammonium, temperature, and pH in aquatic environments. Talanta, 296: 128466. https://doi.org/10.1016/j.talanta.2025.128466
[30] Lin, F., Zhu, J., Yang, W. (2025). A multimodal vision-based algorithm for monitoring air supply in aquaculture. Aquaculture, 603: 742395. https://doi.org/10.1016/j.aquaculture.2025.742395