Norma Puspitasari* | Mochamad Agung Wibowo | Budi Warsito
© 2026 The authors. This article is published by IIETA and is licensed under the CC BY 4.0 license (http://creativecommons.org/licenses/by/4.0/).
OPEN ACCESS
Student dropout prediction has become an important research topic in vocational higher education because early identification of at-risk students can support timely academic intervention and retention management. This study proposes an Adaptive Weighted Tree Ensemble (AWET) framework enhanced with metaheuristic optimization for student dropout prediction. The proposed framework integrates multiple tree-based classifiers through an adaptive weighting mechanism, where ensemble weights and classification thresholds are optimized using Genetic Algorithm (GA), Grey Wolf Optimizer (GWO), and Particle Swarm Optimization (PSO). The model was developed and evaluated using a dataset containing 3,630 student records with 34 academic, demographic, attendance, and behavioral features. A stratified training-validation-testing strategy and five-fold cross-validation were employed to evaluate model robustness using accuracy, precision, recall, F1-score, ROC-AUC, and Matthews Correlation Coefficient (MCC). Experimental results demonstrate that the optimized AWET models consistently outperform the equal-weight ensemble approach, confirming the effectiveness of adaptive weighting and metaheuristic optimization. Among all optimized variants, AWET-GWO achieved the best overall performance, with an accuracy of 0.919, precision of 0.942, recall of 0.845, F1-score of 0.891, ROC-AUC of 0.962, and MCC of 0.830. The proposed framework provides an effective data-driven approach for developing early warning systems to identify students at risk of dropout in vocational higher education.
student dropout prediction, adaptive ensemble learning, metaheuristic optimization, machine learning, educational data mining, early warning system, vocational higher education
Higher education institutions have been using educational technologies and data-driven decision systems more frequently in recent years to assess academic risk, track student progress, and facilitate early intervention. Institutions may create predictive models to identify students who are at risk of dropping out before the issue becomes more challenging to handle due to the increasing availability of academic records, demographic profiles, attendance data, and behavioral markers [1-4]. Dropout prediction is especially crucial in vocational higher education because students participate in practice-oriented training, competency-based assessment, and industry-related academic activities in addition to classroom-based instruction. Compared to traditional academic programs, these features provide more varied learning patterns and complicate student growth [5-7].
Student dropout remains a critical issue because it affects individual students, institutional performance, educational resource planning, and workforce preparation. Students who discontinue their studies may face limited career opportunities, while institutions may experience reduced retention rates and decreased efficiency in academic management [8-10]. Therefore, accurate and timely dropout prediction is needed to support academic advisors and institutional decision-makers in designing appropriate intervention strategies, such as academic counseling, learning assistance, financial support, and student monitoring programs [11-13].
Machine learning has become an important approach in educational data mining and learning analytics due to its ability to process heterogeneous and high-dimensional student data [14-16]. Among various machine learning methods, tree-based ensemble models, such as Random Forest, Gradient Boosting, and Extremely Randomized Trees, have shown strong performance in classification tasks. These models are capable of capturing nonlinear relationships, handling complex feature interactions, and producing stable predictions across different types of educational datasets [17-20]. However, conventional ensemble models often depend on fixed hyperparameters and predefined weighting structures. This limitation may reduce model adaptability when dealing with imbalanced dropout data, noisy student records, and variations in student characteristics across academic cohorts [21-24].
Several optimization strategies have been introduced to improve the predictive performance of machine learning models, including automated hyperparameter tuning and metaheuristic optimization [25-27]. Metaheuristic algorithms, such as Particle Swarm Optimization (PSO), Genetic Algorithm (GA), and Grey Wolf Optimizer (GWO), are useful for exploring complex multidimensional search spaces and identifying near-optimal solutions without relying on a single deterministic search path [28-31]. These algorithms have demonstrated potential in improving convergence behavior, model stability, and classification performance in various prediction problems [32-34].
Previous studies have demonstrated the effectiveness of ensemble learning for student dropout prediction; however, most approaches rely on fixed-weight aggregation strategies or focus on improving individual classifiers independently. Consequently, the relative contribution of each base learner is usually predetermined and cannot adapt to variations in educational datasets. Furthermore, only limited research has investigated the simultaneous optimization of ensemble weights and decision thresholds within vocational higher education settings. This limitation may reduce the ability of conventional ensemble models to capture complex dropout patterns and class imbalance characteristics. Therefore, this study introduces an Adaptive Weighted Ensemble Tree (AWET) framework integrated with metaheuristic optimization to dynamically determine the contribution of each classifier and improve dropout prediction performance. Previous studies applied stacking ensembles, machine learning, genetic programming, data mining, and decision trees to predict dropout, academic failure, low performance, and final GPA, demonstrating potential for educational early warning [35-39].
To address this gap, this study proposes an AWET framework enhanced with metaheuristic optimization for student dropout prediction in vocational higher education. The proposed framework integrates multiple tree-based classifiers and assigns adaptive weights to each classifier according to its predictive contribution. PSO, GA, and GWO are employed to optimize ensemble weights and the classification threshold [40-42]. Through this design, the proposed model aims to improve predictive accuracy, recall, F1-score, Area Under the Receiver Operating Characteristic Curve (ROC-AUC), and robustness under imbalanced educational data conditions.
The main contribution of this study is the development of a mathematical and computational framework that combines adaptive ensemble weighting with metaheuristic optimization. Unlike conventional ensemble approaches that rely on fixed classifier contributions, the proposed AWET framework dynamically adjusts the role of each base learner to improve prediction reliability. The proposed model is expected to support the development of intelligent early warning systems that help vocational higher education institutions identify at-risk students more accurately and implement timely, data-driven intervention strategies [43-45].
The features of the dataset, preprocessing techniques, suggested AWET framework, metaheuristic optimization strategy, evaluation measures, and experimental setup utilized in this investigation are all explained in this part. Adaptive ensemble learning and metaheuristic-based optimization were combined in the methodological design to create a dependable dropout prediction model for vocational higher education.
2.1 Dataset description
The dataset used in this study consists of student academic records, demographic attributes, attendance histories, and behavioral indicators collected from vocational higher education programs over several academic semesters [46, 47]. These variables were selected because they represent important factors related to student persistence, academic performance, and dropout risk. Multi-source educational datasets have been widely used in learning analytics research to model student retention and dropout behavior [48-50].
Before model development, all student records were anonymized to protect personal identity and ensure compliance with institutional data ethics requirements. Missing values were handled using median imputation for numerical variables and mode-based imputation for categorical variables. Categorical variables were transformed using one-hot encoding, while numerical variables were normalized to ensure comparable feature scales across different measurement units [51-53].
The dataset was divided into training, validation, and testing subsets with a proportion of 70%, 15%, and 15%, respectively. Stratified sampling was applied to maintain the dropout and non-dropout class distribution in each subset. This strategy was used because dropout datasets commonly contain class imbalance, where non-dropout students are usually more dominant than dropout students [54].
2.2 Adaptive Weighted Ensemble Tree framework
Adaptive ensemble learning improves classification performance by combining the strengths of several base learners and reducing the weakness of individual models [55-57]. In this study, the proposed AWET framework combines multiple tree-based classifiers using adaptive weights. These weights are not assigned manually but optimized through metaheuristic algorithms to obtain the most effective contribution from each classifier.
Let $h_i(x)$ denote the prediction probability generated by the $i$-th base classifier for input $x$, and let $w_i$ represent the adaptive weight assigned to that classifier. The final ensemble prediction is formulated as:
$\hat{\mathrm{y}}(x)=\sum_{i=1}^N w_i h_i(\mathrm{x})$ (1)
where, $N$ is the number of base classifiers, $h_i(x)$ is the prediction output of the $i$-th classifier, and $w_i$ is the optimized weight of the corresponding classifier. The weights are constrained as follows:
$0 \leq w_i \leq 1, \sum_{i=1}^N w_i=1$ (2)
This constraint ensures that the ensemble output is a normalized weighted combination of all base classifiers. The adaptive weighting mechanism allows classifiers with stronger predictive contribution to receive higher weights, while classifiers with weaker contribution receive lower weights. This mechanism is expected to improve the detection of minority dropout cases and reduce prediction bias caused by imbalanced data [58-60].
2.2.1 Base learners
The proposed ensemble consists of four tree-based classifiers: Random Forest, Gradient Boosting Machine, Extra Trees Classifier, and CatBoost. These models were selected because they have complementary learning characteristics and are suitable for handling nonlinear relationships, mixed data structures, and complex feature interactions in educational datasets.
Random Forest provides robustness through bootstrap aggregation and random feature selection. Gradient Boosting Machine improves prediction by sequentially correcting errors from previous weak learners. Extra Trees Classifier increases diversity by using randomized splitting strategies. CatBoost is effective for datasets containing categorical features and can reduce prediction bias through ordered boosting. By combining these classifiers, the AWET framework is expected to capture diverse patterns related to student dropout risk.
2.2.2 Loss function
The optimization objective is to minimize the prediction error of the ensemble model. Since dropout prediction is treated as a binary classification problem, binary cross-entropy loss is used as the objective function. The loss function is defined as:
$\mathcal{L}=-\frac{1}{M} \sum_{j=1}^M\left[y_j \log \left(\hat{\mathrm{y}}_j\right)+\left(1-y_j\right) \log \left(1-\hat{\mathrm{y}}_j\right)\right]$ (3)
where, $M$ is the number of training samples, $y_j$ is the actual class label of the $j$-th student, and $\hat{\mathrm{y}}_j$ is the predicted dropout probability generated by the AWET model. Binary crossentropy loss is suitable for probabilistic classification because it penalizes incorrect probability estimates and provides sensitivity to classification errors in both dropout and nondropout classes [61-63]. Therefore, this loss function is appropriate for optimizing early warning models that require reliable prediction of at-risk students.
2.3 Metaheuristic optimization strategy
Metaheuristic optimization was applied to determine the optimal ensemble weight vector and selected model hyperparameters. Each candidate solution represents a combination of ensemble weights and model parameters. The general solution vector is expressed as:
$S=\left[w_1, w_2, \ldots, w_N, \tau\right]$ (4)
where, $w_1, w_2, \ldots, w_N$ are the ensemble weights and $\tau$ is the optimized classification threshold used to convert the final dropout probability into a binary class label.
Three metaheuristic algorithms were compared in this study: PSO, GA, and GWO. These algorithms were selected because they represent different search mechanisms and have been widely applied in optimization-based classification problems.
2.3.1 Particle Swarm Optimization
PSO simulates the movement of a swarm of particles in a search space. Each particle represents a candidate AWET configuration, including ensemble weights and selected hyperparameters. The particle updates its position by considering its own best experience and the best solution found by the swarm.
The velocity and position update equations are defined as:
$\begin{aligned} v_i^{t+1} & =w v_i^t+c_1 r_1\left(\text {pbest }_i-x_i^t\right) \\ & +c_2 r_2\left(\text {gbest }-x_i^t\right)\end{aligned}$ (5)
$x_i^{t+1}=x_i^t+v_i^{t+1}$ (6)
where, $v_i^t$ is the velocity of the i-th particle at iteration $t, x_i^t$ is the current particle position, $w$ is the inertia weight, $c_1$ and $c_2$ are acceleration coefficients, $r_1$ and $r_2$ are random values between 0 and 1, pbesti is the best solution found by the $i$-th particle, and gbest is the best global solution found by the swarm, pbesti is the best solution found by the $i$-th particle, and gbest is the best global solution found by the swarm.
After each update, the ensemble weights were normalized to satisfy the constraint $\sum_{i=1}^N w_i=1$.
2.3.2 Genetic Algorithm
The GA searches for the optimal AWET configuration through evolutionary operations, including selection, crossover, and mutation. In this study, each chromosome represents a candidate solution consisting of ensemble weights and selected hyperparameters. The chromosome structure is represented as:
$C=\left[w_1, w_2, \ldots, w_N, \tau\right]$ (7)
where, C denotes a chromosome, $w_1, w_2, \ldots, w_N$ represent the ensemble weights, and $\tau$ represents the classification threshold.
The resulting weights were normalized after genetic operations to ensure that the total weight remained equal to one.
2.3.3 Grey Wolf Optimizer
GWO is inspired by the leadership hierarchy and hunting mechanism of grey wolves. The best three candidate solutions are represented as alpha, beta, and delta wolves, while the remaining candidate solutions are treated as omega wolves. The search process is guided by the position of these leading wolves.
The distance and position update equations are formulated as:
$\begin{gathered}D_\alpha=\left|C_1 X_\alpha-X\right|, \\ D_\beta=\left|C_2 X_\beta-X\right|, D_\delta=\left|C_3 X_\delta-X\right|\end{gathered}$ (8)
$X_1=X_\alpha-A_1 D_\alpha, X_2=X_\beta-A_2 D_\beta, X_3=X_\delta-A_3 D_\delta$ (9)
$X(t+1)=\frac{X_1+X_2+X_3}{3}$ (10)
where, $X$ is the current position of a search agent, $X_\alpha, X_\beta$, and $X_\delta$ are the positions of the three best candidate solutions, while $A$ and $C$ are coefficient vectors that control exploration and exploitation. Through this mechanism, GWO searches for the best AWET configuration by following the most promising candidate solutions.
2.4 Overall optimization procedure
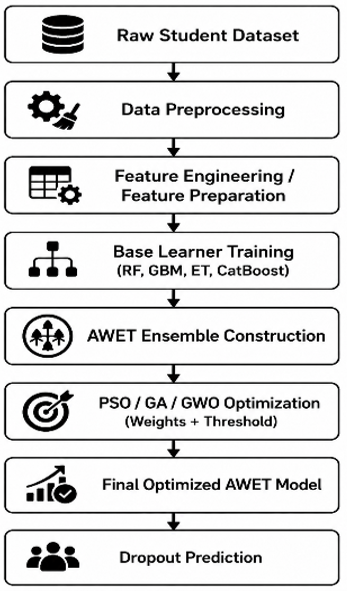
The overall workflow of the proposed AWET framework consists of six sequential stages. First, raw student data were preprocessed through data cleaning, missing value imputation, categorical encoding, feature normalization, and class distribution inspection. Second, feature engineering and feature preparation were performed to transform the educational variables into machine-learning-ready representations. Third, the four base learners, namely Random Forest, Gradient Boosting Machine, Extra Trees Classifier, and CatBoost, were independently trained using the training dataset.
Fourth, the AWET structure was constructed by combining the prediction probabilities generated by all base learners through a weighted aggregation mechanism. Fifth, the ensemble weight vector and classification threshold were optimized using three metaheuristic algorithms: PSO, GA, and GWO. The optimization process searched for the best configuration that minimized validation loss while maximizing classification performance.
Finally, the optimized AWET model was evaluated on the testing dataset to generate the final dropout predictions. The complete workflow is illustrated in Figure 1 and follows the sequence: Data Preprocessing → Feature Preparation → Base Learner Training → AWET Ensemble Construction → Metaheuristic Optimization → Final Prediction.
Figure 1. Overall optimization framework of the proposed Adaptive Weighted Ensemble Tree (AWET) model using metaheuristic algorithms
2.5 Evaluation metrics
The performance of the proposed model was evaluated using several classification metrics to obtain a comprehensive assessment of predictive ability, especially under imbalanced class conditions. The metrics used in this study include accuracy, precision, recall, F1-score, ROC-AUC, and Matthews Correlation Coefficient (MCC).
Accuracy measures the proportion of correctly classified instances. Precision measures the proportion of predicted dropout cases that are actually dropout cases. Recall measures the ability of the model to correctly identify actual dropout students. F1-score provides a balanced measure between precision and recall. ROC-AUC evaluates the model’s ability to distinguish between dropout and non-dropout classes across different threshold values. MCC was also used because it provides a balanced evaluation even when the class distribution is imbalanced.
The use of multiple evaluation metrics is important because high accuracy alone may be misleading in dropout prediction when the number of non-dropout students is much larger than the number of dropout students.
2.6 Experimental setup
The experiments were implemented using Python with Scikit-learn, CatBoost, and custom implementations of PSO, GA, and GWO. All models were trained and evaluated using the same training, validation, and testing partitions to ensure fair comparison.
A 5-fold stratified cross-validation procedure was applied during model development to reduce evaluation bias and maintain class distribution in each fold. The final optimized model was then evaluated on the independent testing subset. All simulations were conducted on a workstation equipped with an Intel Core i7 processor and 32 GB RAM. GPU acceleration was used when available, particularly for CatBoost training.
The experimental results from the baseline models and the optimized AWET variants were compared to determine whether metaheuristic optimization improved predictive performance. The best-performing model was selected based on overall performance across accuracy, precision, recall, F1-score, ROC-AUC, and MCC.
The reported mean and standard deviation values were calculated across the five validation folds to assess the robustness and stability of each predictive model.
This section presents the experimental results of the proposed AWET model enhanced with metaheuristic optimization. The evaluation was conducted using a student dataset consisting of 3,630 records and 34 predictive features. The target variable was divided into two classes, namely non-dropout and dropout students. The dataset consisted of 2,209 non-dropout students and 1,421 dropout students. A stratified data splitting strategy was applied by dividing the dataset into 70% training data, 15% validation data, and 15% testing data to preserve the class distribution in each subset.
The performance of the proposed model was compared with several baseline tree-based classifiers, namely Random Forest, Gradient Boosting Machine, Extra Trees Classifier, and CatBoost. In addition, the AWET model was evaluated using equal weighting and three metaheuristic optimization strategies, namely GA, GWO, and PSO. The evaluation metrics included accuracy, precision, recall, F1-score, ROC-AUC, and MCC.
3.1 Performance comparison of baseline and optimized models
Table 1 presents the performance comparison between the baseline models and the optimized AWET variants. The use of multiple evaluation metrics is important because dropout prediction commonly involves class imbalance. Accuracy alone may not sufficiently represent the model’s ability to identify students at risk of dropout. Therefore, precision, recall, F1-score, ROC-AUC, and MCC were also used to obtain a more balanced evaluation.
Table 1. Performance comparison of baseline and optimized ensemble models
|
Model |
Accuracy |
Precision |
Recall |
F1-Score |
ROC-AUC |
MCC |
|
Random Forest |
0.906 |
0.893 |
0.864 |
0.878 |
0.961 |
0.803 |
|
Gradient Boosting Machine |
0.905 |
0.909 |
0.840 |
0.873 |
0.956 |
0.798 |
|
Extra Trees Classifier |
0.925 |
0.930 |
0.873 |
0.901 |
0.960 |
0.841 |
|
CatBoost |
0.894 |
0.857 |
0.873 |
0.865 |
0.955 |
0.777 |
|
AWET Equal Weight |
0.908 |
0.901 |
0.859 |
0.880 |
0.961 |
0.806 |
|
AWET + GA |
0.917 |
0.942 |
0.840 |
0.888 |
0.962 |
0.827 |
|
AWET + GWO |
0.919 |
0.942 |
0.845 |
0.891 |
0.962 |
0.830 |
|
AWET + PSO |
0.917 |
0.942 |
0.840 |
0.888 |
0.962 |
0.827 |
Table 2. Performance comparison based on five-fold stratified cross-validation (mean ± standard deviation)
|
Model |
Accuracy |
Precision |
Recall |
F1-Score |
ROC-AUC |
MCC |
|
Random Forest |
0.904 ± 0.010 |
0.921 ± 0.023 |
0.827 ± 0.011 |
0.871 ± 0.012 |
0.952 ± 0.007 |
0.799 ± 0.021 |
|
Gradient Boosting Machine |
0.909 ± 0.006 |
0.926 ± 0.012 |
0.834 ± 0.012 |
0.877 ± 0.008 |
0.954 ± 0.006 |
0.808 ± 0.012 |
|
Extra Trees Classifier |
0.910 ± 0.007 |
0.931 ± 0.018 |
0.833 ± 0.006 |
0.879 ± 0.008 |
0.952 ± 0.008 |
0.811 ± 0.015 |
|
CatBoost |
0.908 ± 0.011 |
0.935 ± 0.025 |
0.822 ± 0.014 |
0.875 ± 0.015 |
0.953 ± 0.007 |
0.806 ± 0.025 |
|
AWET Equal Weight |
0.911 ± 0.006 |
0.933 ± 0.020 |
0.833 ± 0.009 |
0.880 ± 0.007 |
0.956 ± 0.007 |
0.813 ± 0.014 |
|
AWET + GA |
0.906 ± 0.007 |
0.951 ± 0.017 |
0.800 ± 0.011 |
0.869 ± 0.010 |
0.955 ± 0.007 |
0.803 ± 0.016 |
|
AWET + GWO |
0.907 ± 0.006 |
0.956 ± 0.014 |
0.799 ± 0.009 |
0.871 ± 0.008 |
0.955 ± 0.007 |
0.807 ± 0.013 |
|
AWET + PSO |
0.906 ± 0.007 |
0.955 ± 0.015 |
0.797 ± 0.010 |
0.868 ± 0.009 |
0.955 ± 0.007 |
0.804 ± 0.015 |
As shown in Table 1, the baseline tree-based models produced strong predictive performance. Among the individual baseline classifiers, Extra Trees Classifier achieved the highest accuracy of 0.925, F1-score of 0.901, and MCC of 0.841. This indicates that the randomized tree structure of Extra Trees was effective in capturing complex patterns in student dropout data. Random Forest also showed strong performance, with an accuracy of 0.906, recall of 0.864, ROC-AUC of 0.961, and MCC of 0.803. Gradient Boosting Machine achieved an accuracy of 0.905 and precision of 0.909, while CatBoost achieved balanced recall performance of 0.873.
The equal-weight AWET model achieved an accuracy of 0.908, precision of 0.901, recall of 0.859, F1-score of 0.880, ROC-AUC of 0.961, and MCC of 0.806. This result indicates that combining multiple tree-based learners can produce competitive predictive performance. However, the equal-weight strategy does not consider the different contribution levels of each base learner. Therefore, assigning the same weight to all classifiers may not always produce the optimal ensemble configuration.
After metaheuristic optimization was applied, the AWET variants showed improved performance compared with the equal-weight AWET model. AWET + GA achieved an accuracy of 0.917, precision of 0.942, F1-score of 0.888, ROC-AUC of 0.962, and MCC of 0.827. AWET + PSO produced the same accuracy, precision, F1-score, ROC-AUC, and MCC values as AWET + GA in this experiment. Meanwhile, AWET + GWO achieved the strongest performance among the optimized AWET variants, with an accuracy of 0.919, precision of 0.942, recall of 0.845, F1-score of 0.891, ROC-AUC of 0.962, and MCC of 0.830.
These findings indicate that metaheuristic optimization improved the adaptive ensemble configuration. Although the Extra Trees Classifier achieved the highest individual classification performance in terms of accuracy, F1-score, and MCC, the proposed AWET framework provides a more flexible ensemble architecture by adaptively optimizing classifier contributions and decision thresholds. Consequently, AWET + GWO demonstrated superior precision, competitive overall predictive performance, and greater adaptability for deployment in educational early warning systems. These characteristics make the proposed framework particularly suitable for supporting robust and data-driven intervention strategies in vocational higher education.
Table 1 reports the performance on the independent testing dataset, whereas Table 2 summarizes the average performance obtained from five-fold stratified cross-validation to evaluate the robustness and stability of the proposed models.
Table 2 presents the average performance obtained from a five-fold stratified cross-validation procedure. Overall, the standard deviation values are relatively small across all evaluation metrics, indicating that the proposed models exhibit stable predictive performance across different data partitions. Among the optimized ensemble models, AWET + GWO achieved the highest average precision (0.956 ± 0.014) and maintained competitive performance across the remaining evaluation metrics, suggesting that the GWO consistently produced robust ensemble configurations. The relatively low standard deviations also indicate that the proposed optimization strategy is reliable and not highly sensitive to variations in the training and validation subsets.
3.1.1 Cross-validation performance
The five-fold stratified cross-validation results presented in Table 2 demonstrate that all models achieved relatively low standard deviations, indicating stable predictive performance across different training-validation partitions. Although the average cross-validation accuracy is slightly lower than the independent testing performance shown in Table 1, this result is expected because cross-validation evaluates the model repeatedly using different subsets of the data. Among the optimized models, AWET + GWO achieved the highest average precision while maintaining competitive performance across the remaining evaluation metrics.
Furthermore, the consistently low standard deviation values (<0.03 across all evaluation metrics) suggest that the proposed optimization framework is robust and produces stable predictive performance regardless of the training-validation partition. This stability is particularly important for educational decision support systems because prediction reliability directly affects intervention planning and student retention strategies.
3.2 Optimized ensemble weight analysis
Table 3 presents the optimized ensemble weights generated by the metaheuristic algorithms. The weight values indicate the relative contribution of each base learner in the final AWET prediction. Unlike the equal-weight approach, the optimized AWET models assign different weights to each classifier based on validation performance.
The optimized weights show that each base learner contributed differently to the final ensemble prediction. In AWET + GA, the highest weight was assigned to Extra Trees Classifier at 0.414, followed by Random Forest at 0.354, CatBoost at 0.186, and Gradient Boosting Machine at 0.046. A similar pattern was observed in AWET + GWO, where Extra Trees Classifier received the highest weight of 0.462, followed by CatBoost at 0.298, Random Forest at 0.217, and Gradient Boosting Machine at 0.024. In AWET + PSO, Random Forest received the highest weight of 0.374, followed by Extra Trees Classifier at 0.387, CatBoost at 0.198, and Gradient Boosting Machine at 0.041.
These results indicate that Extra Trees Classifier and Random Forest played a dominant role in the optimized AWET framework. This finding is consistent with the baseline performance results, where Extra Trees Classifier achieved the strongest individual performance. The relatively lower weights assigned to Gradient Boosting Machine suggest that its contribution to the optimized ensemble was smaller than that of the other classifiers in this dataset.
The optimized threshold values ranged from 0.569 to 0.576, which were higher than the default classification threshold of 0.500. This indicates that the optimized AWET models required stronger predictive confidence before classifying a student as a dropout. This adjustment contributed to higher precision, reducing the number of false positive predictions in the testing dataset.
Table 3. Optimized ensemble weights generated by metaheuristic algorithms
|
Optimization Method |
Random Forest |
Gradient Boosting Machine |
Extra Trees Classifier |
CatBoost |
Threshold |
|
AWET Equal Weight |
0.250 |
0.250 |
0.250 |
0.250 |
0.500 |
|
AWET + GA |
0.354 |
0.046 |
0.414 |
0.186 |
0.569 |
|
AWET + GWO |
0.217 |
0.024 |
0.462 |
0.298 |
0.571 |
|
AWET + PSO |
0.374 |
0.041 |
0.387 |
0.198 |
0.576 |
3.3 Effect of metaheuristic optimization
The comparison between AWET Equal Weight and the optimized AWET variants demonstrates the effect of metaheuristic optimization on ensemble performance. The equal-weight AWET model achieved an accuracy of 0.908 and MCC of 0.806. After optimization, AWET + GA and AWET + PSO improved accuracy to 0.917 and MCC to 0.827, while AWET + GWO improved accuracy to 0.919 and MCC to 0.830.
The improvement in MCC is particularly important because MCC evaluates classification performance by considering true positives, true negatives, false positives, and false negatives simultaneously. In imbalanced classification problems, MCC is often more informative than accuracy because it reflects the balance of prediction quality across both classes. Therefore, the higher MCC values obtained by the optimized AWET variants indicate that metaheuristic optimization improved the overall reliability of dropout classification.
Among the three metaheuristic algorithms, GWO produced the strongest AWET configuration in this experiment. This may be attributed to its hierarchical search mechanism, where the alpha, beta, and delta candidate solutions guide the optimization process. This mechanism helped the model identify a more effective combination of ensemble weights and classification threshold. GA and PSO also produced competitive results, showing that different metaheuristic strategies can improve ensemble performance through adaptive weight optimization.
The results also show that optimized AWET did not simply average the outputs of the base learners. Instead, the model adjusted the contribution of each classifier according to its predictive strength. This adaptive mechanism is important because each base learner may capture different patterns from student academic, demographic, attendance, and behavioral data.
3.4 Robustness against imbalanced dropout data
Student dropout prediction is commonly affected by class imbalance because the number of students who continue their studies is often higher than the number of students who drop out. In this study, the dataset contained 2,209 non-dropout students and 1,421 dropout students. Although the imbalance was not extreme, it was still necessary to evaluate the model using metrics beyond accuracy.
Recall and F1-score are important in this context because they reflect the model’s ability to identify students who are actually at risk of dropout. Extra Trees Classifier achieved the highest recall among the best-performing models, while AWET + GWO produced a balanced performance with high precision, F1-score, ROC-AUC, and MCC. The high precision value of 0.942 in the optimized AWET variants indicates that the model reduced false positive predictions, meaning that students classified as dropout risk were more likely to truly belong to the dropout class.
In early warning systems, reducing false positives and false negatives is important. False positives may cause institutions to allocate intervention resources to students who are not actually at risk, while false negatives may result in at-risk students being missed. The optimized AWET variants improved the balance of prediction performance by increasing precision and MCC compared with the equal-weight ensemble. This makes the proposed framework useful for supporting more reliable academic decision-making.
3.5 Practical implications for early warning decision support
The findings should be interpreted within the context of vocational higher education and should not be generalized to other educational environments without further validation. By using academic, demographic, attendance, and behavioral variables, the model can help institutions identify students who are more likely to experience dropout risk. The prediction results can be used as part of an early warning decision support system for academic advisors, program managers, and institutional administrators.
Students identified as high-risk can be prioritized for academic counseling, learning assistance, attendance monitoring, financial support evaluation, or other intervention programs. The model does not replace human judgment but provides data-driven evidence to support earlier and more targeted decision-making. This is particularly important in vocational higher education, where student progression is influenced by both academic performance and practice-oriented learning activities.
The optimized AWET framework is also flexible because the ensemble weights can be adjusted according to validation performance. This means that the model can be retrained and recalibrated when new student cohorts or institutional datasets become available. Such flexibility is valuable because dropout patterns may change across academic years, study programs, and student populations.
3.6 Limitations
Although the proposed AWET framework produced promising results, several limitations should be considered. First, the model performance depends on the quality and completeness of the student dataset. Missing, inconsistent, or inaccurate records may affect prediction reliability. Second, this study used academic, demographic, attendance, and behavioral indicators, while other factors such as family background, financial pressure, learning motivation, psychological condition, and institutional support may also influence dropout risk.
Third, the model was evaluated using a single cleaned dataset. Therefore, external validation using multi-institutional datasets is recommended for future research. Fourth, metaheuristic optimization may require additional computational resources compared with conventional model training. However, this computational cost can be justified when the optimized model provides better prediction reliability and supports more effective intervention planning.
3.7 Summary of findings
Overall, the experimental results show that the proposed AWET framework enhanced with metaheuristic optimization provides a competitive approach for student dropout prediction. The optimized AWET variants improved the performance of the equal-weight ensemble, particularly in terms of accuracy, precision, ROC-AUC, and MCC. Among the optimized AWET variants, AWET + GWO achieved the best performance, whereas the Extra Trees Classifier remained the strongest individual baseline model.
The findings confirm that adaptive ensemble weighting can improve prediction reliability by adjusting the contribution of each base learner. The optimized weight distribution showed that Extra Trees Classifier and Random Forest contributed strongly to the final prediction. Therefore, the proposed AWET framework can serve as a useful foundation for developing intelligent early warning systems to support data-driven dropout intervention in vocational higher education.
This study proposed an AWET framework enhanced with metaheuristic optimization for predicting student dropout in vocational higher education. The proposed framework combined four tree-based base learners, namely Random Forest, Gradient Boosting Machine, Extra Trees Classifier, and CatBoost. The ensemble weights and classification threshold were optimized using GA, GWO, and PSO to improve prediction reliability under imbalanced educational data conditions.
The experimental results showed that the baseline tree-based models produced strong predictive performance, with the Extra Trees Classifier achieving the highest individual performance in terms of accuracy, F1-score, and MCC. However, the optimized AWET variants consistently outperformed the equal-weight ensemble model through adaptive optimization of ensemble weights and classification thresholds. Among the optimized AWET variants, AWET + GWO achieved the best performance, with an accuracy of 0.919, precision of 0.942, recall of 0.845, F1-score of 0.891, ROC-AUC of 0.962, and MCC of 0.830. These findings demonstrate that the proposed AWET framework offers competitive predictive performance while providing greater flexibility, adaptive decision-making capability, and robustness for educational early warning systems in vocational higher education.
From a practical perspective, the proposed model can support the development of intelligent early warning decision support systems in vocational higher education. By identifying students at risk of dropout based on academic, demographic, attendance, and behavioral indicators, institutions can design more timely and targeted intervention strategies, such as academic counseling, learning assistance, attendance monitoring, and financial support evaluation. The model is not intended to replace academic decision-making, but to provide data-driven evidence that can support more proactive student retention management.
This study still has several limitations. The model was evaluated using a single cleaned dataset, so further validation using multi-institutional datasets is required to examine its generalizability. In addition, the current model used academic, demographic, attendance, and behavioral variables, while other factors such as family background, financial pressure, learning motivation, psychological condition, and institutional support may also influence dropout risk. Future research may extend the proposed framework by incorporating broader student-related variables, applying temporal learning features, and comparing the AWET framework with deep learning-based and explainable artificial intelligence approaches.
The findings are specific to the vocational higher education dataset used in this study. Therefore, the generalizability of the proposed framework to other educational contexts requires further investigation using external datasets from different institutions and educational environments.
Overall, the proposed AWET framework demonstrates that integrating adaptive ensemble weighting with metaheuristic optimization is a promising direction for developing robust educational early warning systems in vocational higher education.
The authors would like to thank the vocational higher education institution for providing access to the anonymized student dataset used in this study. The authors also acknowledge the support of academic colleagues whose constructive discussions contributed to the development and validation of the proposed model.
[1] Romero, C., Ventura, S. (2010). Educational data mining: A review of the state of the art. IEEE Transactions on Systems, Man, and Cybernetics, Part C (Applications and Reviews), 40(6): 601-618. https://doi.org/10.1109/TSMCC.2010.2053532
[2] Long, P., Siemens, G. (2014). Penetrating the fog: Analytics in learning and education. Italian Journal of Educational Technology, 22(3): 132-137.
[3] Slade, S., Prinsloo, P. (2013). Learning analytics: Ethical issues and dilemmas. American Behavioral Scientist, 57(10): 1510-1529. https://doi.org/10.1177/0002764213479366
[4] Jayaprakash, S.M., Moody, E.W., Lauría, E.J.M., Regan, J.R., Baron, J.D. (2014). Early alert of academically at-risk students: An open source analytics initiative. Journal of Learning Analytics, 1(1): 6-47. https://doi.org/10.18608/jla.2014.11.3
[5] Arnold, K.E., Pistilli, M.D. (2012). Course signals at Purdue: Using learning analytics to increase student success. In Proceedings of the 2nd International Conference on Learning Analytics and Knowledge (LAK '12). Association for Computing Machinery, New York, USA, pp. 267-270. https://doi.org/10.1145/2330601.2330666
[6] Alyahyan, E., Düştegör, D. (2020). Predicting academic success in higher education: Literature review and best practices. International Journal of Educational Technology in Higher Education, 17(1): 3. https://doi.org/10.1186/s41239-020-0177-7
[7] Campbell, J.P., DeBlois, P.B., Oblinger, D.G. (2007). Academic analytics: A new tool for a new era. EDUCAUSE Review, 42(4): 40-57. https://er.educause.edu/articles/2007/7/academic-analytics-a-new-tool-for-a-new-era.
[8] Tinto, V. (2017). Through the eyes of students. Journal of College Student Retention: Research, Theory & Practice, 19(3): 254-269. https://doi.org/10.1177/1521025115621917
[9] Delen, D. (2010). A comparative analysis of machine learning techniques for student retention management. Decision Support Systems, 49(4): 498-506. https://doi.org/10.1016/j.dss.2010.06.003
[10] Lakkaraju, H., Aguiar, E., Shan, C., Miller, D., Bhanpuri, N., Ghani, R., Addison, K.L. (2015). A machine learning framework to identify students at risk of adverse academic outcomes. In Proceedings of the 21st ACM SIGKDD International Conference on Knowledge Discovery and Data Mining, Sydney, NSW, Australia, pp. 1909-1918. https://doi.org/10.1145/2783258.2788620
[11] Kloft, M., Stiehler, F., Zheng, Z.L., Pinkwart, N. (2014). Predicting MOOC dropout over weeks using machine learning methods. In Proceedings of the EMNLP 2014 Workshop on Analysis of Large Scale Social Interaction in MOOCs, Doha, Qatar, pp. 60-65. https://doi.org/10.3115/v1/W14-4111
[12] Xing, W.L., Du, D.O. (2019). Dropout prediction in MOOCs: Using deep learning for personalized intervention. Journal of Educational Computing Research, 57(3): 547-570. https://doi.org/10.1177/0735633118757015
[13] Basnet, R.B., Johnson, C., Doleck, T. (2022). Dropout prediction in MOOCs using deep learning and machine learning. Education and Information Technologies, 27(8): 11499-11513. https://doi.org/10.1007/s10639-022-11068-7
[14] Baker, R., Yacef, K. (2009). The state of educational data mining in 2009: A review and future visions. Journal of Educational Data Mining, 1(1): 3-17. https://doi.org/10.5281/zenodo.3554657
[15] Baker, R.S. (2014). Educational data mining: An advance for intelligent systems in education. IEEE Intelligent Systems, 29(3): 78-82. https://doi.org/10.1109/MIS.2014.42
[16] Baker, R.S., Inventado, P.S. (2014). Educational data mining and learning analytics. In Learning Analytics, pp. 61-75. https://doi.org/10.1007/978-1-4614-3305-7_4
[17] Breiman, L. (2001). Random forests. Machine Learning, 45(1): 5-32. https://doi.org/10.1023/A:1010933404324
[18] Friedman, J.H. (2001). Greedy function approximation: A gradient boosting machine. The Annals of Statistics, 29(5): 1189-1232. https://doi.org/10.1214/aos/1013203451
[19] Geurts, P., Ernst, D., Wehenkel, L. (2006). Extremely randomized trees. Machine Learning, 63(1): 3-42. https://doi.org/10.1007/s10994-006-6226-1
[20] Prokhorenkova, L., Gusev, G., Vorobev, A., Dorogush, A.V., Gulin, A. (2018). CatBoost: Unbiased boosting with categorical features. In Advances in Neural Information Processing Systems. https://proceedings.neurips.cc/paper/2018/hash/14491b756b3a51daac41c24863285549-Abstract.html.
[21] Dietterich, T.G. (2000). Ensemble methods in machine learning. In Multiple Classifier Systems, pp. 1-15. https://doi.org/10.1007/3-540-45014-9_1
[22] Polikar, R. (2012). Ensemble learning. In Ensemble Machine Learning, pp. 1-34. https://doi.org/10.1007/978-1-4419-9326-7_1
[23] Hansen, L.K., Salamon, P. (1990). Neural network ensembles. IEEE Transactions on Pattern Analysis and Machine Intelligence, 12(10): 993-1001. https://doi.org/10.1109/34.58871
[24] Brown, G., Wyatt, J., Harris, R., Yao, X. (2005). Diversity creation methods: A survey and categorisation. Information Fusion, 6(1): 5-20. https://doi.org/10.1016/j.inffus.2004.04.004
[25] Shahhosseini, M., Hu, G.P., Pham, H. (2022). Optimizing ensemble weights and hyperparameters of machine learning models for regression problems. Machine Learning with Applications, 7: 100251. https://doi.org/10.1016/j.mlwa.2022.100251
[26] Zou, Q., Xie, S.F., Lin, Z.Y., Wu, M.H., Ju, Y. (2016). Finding the best classification threshold in imbalanced classification. Big Data Research, 5: 2-8. https://doi.org/10.1016/j.bdr.2015.12.001
[27] Hutter, F., Kotthoff, L., Vanschoren, J. (2019). Automated Machine Learning: Methods, Systems, Challenges. Cham, Switzerland, Springer. https://doi.org/10.1007/978-3-030-05318-5
[28] Kennedy, J., Eberhart, R. (1995). Particle swarm optimization. In Proceedings of the IEEE International Conference on Neural Networks, Perth, WA, Australia, pp. 1942-1948. https://doi.org/10.1109/ICNN.1995.488968
[29] Holland, J.H. (1992). Genetic algorithms. Scientific American, 267(1): 66-73. https://doi.org/10.1038/scientificamerican0792-66
[30] Mirjalili, S., Mirjalili, S.M., Lewis, A. (2014). Grey wolf optimizer. Advances in Engineering Software, 69: 46-61. https://doi.org/10.1016/j.advengsoft.2013.12.007
[31] Talbi, E.G. (2009). Metaheuristics: From design to implementation. Hoboken, NJ, USA, Wiley, pp. 1-593. https://doi.org/10.1002/9780470496916
[32] Blum, C., Roli, A. (2003). Metaheuristics in combinatorial optimization: Overview and conceptual comparison. ACM Computing Surveys, 35(3): 268-308. https://doi.org/10.1145/937503.937505
[33] Eiben, A.E., Smith, J.E. (2015). Introduction to Evolutionary Computing. Berlin, Germany, Springer. https://doi.org/10.1007/978-3-662-44874-8
[34] Yang, X.S. (2014). Nature-Inspired Optimization Algorithms. Oxford, UK, Elsevier. https://doi.org/10.1016/C2013-0-01368-0
[35] Talamás-Carvajal, J.A., Ceballos, H.G. (2023). A stacking ensemble machine learning method for early identification of students at risk of dropout. Education and Information Technologies, 28(9): 12169-12189. https://doi.org/10.1007/s10639-023-11682-z
[36] Del Bonifro, F., Gabbrielli, M., Lisanti, G., Zingaro, S.P. (2020). Student dropout prediction. In Artificial Intelligence in Education, pp. 129-140. https://doi.org/10.1007/978-3-030-52237-7_11
[37] Márquez-Vera, C., Cano, A., Romero, C., Ventura, S. (2013). Predicting student failure at school using genetic programming and different data mining approaches with high dimensional and imbalanced data. Applied Intelligence, 38(3): 315-330. https://doi.org/10.1007/s10489-012-0374-8
[38] Guarín, J.C., Guzmán, E.L., González, F.A. (2015). A model to predict low academic performance at a specific enrollment using data mining. IEEE Revista Iberoamericana de Tecnologias del Aprendizaje, 10(3): 119-125. https://doi.org/10.1109/RITA.2015.2452632
[39] Al-Barrak, M.A., Al-Razgan, M. (2016). Predicting students final GPA using decision trees: A case study. International Journal of Information and Education Technology, 6(7): 528-533. https://doi.org/10.7763/IJIET.2016.V6.745
[40] Rezk, S.S., Selim, K.S. (2024). Metaheuristic-based ensemble learning: An extensive review of methods and applications. Neural Computing and Applications, 36: 17931-17959. https://doi.org/10.1007/s00521-024-10203-4
[41] Yang, X.S. (2010). Engineering Optimization: An Introduction with Metaheuristic Applications. Hoboken, NJ, USA, Wiley. https://doi.org/10.1002/9780470640425
[42] Michalewicz, Z., Fogel, D.B. (2004). How to Solve It: Modern Heuristics. Berlin, Germany, Springer, pp. 1-554. https://doi.org/10.1007/978-3-662-07807-5
[43] Verbert, K., Duval, E., Klerkx, J., Govaerts, S., Santos, J.L. (2013). Learning analytics dashboard applications. American Behavioral Scientist, 57(10): 1500-1509. https://doi.org/10.1177/0002764213479363
[44] Aguiar, E., Lakkaraju, H., Bhanpuri, N., Miller, D., Yuhas, B., Addison, K.L. (2015). Who, when, and why: A machine learning approach to prioritizing students at risk of not graduating high school on time. In Proceedings of the 5th International Conference on Learning Analytics and Knowledge, Poughkeepsie, NY, USA, pp. 93-102. https://doi.org/10.1145/2723576.2723619
[45] Macfadyen, L.P., Dawson, S. (2010). Mining LMS data to develop an “early warning system” for educators: A proof of concept. Computers & Education, 54(2): 588-599. https://doi.org/10.1016/j.compedu.2009.09.008
[46] Little, R.J.A., Rubin, D.B. (2019). Statistical Analysis with Missing Data. Hoboken, NJ, USA, Wiley. https://doi.org/10.1002/9781119013563
[47] Kuhn, M., Johnson, K. (2013). Applied Predictive Modeling. New York, NY, USA, Springer. https://doi.org/10.1007/978-1-4614-6849-3
[48] Hastie, T., Tibshirani, R., Friedman, J. (2009). The Elements of Statistical Learning: Data Mining, Inference, and Prediction. New York, NY, USA, Springer, pp. 1-745. https://doi.org/10.1007/978-0-387-84858-7
[49] Pedregosa, F., Varoquaux, G., Gramfort, A., et al. (2011). Scikit-learn: Machine learning in Python. The Journal of Machine Learning Research, 12: 2825-2830. https://www.jmlr.org/papers/volume12/pedregosa11a/pedregosa11a.pdf?source=post_page.
[50] García, S., Luengo, J., Herrera, F. (2015). Data Preprocessing in Data Mining. Cham, Switzerland, Springer, pp. 1-320. https://doi.org/10.1007/978-3-319-10247-4
[51] Han, J., Kamber, M., Pei, J. (2012). Data Mining: Concepts and Techniques. Waltham, MA, USA, Morgan Kaufmann. https://doi.org/10.1016/C2009-0-61819-5
[52] Witten, I.H., Frank, E., Hall, M.A., Pal, C.J. (2005). Practical machine learning tools and techniques. In Data Mining, pp. 403-413.
[53] Brownlee, J. (2020). Data Preparation for Machine Learning: Data Cleaning, Feature Selection, and Data Transforms in Python. Machine Learning Mastery, pp. 1-381.
[54] He, H.B., Garcia, E.A. (2009). Learning from imbalanced data. IEEE Transactions on Knowledge and Data Engineering, 21(9): 1263-1284. https://doi.org/10.1109/TKDE.2008.239
[55] Zhou, Z.H. (2012). Ensemble Methods: Foundations and Algorithms. Boca Raton, FL, USA, CRC Press, pp. 1-343. https://doi.org/10.1201/9781003587774
[56] Kuncheva, L.I. (2004). Combining Pattern Classifiers: Methods and Algorithms. Hoboken, NJ, USA, Wiley, pp. 1-350. https://doi.org/10.1002/0471660264
[57] Woźniak, M., Graña, M., Corchado, E. (2014). A survey of multiple classifier systems as hybrid systems. Information Fusion, 16: 3-17. https://doi.org/10.1016/j.inffus.2013.04.006
[58] Chawla, N.V., Bowyer, K.W., Hall, L.O., Kegelmeyer, W.P. (2002). SMOTE: Synthetic minority over-sampling technique. Journal of Artificial Intelligence Research, 16: 321-357. https://doi.org/10.1613/jair.953
[59] Galar, M., Fernández, A., Barrenechea, E., Bustince, H., Herrera, F. (2012). A review on ensembles for the class imbalance problem: Bagging-, boosting-, and hybrid-based approaches. IEEE Transactions on Systems, Man, and Cybernetics, Part C (Applications and Reviews), 42(4): 463-484. https://doi.org/10.1109/TSMCC.2011.2161285
[60] Krawczyk, B. (2016). Learning from imbalanced data: Open challenges and future directions. Progress in Artificial Intelligence, 5(4): 221-232. https://doi.org/10.1007/s13748-016-0094-0
[61] Sokolova, M., Lapalme, G. (2009). A systematic analysis of performance measures for classification tasks. Information Processing & Management, 45(4): 427-437. https://doi.org/10.1016/j.ipm.2009.03.002
[62] Fawcett, T. (2006). An introduction to ROC analysis. Pattern Recognition Letters, 27(8): 861-874. https://doi.org/10.1016/j.patrec.2005.10.010
[63] Chicco, D., Jurman, G. (2020). The advantages of the Matthews correlation coefficient over F1 score and accuracy in binary classification evaluation. BMC Genomics, 21: 6. https://doi.org/10.1186/s12864-019-6413-7