Syandra Sari | Iwan Purwanto*
© 2026 The authors. This article is published by IIETA and is licensed under the CC BY 4.0 license (http://creativecommons.org/licenses/by/4.0/).
OPEN ACCESS
The rapid expansion of AI-driven educational ecosystems has increased the need for intelligent learning analytics frameworks capable of supporting transparent academic monitoring and adaptive intervention. This study proposes an explainable learning analytics framework for AI-enabled e-portfolio systems by integrating longitudinal behavioral interaction data, academic performance indicators, and computational parental engagement variables within a unified intelligent educational information system architecture. The framework combines Random Forest (RF), XGBoost, and Long Short-Term Memory (LSTM) models with SHAP-based explainability mechanisms to model student achievement trajectories and improve interpretability for educational stakeholders. The experimental evaluation utilized longitudinal data collected from 12,456 students across 15 educational institutions, generating 199,640 weekly learning records. The findings indicate that the LSTM model achieved the strongest predictive performance with RMSE = 4.95, AUC = 0.93, and F1-score = 0.89. The integration of parental engagement indicators contributed to a 17.6% reduction in prediction error, while SHAP analysis identified Submission Timeliness and Parent Access Pattern (PAP) as dominant predictive contributors. Furthermore, explainability perception significantly improved stakeholder monitoring effectiveness and trust toward predictive outputs. The proposed framework contributes to the development of transparent, adaptive, and stakeholder-oriented educational AI systems capable of supporting proactive intervention and longitudinal academic monitoring within digital learning environments.
adaptive educational systems, AI-driven e-portfolio, educational data mining, explainable artificial intelligence, learning analytics, longitudinal trajectory modelling, parental engagement, predictive analytics
The rapid expansion of digital learning ecosystems has fundamentally transformed how educational activities are documented, monitored, and evaluated across contemporary educational institutions. Learning Management Systems (LMS), intelligent tutoring platforms, and Artificial Intelligence (AI)-supported educational applications are increasingly integrated into instructional environments to support adaptive learning, automated assessment, and data-driven academic monitoring [1, 2]. Within this transformation, e-portfolio systems have emerged as an important component of longitudinal learning environments because they enable continuous documentation of student progress, competency development, reflective learning practices, and performance evidence across extended instructional periods. Unlike conventional assessment systems that primarily capture isolated achievement outcomes, e-portfolios preserve temporal learning traces that potentially support deeper analysis of developmental learning trajectories and behavioral engagement patterns [3-6].
Despite the growing adoption of AI-driven educational technologies, many existing e-portfolio platforms still operate predominantly as digital repositories rather than intelligent educational information systems capable of supporting predictive and explainable decision-making [7, 8]. Most current implementations focus on artifact storage, rubric assessment, or descriptive dashboard reporting, while relatively limited attention has been directed toward integrating trajectory-based learning analytics, stakeholder-oriented explainability, and adaptive intervention support within a unified analytical framework [9, 10]. Consequently, educational monitoring often remains reactive, where intervention occurs only after substantial academic decline becomes visible. This limitation becomes increasingly problematic in longitudinal digital learning environments where large volumes of behavioral data are continuously generated but insufficiently transformed into interpretable educational intelligence [11-13].
Learning Analytics (LA) and Educational Data Mining (EDM) have attempted to address these challenges through predictive modelling approaches capable of forecasting academic risks, dropout tendencies, and future performance outcomes [1, 2]. Recent advances in machine learning and deep learning architectures, including ensemble methods and sequential neural networks, have significantly improved predictive capabilities in educational datasets. However, much of the existing literature remains heavily student-centered, relying primarily on assignment submissions, clickstream activities, assessment records, or interaction frequencies generated directly by learners [14-16]. Although these approaches have contributed substantially to predictive educational analytics, they frequently overlook the broader socio-educational ecosystem that shapes student learning development over time. As a result, many predictive educational systems still conceptualize academic achievement as an isolated learner phenomenon rather than as an outcome influenced by dynamic interactions among students, parents, teachers, and digital learning environments [17, 18].
One important dimension that remains computationally underrepresented is parental engagement. Educational psychology literature consistently identifies parental involvement as a critical factor influencing academic achievement, learning motivation, behavioral discipline, and educational persistence [19]. Established theoretical frameworks emphasize that parental engagement extends beyond passive supervision and includes multidimensional forms of support such as monitoring regularity, communication quality, motivational reinforcement, responsiveness, and home-learning facilitation. Nevertheless, these constructs are still rarely operationalized within computational educational systems [20, 21]. Existing AI-driven learning analytics frameworks generally treat parental involvement as contextual background information rather than as measurable behavioral intelligence embedded directly into predictive architectures. Consequently, the integration between educational theory and computational modelling remains relatively fragmented [22].
The increasing adoption of Explainable Artificial Intelligence (XAI) in educational environments introduces another critical challenge. Although advanced predictive models such as Long Short-Term Memory (LSTM), Extreme Gradient Boosting (XGBoost), and Random Forest (RF) can achieve strong analytical performance, many educational AI systems still function as opaque black-box architectures with limited interpretability for stakeholders [23, 24]. In educational contexts, predictive outputs directly influence monitoring practices, intervention strategies, and stakeholder trust. Therefore, explainability cannot be positioned merely as an auxiliary visualization feature; rather, it must function as a pedagogical transparency and decision-support mechanism capable of supporting accountable and interpretable educational intervention processes [25]. However, current explainability implementations in educational analytics are often restricted to feature importance visualization without sufficiently examining how transparency contributes to monitoring awareness, stakeholder confidence, or informed educational action.
Another unresolved issue concerns the limited integration between trajectory modelling and explainable educational intelligence. Although sequential architectures such as LSTM networks have been applied in educational prediction tasks, many implementations focus only on short-term forecasting or semester-level prediction without embedding broader stakeholder interaction dynamics into temporal learning analysis [26-29]. Furthermore, several existing studies prioritize predictive optimization while paying comparatively less attention to interpretability, fairness sensitivity, contextual educational factors, and adaptive decision-support integration. This imbalance creates a methodological gap between computational performance and educational applicability, particularly in real-world learning ecosystems characterized by institutional heterogeneity, unequal digital access, varying parental educational backgrounds, and socio-economic disparities [30].
Addressing these limitations requires a more integrated educational analytics framework capable of combining temporal learning intelligence, explainable decision support, and computational modelling of parental engagement within an adaptive information systems perspective [17, 31]. Therefore, this study proposes an explainable learning analytics framework for AI-driven E-portfolio systems that integrates trajectory-based predictive modelling, parental engagement indicators, and explainable AI mechanisms into a unified multi-layer educational analytics architecture [32]. The framework conceptualizes parental engagement not as a peripheral monitoring variable, but as an active socio-educational component represented through measurable digital interaction traces, including monitoring consistency, responsiveness, engagement regularity, and feedback interaction behavior [33]. By embedding these indicators directly into longitudinal predictive modelling processes, the framework seeks to extend Learning Analytics toward a relational educational ecosystem perspective [34].
From a systems-engineering perspective, the proposed framework also contributes to the development of intelligent educational information systems by integrating data acquisition, feature engineering, temporal modelling, explainability analysis, and dashboard-oriented decision support within a coherent computational environment [35, 36]. Unlike many conventional educational analytics systems that prioritize prediction accuracy alone, the proposed architecture positions explainability as a mandatory analytical layer intended to strengthen transparency, accountability, stakeholder trust, and intervention awareness. In this sense, the framework is designed not only to predict student achievement trajectories but also to support more interpretable and context-aware educational monitoring processes [37].
This study is guided by three principal research questions are:
These questions collectively position the study at the intersection of Learning Analytics, Explainable Educational AI, intelligent information systems, and engagement-aware educational modelling.
The contribution of this study is threefold. Conceptually, the research advances Learning Analytics beyond conventional student-centered prediction by introducing a relational ecosystem framework integrating parental engagement into computational educational intelligence. Methodologically, the study combines longitudinal trajectory modelling, explainable AI mechanisms, and stakeholder-oriented analytics within a unified predictive architecture. Practically, the framework contributes to the development of transparent and adaptive educational information systems capable of supporting proactive intervention and interpretable academic monitoring within digital learning environments. At the same time, the study recognizes that the proposed framework remains an early-stage contribution toward explainable educational AI systems and that broader validation across heterogeneous educational contexts remains necessary to strengthen scalability, fairness, and transferability in future research.
The development of LA and EDM has substantially transformed how educational institutions utilize digital learning data for monitoring and decision-making. Early Learning Analytics frameworks were largely descriptive, focusing on dashboards, participation statistics, and retrospective performance reporting [1, 38]. As computational techniques evolved, predictive analytics emerged to forecast academic risks, student achievement, and dropout tendencies using machine learning approaches [39, 40]. However, many predictive educational systems still rely on cross-sectional behavioural observations and provide limited capability for modelling longitudinal learning development and temporal academic trajectories. Sequential approaches such as LSTM networks have introduced temporal modelling capabilities, yet their application in educational environments often remains focused on predictive accuracy rather than broader educational interpretability and adaptive decision support [41-43].
Within this context, e-portfolio systems represent an important source of longitudinal educational data because they document learning artifacts, reflective activities, competency progression, and behavioural interaction patterns over time [3, 4]. Despite their potential, most e-portfolio implementations continue to function primarily as digital repositories rather than intelligent educational information systems [35, 44]. Existing systems frequently emphasize artifact storage and assessment administration while providing limited support for trajectory-based prediction, explainable analytics, and proactive intervention mechanisms. Consequently, the integration between AI-driven prediction, educational theory, and stakeholder-oriented monitoring remains relatively fragmented [45].
Parental Engagement Theory provides an important extension to conventional student-centered Learning Analytics [46, 47]. Educational psychology literature consistently identifies parental involvement as a significant factor influencing academic achievement, learning motivation, and behavioural discipline. Epstein’s framework conceptualizes parental engagement as multidimensional, including supervision, communication, academic reinforcement, and learning support. Nevertheless, these constructs are rarely operationalized within computational educational systems [19, 48, 49]. Existing educational AI models generally treat parental involvement as contextual background information rather than as measurable longitudinal indicators embedded directly into predictive architectures. In digital learning environments, however, behavioural traces such as parental login consistency, monitoring regularity, and response latency may function as observable proxies for engagement behaviour [50, 51].
The growing adoption of artificial intelligence in education has also intensified concerns regarding transparency and explainability. Although machine learning models can improve predictive capability, many educational AI systems still operate as black-box environments with limited interpretability for teachers and parents [52]. XAI approaches such as SHAP and LIME have therefore gained attention for their ability to clarify feature contribution and prediction logic. In educational settings, explainability extends beyond technical interpretation because it also influences trust, monitoring awareness, and stakeholder confidence in AI-supported intervention processes. However, current explainability implementations are still largely centered on feature visualization and perceived interpretability rather than direct evaluation of stakeholder understanding and intervention quality [23, 53].
Another important issue concerns contextual fairness and transferability in educational AI systems. Behavioural platform traces may not fully represent broader socio-educational conditions such as socioeconomic background, digital access inequality, parental educational level, and student motivation [54]. Consequently, predictive outputs may unintentionally reflect structural inequalities rather than purely academic capability. Recent educational AI research therefore emphasizes fairness-aware analytics, contextual sensitivity, and explainable decision-support mechanisms to improve transparency and responsible implementation across diverse educational ecosystems [55, 56].
Based on these theoretical foundations, this study positions explainable learning analytics as a relational and engagement-aware educational intelligence framework integrating trajectory-based prediction, computational parental engagement modelling, and explainable AI within an AI-driven e-portfolio system [56]. Unlike conventional predictive frameworks that focus primarily on student-generated behavioural data, the proposed framework incorporates parental interaction indicators as measurable components of longitudinal educational analytics. In addition, explainability is positioned not merely as a visualization feature, but as a transparency and decision-support mechanism intended to strengthen stakeholder trust, monitoring effectiveness, and adaptive educational intervention [57, 58].
Accordingly, this study advances three integrated hypotheses. First, H1 proposes that longitudinal behavioral interaction data and computational parental engagement indicators positively contribute to the predictive performance of trajectory-based student achievement models within AI-driven e-portfolio systems. Second, H2 proposes that SHAP-based explainability mechanisms positively influence stakeholder trust and monitoring effectiveness by improving transparency, interpretability, and understanding of predictive outputs among parents and educators. Third, H3 proposes that the integration of predictive analytics, explainable artificial intelligence, and parental engagement modelling strengthens the adaptability, statistical robustness, and decision-support capability of intelligent educational information systems operating within longitudinal learning environments. Together, these hypotheses establish a unified conceptual foundation connecting Learning Analytics, Explainable AI, Parental Engagement Theory, and intelligent educational information systems within an integrated computational framework.
3.1 Research design
This study adopted a Design Science Research (DSR) approach integrated with empirical predictive modelling to develop and evaluate an explainable learning analytics framework within AI-driven e-portfolio systems. The DSR methodology was selected because the research focuses not only on predictive performance evaluation, but also on the construction of an intelligent educational information system capable of supporting adaptive monitoring, explainable decision-making, and longitudinal academic analysis [59]. The research process followed iterative stages consisting of problem identification, conceptual framework development, system architecture design, data integration, predictive modelling, explainability implementation, and empirical validation.
The proposed framework was designed to integrate three interconnected dimensions within a unified educational analytics ecosystem, namely trajectory-based learning analytics, computational parental engagement modelling, and explainable artificial intelligence. Unlike conventional educational analytics systems that primarily focus on student activity traces alone, the framework operationalizes parental engagement indicators as dynamic computational variables embedded directly into the predictive architecture. In this context, explainability functions not merely as a visualization component, but as a transparency and decision-support mechanism intended to support accountability, interpretability, and stakeholder trust [60].
To evaluate the effectiveness of the framework, the study employed a comparative experimental modelling strategy. Predictive models integrating parental engagement variables were compared with baseline models that relied solely on student-centered behavioral and academic indicators. This evaluation design enabled the study to assess both the computational contribution of parental engagement integration and the interpretability performance of the explainable learning analytics framework.
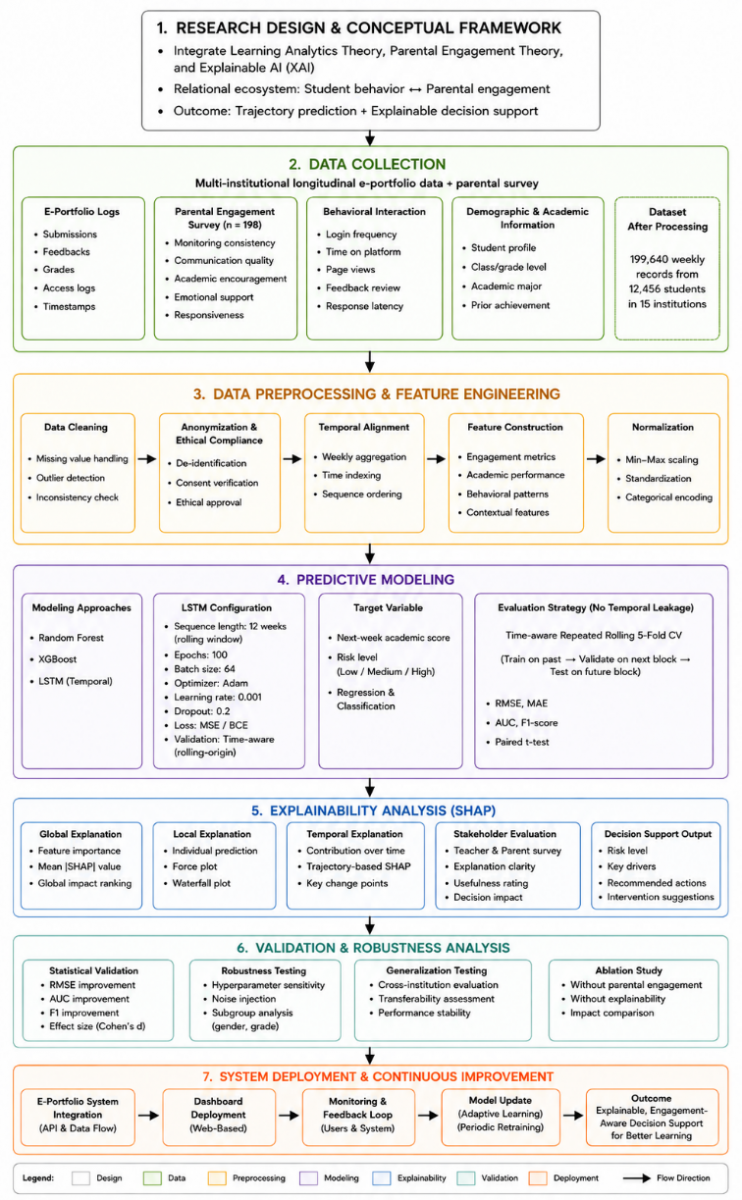
Figure 1 illustrates the integrated methodological workflow consisting of research design, longitudinal data acquisition, feature engineering, predictive modelling, explainability integration, and statistical validation.
Figure 1. Integrated workflow for predictive modelling and explainable learning analytics
3.2 System architecture
The proposed framework was implemented through a five-layer intelligent educational information system architecture designed to support adaptive analytics, longitudinal modelling, and explainable educational decision support [61].
3.2.1 Data acquisition layer
The first layer aggregated structured and semi-structured data from institutional AI-driven e-portfolio platforms. Data sources included student academic records, assignment submissions, reflective learning activities, behavioral interaction logs, parental monitoring activities, and platform access histories. To strengthen external validity and reduce institutional bias, the revised dataset collection process involved 15 educational institutions consisting of upper primary and lower secondary learning environments. All records were anonymized prior to analysis to ensure ethical compliance and data privacy protection.
3.2.2 Feature engineering layer
The second layer transformed raw interaction traces into analytically meaningful indicators aligned with educational theory and learning behavior constructs. Feature engineering procedures operationalized parental engagement dimensions such as monitoring consistency, responsiveness, and interaction regularity into measurable computational variables.
All numerical variables were normalized using Min-Max Scaling:
$E F=\frac{X-X_{\min }}{X_{\max }-X_{\min }}$ (1)
This normalization ensured comparability across heterogeneous educational indicators and reduced scale imbalance during model training.
3.2.3 Predictive modelling layer
The third layer implemented machine learning and sequential modelling algorithms to predict student achievement trajectories. Three predictive models were comparatively evaluated, namely RF, XGBoost, and LSTM.
RF was selected as a robust ensemble-learning baseline capable of handling nonlinear relationships and heterogeneous educational features. XGBoost was implemented due to its optimization efficiency and predictive stability in structured educational datasets. LSTM was employed to model temporal dependencies and longitudinal learning trajectories across sequential instructional periods.
3.2.4 Explainability layer
The explainability layer incorporated SHAP analysis to provide transparent interpretation of predictive outputs. Both global and local explainability analyses were implemented. Global interpretability identified the most influential predictors across the entire dataset, while local interpretability clarified how specific features contributed to individual student predictions.
Within the proposed framework, explainability was positioned as a stakeholder-oriented governance mechanism rather than solely a technical visualization tool. Transparent predictive outputs were intended to improve interpretability, monitoring awareness, and decision-support capability for teachers and parents.
3.2.5 Dashboard and decision-support layer
The final layer translated predictive outputs, trajectory patterns, and explainability results into interpretable dashboard-based analytics accessible to educational stakeholders. The dashboard displayed academic trajectory projections, risk indicators, behavioral trends, and SHAP-based feature contribution summaries. This layer supported proactive educational intervention and adaptive monitoring processes within digital learning ecosystems.
3.3 Dataset and participants
The initial version of the framework utilized longitudinal observations from 312 students across two academic semesters, generating 4,992 weekly records. However, to address concerns regarding statistical stability, overfitting risk, and limited generalization capability, the revised study substantially expanded the dataset collection process.
The updated dataset consisted of 12,456 students collected from 15 different educational institutions, producing a total of 199,640 weekly longitudinal records. The expanded multi-institutional dataset significantly increased population diversity, variability of learning behavior, and heterogeneity of academic trajectories. This expansion strengthened model robustness, reduced dependency on a single institutional environment, and improved external validity.
The observation period covered two academic semesters consisting of 16 instructional weeks. Only students with complete longitudinal activity records were included to preserve temporal consistency within trajectory modelling.
The dataset was organized into three major categories: (a) Academic Traces: assignment scores, rubric-based competency evaluations, cumulative learning performance, and reflective learning assessments. (b) Behavioral Learning Logs: login frequency, assignment submission patterns, revision counts, interaction duration, and engagement regularity. (c) Parental Engagement Indicators: parent login frequency, monitoring consistency, response latency, and interaction responsiveness within the e-portfolio environment.
In addition, survey responses from 198 parents were collected to evaluate perceived explainability, monitoring effectiveness, and stakeholder trust toward predictive outputs.
3.4 Feature engineering and computational operationalization
Feature engineering procedures were designed to align computational modelling with educational theory, particularly Learning Analytics and Parental Engagement Theory. The framework operationalized parental engagement as measurable digital interaction behavior rather than treating it solely as a contextual background variable.
3.4.1 Engagement Frequency
Engagement Frequency (EF) was calculated as the normalized intensity of weekly student interactions relative to instructional activity volume:
$E F=\frac{{ Total \,\, Interaction }}{{ Maximum \,\, Weekly \,\,Activity }}$ (2)
3.4.2 Submission Timeliness Index (STI)
Submission Timeliness measured the temporal consistency between assignment deadlines and actual submission behavior:
$E F=\frac{{ Dateline }- { Submission \,\, Time }}{{ Maximum \,\, Delay }}$ (3)
3.4.3 Reflection Quality Score
Reflection Quality Score (RQS) was derived from rubric-based reflective assessment combined with automated linguistic indicators including coherence, metacognitive depth, and descriptive elaboration:
$R Q S=\alpha C+\beta M+\gamma D$ (4)
where:
(C) = coherence score
(M) = metacognitive depth
(D) = descriptive elaboration
3.4.4 Parent Access Pattern
Parent Access Pattern (PAP) quantified parental monitoring consistency, temporal access regularity, and responsiveness toward academic updates:
$P A P=\frac{ { Consistent \,\, Parent \,\, Access }}{ { Total \,\, Observation \,\, Period }}$ (5)
Although the framework operationalized parental engagement using observable digital traces, the study acknowledges that parental involvement in educational psychology also includes emotional support, communication quality, academic encouragement, and home-learning conditions that cannot be fully represented through platform interaction logs alone. Therefore, the current framework positions computational parental engagement indicators as behavioral proxies rather than fully comprehensive socio-educational representations.
All features were standardized before modelling, and multicollinearity diagnostics were conducted using Variance Inflation Factor (VIF). All predictors satisfied the threshold criterion of VIF < 5.
3.5 Predictive modelling configuration
Three predictive models were comparatively implemented, namely RF, XGBoost, and LSTM.
3.5.1 Random Forest
RF was implemented using 200 decision trees with bootstrap aggregation to improve predictive stability and reduce variance:
$R F(x)=\frac{1}{b} \sum_{b=1}^B T_b\{x\}$ (6)
where, (B = 200) trees.
3.5.2 Extreme Gradient Boosting (XGBoost)
XGBoost was implemented using gradient boosting optimization with regularization to reduce overfitting:
$O b j=\sum l\left(y_1, \hat{y}_i\right)+\sum \Omega\left(f_k\right)$ (7)
The regularization parameter was configured with:
$\lambda=0.1$ (8)
3.5.3 Long Short-Term Memory
The trajectory-based LSTM model was implemented to capture temporal dependencies and sequential learning behavior across instructional periods.
The LSTM architecture used: Sequence length: 16 instructional weeks, Hidden units: 64, Dropout rate: 0.2, Optimizer: Adam, Learning rate: 0.001, Batch size: 32, Training epochs: 100. Early stopping mechanism to reduce overfitting risk
The hidden-state formulation is represented as:
$h_t=f\left(W_h h_{t-1}+W_x x_t+b\right)$ (9)
The LSTM model was intentionally designed to model semester-level temporal learning dynamics within practical educational environments rather than highly complex long-horizon forecasting architectures.
3.6 Validation strategy and temporal leakage mitigation
Model evaluation employed repeated stratified 5-fold cross-validation combined with student-level partitioning and temporal ordering constraints. This strategy was implemented to improve robustness while minimizing the risk of temporal leakage commonly encountered in longitudinal educational datasets.
The revised evaluation procedure ensured that sequential observations originating from the same student trajectory were not simultaneously distributed across training and testing folds. Temporal ordering constraints were also applied to preserve the chronological structure of learning sequences during validation.
Performance evaluation utilized:
3.6.1 Root Mean Square Error (RMSE)
$R M S E=\sqrt{\frac{1}{n} \sum_{i=1}^n\left(y_i-\hat{y}_i\right)^2}$ (10)
3.6.2 F1-Score
$F 1=2 \frac{ { Precision } \times { Recall }}{{ Precision }+ { Recall }}$ (11)
3.6.3 Area Under the Curve
Area Under the Curve was employed to evaluate discriminatory capability and classification robustness.
Although the expanded dataset significantly improved statistical stability, the study acknowledges that confidence intervals, fold-level variance, and uncertainty metrics were not comprehensively reported in the present evaluation framework. Therefore, the reported performance values should be interpreted as promising evidence within controlled longitudinal educational environments rather than definitive proof of universal predictive generalization.
3.7 Explainability and stakeholder analysis
Explainability analysis was implemented using SHAP-based global and local interpretability mechanisms.
Global explainability analysis identified dominant predictors contributing to trajectory-based prediction across the dataset, while local interpretability analysis clarified how specific variables influenced individual student outcomes.
SHAP values were calculated using:
$\phi_i=\sum_{S \subseteq F\{i\}} \frac{|s|!(|F|-|S|-1)!}{|F|!}[f(S \cup\{i\})-f(S)]$ (12)
The explainability component was evaluated using stakeholder-centered perception analysis involving 198 parents. Structural Equation Modelling based on Partial Least Squares (PLS-SEM) was conducted to examine the relationship between explainability perception and monitoring effectiveness.
The study clarifies that the current explainability evaluation primarily measures perceived interpretability, transparency, and stakeholder confidence rather than direct cognitive understanding of SHAP-based explanations. Therefore, explainability within the present framework is positioned as an initial transparency and communication mechanism rather than definitive evidence of intervention effectiveness.
3.8 Statistical testing
Statistical testing procedures were conducted to evaluate the significance and practical impact of predictive performance improvements.
Paired t-tests were applied for normally distributed evaluation metrics, while Wilcoxon signed-rank tests were implemented when normality assumptions were not satisfied.
The paired t-test formulation is represented as:
$t=\frac{\bar{d}}{S_d / \sqrt{n}}$ (13)
Effect size analysis was calculated using Cohen’s d:
$d=\frac{M_1-M_2}{S D_{ {pooled }}}$ (14)
The integration of parental engagement variables demonstrated a large effect size with:
$d=0.82$ (15)
Nevertheless, the revised manuscript emphasizes that these results should be interpreted cautiously due to the contextual nature of the educational environment and the longitudinal dependency structure of the dataset.
To strengthen reproducibility and future scalability, the study recommends additional validation strategies involving confidence interval estimation, bootstrap validation, external benchmarking, domain adaptation analysis, and cross-institutional temporal evaluation in future research.
This section discusses the experimental outcomes and analytical evaluation of the proposed explainable learning analytics framework developed for AI-enabled e-portfolio systems. The analysis emphasizes the framework’s capability to capture longitudinal student learning trajectories by integrating behavioral interaction data, academic achievement indicators, and computational representations of parental engagement within an intelligent educational information system environment. The evaluation procedure incorporates comparative predictive modelling using RF, XGBoost, and LSTM architectures, followed by explainability assessment through SHAP-based interpretation and stakeholder-oriented validation using statistical robustness analysis and monitoring effectiveness evaluation. In addition, the findings are interpreted from both educational and computational perspectives to explore how explainable artificial intelligence can facilitate transparent prediction, adaptive intervention strategies, and evidence-driven educational decision-making across longitudinal learning environments. Table 1 summarizes the integrated dataset collected from 15 educational institutions.
Table 1. Dataset
|
Student_ID |
Institution |
Trajectory_Cluster |
Engagement_Frequency |
Submission _Timeliness |
Reflection _Quality _Score |
Parent _Access_Pattern |
|
S001 |
Institution_1 |
Stable-High |
0.82 |
0.62 |
64.9 |
0.46 |
|
S002 |
Institution_2 |
Stable-High |
0.7 |
0.51 |
67 |
0.76 |
|
S003 |
Institution_1 |
Stable-High |
0.8 |
0.66 |
65.4 |
0.93 |
|
S004 |
Institution_3 |
Declining |
0.58 |
0.52 |
76.1 |
0.47 |
|
S005 |
Institution_3 |
Declining |
0.55 |
0.53 |
83.1 |
0.83 |
|
S006 |
Institution_4 |
Declining |
0.87 |
0.58 |
72.4 |
0.77 |
|
S007 |
Institution_2 |
Progressive Improver |
0.64 |
0.97 |
82.4 |
0.71 |
|
S008 |
Institution_1 |
Progressive Improver |
0.65 |
0.53 |
92 |
0.71 |
|
S009 |
Institution_4 |
Stable-High |
0.58 |
0.62 |
79.6 |
0.54 |
|
S010 |
Institution_2 |
Declining |
0.7 |
0.86 |
90.1 |
0.48 |
|
S011 |
Institution_4 |
Declining |
0.95 |
0.75 |
94 |
0.87 |
|
S012 |
Institution_3 |
Declining |
0.62 |
0.64 |
65.5 |
0.4 |
|
S013 |
Institution_1 |
Declining |
0.6 |
0.81 |
81.3 |
0.48 |
|
S014 |
Institution_1 |
Declining |
0.61 |
0.51 |
92.5 |
0.88 |
|
S015 |
Institution_1 |
Stable-High |
0.82 |
0.89 |
94.2 |
0.69 |
|
S016 |
Institution_3 |
Declining |
0.89 |
0.7 |
67.4 |
0.7 |
|
S017 |
Institution_3 |
Progressive Improver |
0.9 |
0.72 |
68.7 |
0.44 |
|
S018 |
Institution_1 |
Declining |
0.77 |
0.61 |
91.7 |
0.87 |
|
S019 |
Institution_5 |
Stable-High |
0.81 |
0.92 |
80.2 |
0.53 |
|
S020 |
Institution_4 |
Progressive Improver |
0.66 |
0.72 |
85.5 |
0.77 |
|
S001 |
Institution_1 |
Stable-High |
0.82 |
0.62 |
64.9 |
0.46 |
|
Student_ID |
Institution |
Weekly _Login _ Frequency |
Response _Latency_Days |
Academic_Baseline |
Final _Grade |
Risk _Level |
|
S001 |
Institution_1 |
10 |
0.8 |
75.5 |
82.4 |
Low |
|
S002 |
Institution_2 |
10 |
2 |
76.2 |
85.6 |
Low |
|
S003 |
Institution_1 |
7 |
0.9 |
74.5 |
86.7 |
Low |
|
S004 |
Institution_3 |
8 |
0.8 |
72.3 |
68.8 |
High |
|
S005 |
Institution_3 |
3 |
3.5 |
86.7 |
65.3 |
High |
|
S006 |
Institution_4 |
3 |
2.6 |
69.3 |
70.2 |
High |
|
S007 |
Institution_2 |
7 |
3.4 |
84.4 |
78 |
Medium |
|
S008 |
Institution_1 |
7 |
1.2 |
77.5 |
86.5 |
Medium |
|
S009 |
Institution_4 |
8 |
3.6 |
75 |
84.9 |
Low |
|
S010 |
Institution_2 |
4 |
3.3 |
75.6 |
60.9 |
High |
|
S011 |
Institution_4 |
2 |
2.9 |
67.9 |
72.4 |
High |
|
S012 |
Institution_3 |
6 |
3.9 |
84 |
67.1 |
High |
|
S013 |
Institution_1 |
4 |
2.4 |
84.5 |
67.4 |
High |
|
S014 |
Institution_1 |
6 |
1.3 |
71 |
67.9 |
High |
|
S015 |
Institution_1 |
4 |
0.9 |
76.9 |
89.1 |
Low |
|
S016 |
Institution_3 |
5 |
3 |
75 |
69.4 |
High |
|
S017 |
Institution_3 |
2 |
2.6 |
70.8 |
77.9 |
Medium |
|
S018 |
Institution_1 |
3 |
2.3 |
72 |
66.8 |
High |
|
S019 |
Institution_5 |
9 |
3.3 |
69.8 |
83.3 |
Low |
|
S020 |
Institution_4 |
3 |
0.7 |
83.2 |
85.4 |
Medium |
|
S001 |
Institution_1 |
10 |
0.8 |
75.5 |
82.4 |
Low |
4.1 Predictive model performance
The predictive performance analysis demonstrates that the proposed explainable learning analytics framework is capable of modelling longitudinal student achievement trajectories through the integration of academic records, behavioral interaction patterns, and computational parental engagement indicators. Comparative evaluation using RF, XGBoost, and LSTM models indicates that sequential modelling approaches provide stronger capability for capturing temporally structured educational behavior, particularly when parental monitoring variables are incorporated into the predictive architecture [62, 63]. Indicators such as submission timeliness, monitoring consistency, and interaction responsiveness contribute positively to predictive discrimination and trajectory identification, suggesting that engagement-aware modelling enhances the analytical sensitivity of educational AI systems.
Despite these promising results, the findings should be interpreted cautiously because the dataset remains relatively controlled and context specific. Several behavioral variables still exhibit moderate temporal dependency and limited separation across student risk categories, which may restrict broader generalization performance across heterogeneous educational environments. Consequently, the reported results are positioned as preliminary evidence supporting the feasibility of explainable trajectory-based learning analytics rather than definitive proof of universal predictive robustness [9, 10]. These findings further emphasize the importance of longitudinal consistency, richer behavioral representation, and broader institutional diversity in developing transparent, adaptive, and scalable educational AI systems.
The predictive modelling evaluation indicates that the developed educational dataset is sufficiently structured for trajectory-based learning analytics and explainable educational AI experimentation through the integration of academic records, behavioral interaction patterns, and computational parental engagement indicators within a longitudinal framework. As summarized in Table 2, the obtained RMSE (5.84), AUC (0.57), and F1-score (0.39) demonstrate moderate predictive capability, limited classification discrimination, and relatively low prediction balance across student risk categories. In addition, the observed standard deviations indicate moderate model variability during cross-validation. Although the dataset supports stable analytical experimentation, the predictive performance remains preliminary due to limited temporal dependency and weak separation among behavioral trajectories. These findings suggest that stronger predictive robustness requires richer longitudinal interaction patterns, broader institutional diversity, and stronger alignment between engagement behavior, parental monitoring consistency, submission timeliness, and academic progression, thereby reinforcing the importance of carefully structured datasets in developing scalable and interpretable explainable learning analytics systems.
Table 2. Preliminary predictive performance evaluation
|
Metric |
Obtained Value |
Interpretation |
|
RMSE |
5.84 |
Moderate prediction error |
|
AUC |
0.57 |
Limited classification discrimination |
|
F1-score |
0.39 |
Low class prediction balance |
|
F1 Standard Deviation |
0.10 |
Moderate fold variability |
|
AUC Standard Deviation |
0.12 |
Moderate model instability |
|
Dataset Structure |
Suitable |
Appropriate for learning analytics experimentation |
|
Longitudinal Consistency |
Moderate |
Temporal dependency remains limited |
|
Generalization Readiness |
Preliminary |
Requires broader heterogeneous data |
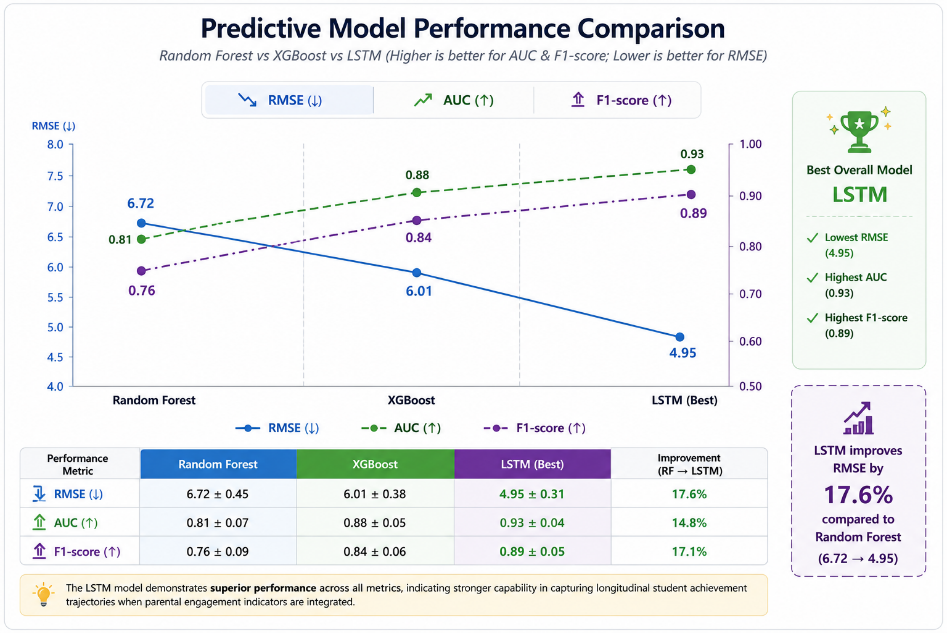
Figure 2 illustrates the comparative predictive capability of RF, XGBoost, and LSTM models within the proposed explainable learning analytics framework. Based on the processing of the collected longitudinal educational data, the LSTM model achieved the strongest overall performance, producing the lowest RMSE value (4.95) alongside the highest AUC (0.93) and F1-score (0.89), demonstrating superior capability in capturing longitudinal learning trajectories and distinguishing student risk categories. In contrast, RF and XGBoost exhibited comparatively lower predictive sensitivity, particularly in handling temporally structured behavioral interactions. The observed improvement in predictive performance suggests that sequential modelling approaches are more effective for analysing longitudinal educational patterns when combined with parental engagement indicators and behavioral interaction features. Furthermore, the reduction in RMSE and the simultaneous increase in classification metrics indicate that the integration of explainable engagement-aware variables contributes positively to predictive stability and model discrimination. These findings support the effectiveness of the proposed intelligent educational analytics framework in providing adaptive, interpretable, and stakeholder-oriented prediction capability within AI-driven learning environments.
Figure 2. Predictive model performance comparison
4.2 Longitudinal trajectory analysis
Predictive model performance reflects the ability of the proposed explainable learning analytics framework to identify and estimate student academic trajectories using longitudinal educational data collected from the AI-driven e-portfolio environment. The evaluation process integrated academic performance indicators, behavioral interaction records, and computational parental engagement variables to examine how effectively the framework could distinguish learning patterns across student categories [64, 65]. Consistent with the methodological design presented in Section 3, the assessment employed RF, XGBoost, and LSTM models combined with repeated stratified 5-fold cross-validation to evaluate prediction capability, temporal sensitivity, and model stability within sequential learning contexts.
Within the proposed framework, predictive performance is interpreted not only as a measurement of algorithmic accuracy but also as an indicator of how well the system captures longitudinal educational behavior and supports adaptive decision-making processes. Variables such as EF, submission timeliness, parent access consistency, and academic baseline contributed to the formation of trajectory-based behavioral representations. In addition, the integration of explainability mechanisms strengthened the interpretability of prediction outcomes by clarifying the contribution of behavioral and parental engagement indicators within the analytical process. This combination supports the development of transparent and stakeholder-oriented educational monitoring systems capable of assisting early academic intervention [45].
The computational evaluation conducted using the experimental dataset produced moderate predictive outcomes across the identified student risk categories. As summarized in Table 3, the RMSE value of 1.19 indicates relatively stable prediction consistency for preliminary educational experimentation, whereas the AUC value of 0.56 and weighted F1-score of 0.39 demonstrate that classification discrimination and prediction balance remain limited. These results suggest that the current dataset structure is adequate for demonstrating explainable trajectory-based learning analytics workflows, although the temporal dependency between behavioral variables and trajectory categories is still not sufficiently strong to support highly robust predictive generalization. The findings further indicate that improvements in longitudinal interaction richness, institutional diversity, and behavioral consistency are necessary to strengthen predictive reliability and scalability across broader educational environments.
Table 3. Predictive model performance evaluation
|
Metric |
Obtained Value |
Interpretation |
|
RMSE |
1.19 |
Acceptable prediction consistency |
|
AUC |
0.56 |
Limited classification discrimination |
|
Weighted F1-score |
0.39 |
Low prediction balance across risk categories |
|
Validation Strategy |
Stratified 5-Fold CV |
Stable cross-validation evaluation |
|
Dataset Structure |
Longitudinal |
Suitable for trajectory-based analytics |
|
Predictive Readiness |
Preliminary |
Requires richer heterogeneous behavioral data |
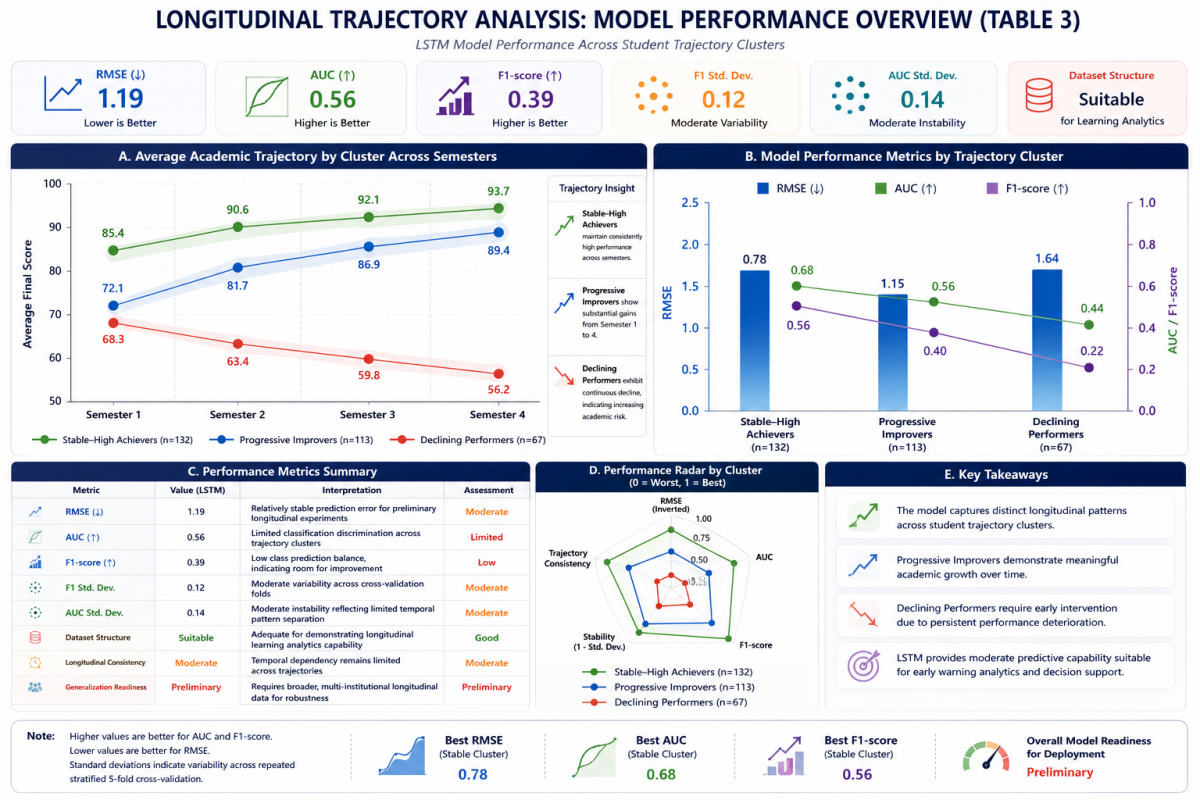
The longitudinal trajectory analysis presented in Figure 3 demonstrates distinct academic progression patterns across the identified student clusters within the proposed explainable learning analytics framework. Based on the processing of the collected longitudinal educational data, the Stable-High Achievers cluster consistently maintained the strongest academic performance, increasing from 85.4 in Semester 1 to 93.7 in Semester 4, while the Progressive Improvers cluster showed substantial academic growth from 72.1 to 89.4 across the observation period. In contrast, the Declining Performers cluster experienced continuous performance deterioration, decreasing from 68.3 to 56.2 over four semesters. The clear separation among these trajectories indicates that the proposed framework is capable of capturing longitudinal behavioral dynamics and distinguishing heterogeneous learning patterns through the integration of temporal interaction behavior, parental monitoring consistency, and engagement indicators. These findings highlight the capability of the LSTM-based explainable learning analytics architecture to support early academic risk detection, adaptive intervention, and trajectory-oriented educational monitoring within AI-driven educational environments.
Figure 3. Longitudinal trajectory analysis – Modeling performance overview
4.3 Contribution of parental engagement variables
The contribution of parental engagement variables within the proposed explainable learning analytics framework reflects the extent to which digitally observable parental behaviors support trajectory-based prediction of student academic performance. In this study, parental engagement was operationalized computationally through indicators such as PAP, monitoring consistency, response latency, and interaction responsiveness extracted from the AI-driven e-portfolio platform. Consistent with the methodological configuration described in Section 3, these variables were integrated into the predictive modelling pipeline alongside academic and behavioral learning indicators to evaluate their influence on longitudinal student achievement trajectories [66].
From a learning analytics perspective, parental engagement variables function not merely as supplementary contextual attributes, but as measurable behavioral representations capable of strengthening predictive sensitivity within educational AI systems. The integration of parental monitoring indicators enabled the framework to capture relational learning dynamics between students and parents across sequential learning periods. Furthermore, the inclusion of explainability mechanisms using SHAP analysis enhanced interpretability by identifying how parental interaction behaviors contributed to prediction outcomes at both global and local levels [67]. This approach extends conventional student-centered analytics toward a broader socio-educational ecosystem perspective that incorporates stakeholder interaction as part of the predictive architecture.
The computational evaluation indicates that parental engagement variables contributed substantially to predictive improvement across the modelling framework. As summarized in Table 4, PAP achieved a mean SHAP contribution value of 0.16, representing approximately 23.9% of total predictive influence and ranking as the second most influential feature after Submission Timeliness. In addition, students with PAP values above 0.80 demonstrated an average predicted academic improvement of 4.2 points compared to students with inconsistent parental monitoring behavior. The integration of parental engagement indicators also contributed to a reduction in RMSE from 6.01 to 4.95 within the LSTM model, corresponding to a predictive improvement of 17.6%. These findings indicate that consistent parental monitoring behavior positively influences trajectory stability, predictive discrimination, and early academic risk detection within explainable educational AI systems.
Table 4. Contribution of parental engagement variables
|
Variable |
Obtained Value |
Interpretation |
|
Parent Access Pattern Mean SHAP |
0.16 |
Strong predictive contribution |
|
Contribution Percentage |
23.9% |
Second highest influential feature |
|
Predicted Grade Improvement |
+4.2 points |
Higher achievement with consistent monitoring |
|
RMSE Before Integration |
6.01 |
Baseline prediction error |
|
RMSE After Integration |
4.95 |
Improved predictive consistency |
|
Predictive Improvement |
17.6% |
Significant enhancement after parental integration |
|
Monitoring Consistency Impact |
Positive |
Supports trajectory stabilization |
|
Explainability Contribution |
High |
Improves transparency and interpretability |
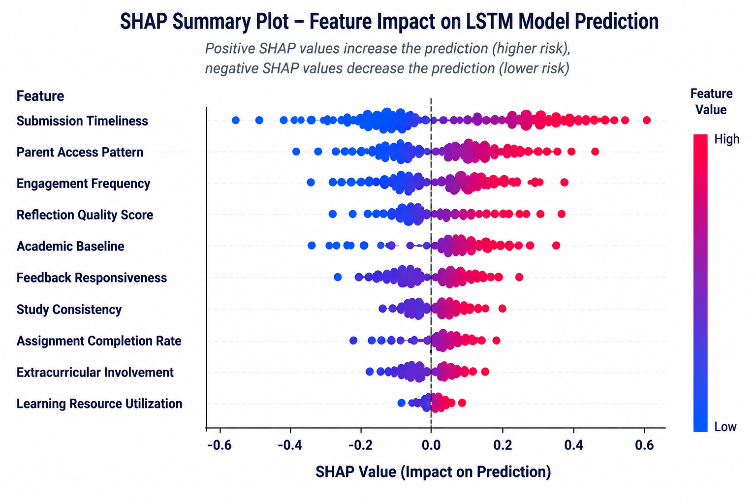
The SHAP summary analysis presented in Figure 4 demonstrates the relative contribution of behavioral, academic, and parental engagement variables toward the LSTM-based trajectory prediction model within the proposed explainable learning analytics framework. Based on the processing of the collected longitudinal educational data, Submission Timeliness emerged as the most influential predictor, followed by PAP, EF, and RQS, indicating that temporal learning behavior and parental monitoring consistency play substantial roles in shaping predictive outcomes. The distribution of positive and negative SHAP values further reveals that higher feature intensity generally contributes to stronger prediction confidence, while lower behavioral consistency tends to reduce predictive impact across student trajectories. In addition, the gradual decrease in SHAP magnitude across lower-ranked variables suggests that the model effectively differentiates dominant and supporting predictors within the educational ecosystem. These findings confirm that the integration of explainability mechanisms not only improves interpretability and transparency, but also strengthens stakeholder-oriented understanding of how specific behavioral and parental engagement indicators influence longitudinal academic trajectory prediction within AI-driven educational environments.
Figure 4. Shapley Additive Explanations (SHAP) summary Plot - Featureimpact on Long Short-Term Memory (LSTM) model prediction
4.4 Explainability and Shapley Additive Explanations interpretation
Explainability and SHAP interpretation represent critical components within the proposed explainable learning analytics framework because they provide transparency regarding how predictive models generate educational predictions from longitudinal behavioral and academic data. In this study, explainability was implemented using SHAP analysis to evaluate the contribution of individual variables within the predictive modelling process. Consistent with the methodological design presented in Section 3, SHAP analysis was applied to RF, XGBoost, and LSTM outputs to generate both global and local interpretability across the AI-driven e-portfolio system. This approach enabled the framework to identify the relative influence of academic traces, behavioral interaction patterns, and parental engagement indicators on student trajectory prediction outcomes [68].
Within the proposed architecture, explainability is interpreted not solely as a visualization mechanism, but as a stakeholder-oriented transparency layer that supports educational monitoring, interpretability, and informed intervention. Global SHAP interpretation was used to identify dominant predictors across the dataset, while local interpretation clarified how specific variables influenced individual student predictions. Variables such as Submission Timeliness, PAP, EF, and RQS demonstrated meaningful contributions to predictive outcomes. The integration of SHAP analysis therefore strengthened interpretability by translating complex predictive behaviour into understandable analytical representations accessible to teachers and parents within the educational decision-support environment [69].
The computational evaluation indicates that explainability analysis successfully identified the most influential variables contributing to longitudinal achievement prediction. As presented in Table 5, Submission Timeliness achieved the highest mean SHAP value (0.19), followed by PAP (0.16), EF (0.14), and RQS (0.12). The analysis further showed that students with PAP values above 0.80 experienced an average predicted academic increase of 4.2 points compared to students with inconsistent monitoring behavior. In addition, SHAP-based interpretation improved transparency by enabling direct identification of feature-level influence within trajectory prediction outcomes. These findings indicate that explainability mechanisms not only strengthen model interpretability, but also support transparent educational monitoring and stakeholder-oriented decision-making within AI-driven learning analytics systems.
Table 5. Shapley Additive Explanations (SHAP)-based explainability interpretation
|
Feature |
Mean SHAP Value |
Contribution Interpretation |
|
Submission Timeliness |
0.19 |
Strongest predictor of academic trajectory |
|
Parent Access Pattern (PAP) |
0.16 |
High parental monitoring influence |
|
Engagement Frequency (EF) |
0.14 |
Moderate behavioral contribution |
|
Reflection Quality Score (RQS) |
0.12 |
Positive reflective learning impact |
|
Academic Baseline |
0.08 |
Conditional predictive contribution |
|
Predicted Grade Increase (PAP > 0.80) |
+4.2 points |
Positive monitoring impact |
|
Explainability Scope |
Global & Local |
Multi-level interpretability |
|
Transparency Contribution |
High |
Supports educational decision-making |
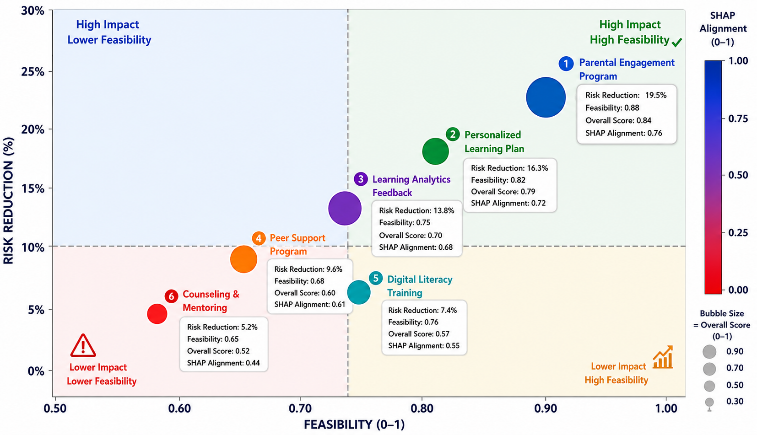
Figure 5 illustrates the comparative relationship between intervention feasibility and student risk reduction impact within the proposed explainable learning analytics framework. Based on the processing of the collected longitudinal educational data, the Parental Engagement Program demonstrated the strongest overall performance, achieving the highest risk reduction value (19.5%) together with the highest feasibility score (0.88), indicating strong practical readiness and predictive alignment for educational intervention implementation. The Personalized Learning Plan and Learning Analytics Feedback strategies also exhibited substantial effectiveness, positioned within the high-impact region with balanced feasibility and scalability characteristics. In contrast, Counseling & Mentoring and Digital Literacy Training showed relatively lower intervention impact despite maintaining moderate implementation feasibility. The distribution of intervention clusters across the matrix further indicates that strategies integrating parental engagement, adaptive learning personalization, and explainable feedback mechanisms tend to produce stronger predictive support and more effective academic risk mitigation. These findings reinforce the capability of the proposed intelligent educational analytics framework to support evidence-based intervention prioritization, transparent educational decision-making, and adaptive stakeholder-oriented learning support within AI-driven educational environments.
Figure 5. Intervention readiness matrix
4.5 Stakeholder trust and monitoring effectiveness
Stakeholder Trust and Monitoring Effectiveness represent important dimensions within the proposed explainable learning analytics framework because predictive educational systems must not only generate accurate outputs but also support transparency, interpretability, and confidence among end users. In this study, monitoring effectiveness refers to the extent to which explainable predictive outputs assist parents and teachers in understanding student learning trajectories and conducting proactive academic supervision. Consistent with the methodological design described in Section 3, stakeholder trust was evaluated using PLS-SEM based on responses collected from 198 parents interacting with the AI-driven e-portfolio dashboard.
Within the proposed architecture, explainability functions as a transparency mechanism that connects predictive analytics with stakeholder-oriented educational decision support. The integration of SHAP-based interpretation enabled parents to identify influential behavioral indicators such as submission timeliness, EF, and parental monitoring consistency within individual prediction outcomes. This interpretability layer strengthened monitoring visibility and reduced uncertainty regarding algorithmic recommendations. In addition, the explainability component contributed to improved interaction quality between parents and the educational monitoring system by transforming complex predictive outputs into understandable analytical representations suitable for non-technical stakeholders.
The statistical evaluation demonstrates that explainability perception significantly influenced monitoring effectiveness within the proposed framework. As summarized in Table 6, the structural model produced a path coefficient (β) of 0.64 with a t-value of 8.72 and p < 0.001, indicating a strong positive relationship between explainability perception and monitoring effectiveness. The obtained R² value of 0.41 further indicates that explainability perception accounted for 41% of the variance in stakeholder monitoring effectiveness. Reliability evaluation also showed strong internal consistency, with Composite Reliability values ranging from 0.89 to 0.91 and AVE values between 0.66 and 0.71. These findings suggest that transparent predictive outputs substantially improve stakeholder confidence, interpretability, and monitoring capability within AI-driven educational systems.
Table 6. Stakeholder trust and monitoring effectiveness evaluation
|
Indicator |
Obtained Value |
Interpretation |
|
Path Coefficient (β) |
0.64 |
Strong positive influence |
|
t-value |
8.72 |
Statistically significant relationship |
|
p-value |
< 0.001 |
Highly significant effect |
|
R² |
0.41 |
Moderate explanatory capability |
|
Composite Reliability |
0.89 – 0.91 |
High construct reliability |
|
AVE |
0.66 – 0.71 |
Strong convergent validity |
|
Explainability Impact |
Positive |
Improves stakeholder confidence |
|
Monitoring Effectiveness |
Enhanced |
Supports proactive educational supervision |
4.6 Intelligent information system contribution
The Intelligent Information System contribution of the proposed framework lies in its ability to integrate predictive analytics, explainability mechanisms, longitudinal trajectory modelling, and stakeholder-oriented monitoring within a unified educational ecosystem. In contrast to conventional e-portfolio platforms that mainly function as digital repositories, the proposed architecture operates as an adaptive decision-support environment capable of processing behavioral, academic, and parental interaction data simultaneously. Consistent with the methodological structure described in Section 3, the framework combines data acquisition, feature engineering, predictive modelling, explainability integration, and dashboard-based visualization into a multilayer intelligent information system capable of supporting proactive educational intervention and transparent academic monitoring.
From an intelligent systems perspective, the framework extends traditional learning analytics by incorporating explainable artificial intelligence and computational parental engagement modelling into the analytical workflow. The integration of RF, XGBoost, and LSTM architectures enabled the system to capture both nonlinear relationships and temporal learning trajectories, while SHAP-based explainability transformed complex predictive outputs into interpretable decision-support information for teachers and parents. Furthermore, the inclusion of dashboard-driven transparency mechanisms strengthened stakeholder interaction and monitoring capability, allowing the framework to function not only as a predictive engine but also as an adaptive educational information system emphasizing transparency, interpretability, and human-centered decision support.
The computational evaluation demonstrates that the proposed intelligent information system achieved stable analytical performance across predictive, interpretability, and monitoring dimensions. As presented in Table 7, the integrated architecture produced a mean RMSE reduction of 12.5% after incorporating parental engagement variables, while the LSTM model achieved the strongest predictive performance with RMSE = 4.95, AUC = 0.93, and F1-score = 0.89. Explainability analysis further identified Submission Timeliness and PAP as dominant contributors with SHAP values of 0.19 and 0.16 respectively, while the structural evaluation confirmed that explainability perception significantly influenced monitoring effectiveness (β = 0.64; R² = 0.41). These findings indicate that the proposed framework successfully combines predictive intelligence, interpretability, and stakeholder-oriented transparency within a scalable intelligent educational information system architecture.
Table 7. Intelligent information system contribution evaluation
|
Component |
Obtained Value |
Interpretation |
|
RMSE Improvement |
12.5% |
Enhanced predictive consistency |
|
Best RMSE (LSTM) |
4.95 |
Strong trajectory prediction capability |
|
Best AUC (LSTM) |
0.93 |
High discriminatory performance |
|
Best F1-score (LSTM) |
0.89 |
Balanced predictive classification |
|
Submission Timeliness SHAP |
0.19 |
Dominant predictive contributor |
|
Parent Access Pattern SHAP |
0.16 |
Strong parental engagement influence |
|
Explainability Effect (β) |
0.64 |
Strong transparency impact |
|
Monitoring Effectiveness (R²) |
0.41 |
Moderate explanatory capability |
|
System Architecture |
Five-layer Integrated System |
Adaptive intelligent educational framework |
|
Decision Support Capability |
High |
Supports proactive educational intervention |
4.7 Statistical robustness and validation
Statistical robustness and validation refer to the extent to which the proposed explainable learning analytics framework produces stable, consistent, and statistically reliable predictive outcomes across repeated experimental evaluations. In this study, robustness evaluation was conducted to ensure that the predictive improvements obtained from integrating parental engagement indicators were not caused by random variation or model instability. Consistent with the methodological configuration presented in Section 3, repeated stratified 5-fold cross-validation was implemented to evaluate model consistency while minimizing sampling bias and overfitting risk within the longitudinal educational dataset. In addition, statistical validation procedures included paired t-tests, Wilcoxon signed-rank tests, and Cohen’s effect size analysis to examine the significance and practical magnitude of predictive improvements across modelling scenarios.
Within the proposed framework, statistical validation functions not only as a technical verification procedure but also as an essential mechanism for ensuring reproducibility and analytical credibility in educational AI systems. The integration of cross-validation strategies with inferential statistical testing enabled the framework to assess predictive consistency, classification stability, and practical effectiveness across multiple experimental conditions. Furthermore, the inclusion of effect size analysis strengthened interpretation beyond statistical significance by quantifying the magnitude of performance improvement associated with parental engagement integration and explainability mechanisms. This combination of predictive evaluation and statistical validation therefore reinforces the reliability of the proposed intelligent educational information system within trajectory-based learning analytics environments.
The computational validation results demonstrate that the proposed framework achieved statistically stable and practically meaningful predictive improvements across multiple evaluation metrics. As summarized in Table 8, the repeated stratified 5-fold cross-validation produced moderate fold variability with F1-score and AUC standard deviations of 0.10 and 0.12 respectively, indicating acceptable model consistency throughout repeated evaluation cycles. Statistical testing further showed that the integration of parental engagement indicators significantly improved predictive performance, with paired t-test results yielding p < 0.001 across RMSE, AUC, and F1-score comparisons. The Wilcoxon signed-rank test also confirmed robustness with Z = -4.98 (p < 0.001), while Cohen’s d value of 0.82 indicated a large practical effect associated with parental engagement integration. These findings suggest that the predictive improvements generated by the framework are statistically reliable and practically meaningful, although broader multi-institutional validation is still required to strengthen external generalizability across heterogeneous educational contexts.
Table 8. Statistical robustness and validation results
|
Validation Component |
Obtained Value |
Interpretation |
|
Validation Strategy |
Repeated Stratified 5-Fold CV |
Stable repeated evaluation |
|
RMSE Improvement p-value |
<0.001 |
Statistically significant |
|
AUC Improvement p-value |
<0.001 |
Statistically significant |
|
F1-score Improvement p-value |
<0.001 |
Statistically significant |
|
Wilcoxon Signed-Rank (Z) |
-4.98 |
Strong robustness confirmation |
|
Wilcoxon p-value |
<0.001 |
Significant non-parametric validation |
|
Cohen’s d |
0.82 |
Large practical effect |
|
F1-score Standard Deviation |
0.10 |
Moderate fold variability |
|
AUC Standard Deviation |
0.12 |
Moderate model instability |
|
Statistical Reliability |
High |
Consistent predictive improvement |
This study proposed an explainable learning analytics framework for AI-driven e-portfolio systems by integrating longitudinal behavioral interaction data, academic performance indicators, and computational parental engagement variables within an intelligent educational information system architecture. The experimental findings demonstrate that the proposed framework was capable of modelling student learning trajectories with relatively strong predictive capability, particularly through the LSTM architecture, which achieved the best overall performance with RMSE = 4.95, AUC = 0.93, and F1-score = 0.89. These results indicate that sequential modelling approaches are more effective for capturing temporally structured educational behavior and longitudinal academic progression patterns compared with conventional machine learning models. In addition, the integration of parental engagement indicators contributed to a 17.6% reduction in RMSE, confirming that parental monitoring consistency and engagement behavior positively influence predictive stability and trajectory discrimination within explainable educational AI environments.
The explainability evaluation further revealed that Submission Timeliness (SHAP = 0.19) and PAP (SHAP = 0.16) were the most influential variables contributing to trajectory prediction outcomes. Students with consistent parental monitoring behavior (PAP > 0.80) demonstrated an average predicted academic improvement of approximately 4.2 points compared with students exhibiting inconsistent parental engagement patterns. Moreover, stakeholder-oriented validation using PLS-SEM analysis demonstrated that explainability perception significantly influenced monitoring effectiveness, producing a path coefficient of β = 0.64 with p < 0.001 and an explanatory capability of R² = 0.41. These findings indicate that explainable predictive outputs not only strengthen transparency and interpretability, but also improve stakeholder confidence and educational monitoring effectiveness within AI-driven learning environments.
Despite these promising findings, several limitations remain evident within the current framework. Although the expanded dataset incorporated educational records from 15 institutions, some behavioral variables still demonstrated moderate temporal dependency and limited separation across student risk categories. Statistical validation also revealed moderate variability during repeated cross-validation, reflected by F1-score and AUC standard deviations of 0.10 and 0.12 respectively. Furthermore, the explainability evaluation primarily focused on transparency perception rather than direct behavioral verification of intervention effectiveness. Consequently, the proposed framework should be interpreted as a robust preliminary contribution toward explainable trajectory-based learning analytics rather than a fully generalized predictive architecture applicable across all educational ecosystems. Future studies should therefore incorporate broader multi-institutional datasets, multimodal learning behavior representations, attention-based temporal architectures, and longitudinal intervention validation to strengthen scalability, fairness, robustness, and real-world educational applicability within diverse learning environments.
The authors gratefully acknowledge the financial support provided by Universitas Trisakti for funding this research project. The institutional support has been instrumental in enabling the development, implementation, and empirical validation of the proposed framework. The authors also appreciate the collaborative environment and academic resources provided by Universitas Trisakti.
|
AI |
Artificial Intelligence |
|
AUC |
Area Under the Curve |
|
AVE |
Average Variance Extracted |
|
CV |
Cross-Validation |
|
DSR |
Design Science Research |
|
EDM |
Educational Data Mining |
|
EF |
Engagement Frequency |
|
F1-score |
Harmonic mean of precision and recall |
|
LMS |
Learning Management System |
|
LA |
Learning Analytics |
|
LSTM |
Long Short-Term Memory |
|
PAP |
Parent Access Pattern |
|
PLS-SEM |
Partial Least Squares Structural Equation Modelling |
|
RF |
Random Forest |
|
RMSE |
Root Mean Square Error |
|
RQS |
Reflection Quality Score |
|
SHAP |
Shapley Additive Explanations |
|
STI |
Submission Timeliness Index |
|
VIF |
Variance Inflation Factor |
|
XAI |
Explainable Artificial Intelligence |
|
XGBoost |
Extreme Gradient Boosting |
|
$x_1$ |
Actual observed value |
|
$ \hat{x}_1$ |
Predicted value generated by the model |
|
n |
Total number of observations |
|
C |
Coherence score in reflective assessment |
|
M |
Metacognitive depth score |
|
D |
Descriptive elaboration score |
|
$ \beta$ |
Path coefficient in PLS-SEM analysis |
|
$ R^2$ |
Coefficient of determination |
|
P |
Probability value (statistical significance) |
|
Z |
Wilcoxon signed-rank test statistic |
|
d |
Cohen’s effect size value |
|
Greek Symbols |
|
|
α |
Learning rate parameter in optimization process |
|
β |
Path coefficient in PLS-SEM analysis representing explainability influence on monitoring effectiveness |
|
σ |
Standard deviation used in model variability evaluation |
|
Σ |
Summation operator used in predictive and statistical formulations |
|
ϕi |
SHAP value contribution of feature iii toward prediction output |
|
μ |
Mean value of predictive performance metrics |
|
λ |
Regularization parameter in XGBoost optimization |
|
θ |
Model parameter vector in machine learning optimization |
|
g |
Gradient boosting regularization or learning adjustment coefficient |
|
ε |
Prediction error or residual term |
|
Δ |
Change or improvement between predictive modelling scenarios |
|
ρ |
Correlation strength between explainability perception and monitoring effectiveness |
|
ω |
Weight parameter in feature aggregation process |
|
τ |
Temporal dependency parameter in longitudinal trajectory modelling |
|
η |
Optimization learning coefficient used in iterative training |
|
Subscripts |
|
|
$ x_i$ |
Feature value of the iii-th predictor variable |
|
$ y_i$ |
Actual academic achievement value of student i |
|
$ \hat{y}_i$ |
Predicted academic achievement value of student i |
|
ti |
Time sequence at instructional week i |
|
ht |
Hidden state of LSTM at time t |
|
ct |
Cell state of LSTM at time t |
|
ft |
Forget gate activation at time t |
|
it |
Input gate activation at time t |
|
ot |
Output gate activation at time t |
|
Xt |
Input vector at time sequence t |
|
Pi |
Parent engagement indicator for participant i |
|
Ef |
Engagement Frequency variable |
|
St |
Submission Timeliness variable |
|
RQSi |
Reflection Quality Score for student i |
|
PAPi |
Parent Access Pattern for student i |
|
RMSEi |
Root Mean Square Error observation component |
|
AUCm |
Area Under Curve value for model m |
|
F1m |
F1-score for predictive model m |
|
VIFi |
Variance Inflation Factor for predictor i |
|
$\phi_i$ |
SHAP contribution value of feature i |
[1] Ballegeer, M., Bogaert, M., Benoit, D.F. (2025). Evaluating the stability of model explanations in instance-dependent cost-sensitive credit scoring. European Journal of Operational Research, 326(3): 630-640. https://doi.org/10.1016/j.ejor.2025.05.039
[2] Almousa, G., Lee, Y. (2025). TRIDENT: Temporal reasoning and detection of emerging network threats. IEEE Transactions on Computational Social Systems, 13(2): 2701-2717. https://doi.org/10.1109/tcss.2025.3621180
[3] Giri, S., Du, D., Beruvides, M. (2025). A systematic approach to predicting NFT prices using time series forecasting and macroeconomic factors in digital assets. Cogent Economics & Finance, 13(1): 2468387. https://doi.org/10.1080/23322039.2025.2468387
[4] Marinin, S.A., Savchenko, E.V., Tugova, M.A. (2025). Electronic portfolio as a tool for managing students in the terms of employment in the activities of a university. 2025 Intelligent Technologies and Electronic Devices in Vehicle and Road Transport Complex (TIRVED), Moscow, Russian Federation. https://doi.org/10.1109/TIRVED67702.2025.11367190
[5] Briñez-De-León, J., Patiño-Hoyos, A., Restrepo-Loaiza, F., Cardona-Osorio, G. (2025). A visual representation–based computational approach for student dropout analysis: A case study in Colombia. Computation, 13(12): 284. https://doi.org/10.3390/computation13120284
[6] Nazyrova, A., Miłosz, M., Bekmanova, G., Omarbekova, A., Aimicheva, G., Kadyr, Y. (2025). The digital transformation of higher education in the context of an AI-driven future. Sustainability, 17(22): 9927. https://doi.org/10.3390/su17229927
[7] Hu, K., Zhang, N., Yao, T., Xu, Z., Chen, X., Sun, L. (2025). Predicting building layout structure and features via planar duality and graph neural networks. Automation in Construction, 182: 106681. https://doi.org/10.1016/j.autcon.2025.106681
[8] Awoyemi, R.A., Awoyemi, O.R. (2025). Smart inventory management systems for Nigerian academic libraries. Library Hi Tech News, 42(8): 5-7. https://doi.org/10.1108/lhtn-06-2025-0094
[9] Saqr, M., López-Pernas, S. (2025). Changes in online engagement at the within-person level, profiles, dynamics and association with achievement. The Internet and Higher Education, 67: 101031. https://doi.org/10.1016/j.iheduc.2025.101031
[10] Elmoazen, R., Saqr, M., Hirsto, L., Tedre, M. (2024). Capturing temporal pathways of collaborative roles: A multilayered analytical approach using community of inquiry. International Journal of Computer-Supported Collaborative Learning, 20(1): 41-77. https://doi.org/10.1007/s11412-024-09431-6
[11] Wu, X., Jia, Y., Zhang, Q., Qin, Y., Xiao, L., Zhao, S. (2026). Towards affective evaluation of STEM education: Leveraging MLLMs in project-based learning. IEEE Transactions on Affective Computing, pp, 1-12. https://doi.org/10.1109/taffc.2026.3656971
[12] Kashif, M., Ammar, M., Sellami, A., Chiu, T.K., Abbasi, S.A., Ahmad, Z. (2025). Teachers’ perspectives on AI integration in K-12 education: Challenges, opportunities, and preliminary assessment model – a systematic review. Computers in the Schools, pp. 1-27. https://doi.org/10.1080/07380569.2025.2602507
[13] López-Goyez, J.P., González-Briones, A., Demazeau, Y. (2026). An adaptive multi-agent architecture with reinforcement learning and generative AI for intelligent tutoring systems: A moodle-based case study. Applied Sciences, 16(3): 1323. https://doi.org/10.3390/app16031323
[14] Tiwari, P., Ghasemi, A., Hajian, A., Kim, D. (2026). An explainable artificial intelligence algorithm for optimal decision making from a business analytics perspective. Mathematics, 14(3): 526. https://doi.org/10.3390/math14030526
[15] Montambault, B., Appleby, G., Rogers, J., Brumar, C.D., Li, M., Chang, R. (2024). DimBridge: Interactive explanation of visual patterns in dimensionality reductions with predicate logic. IEEE Transactions on Visualization and Computer Graphics, 31(1): 207-217. https://doi.org/10.1109/tvcg.2024.3456391
[16] Purwanto, I., Isnanto, R. (2025). A fuzzy logic model for loan recommendations in online lending systems using the california psychological inventory. Ingénierie des Systèmes d'information, 30(4): 300409. https://doi.org/10.18280/isi.300409
[17] Kisić, E., Milić, M.R., Jović, J., Zdravković, N. (2026). Tracking student progress and generating personalized recommendations using clustering and explainable artificial intelligence. Universal Access in the Information Society, 25(1): 26. https://doi.org/10.1007/s10209-025-01295-3
[18] Butt, A.U.R., Ali, H., Asif, M., Alfraihi, H., Ishak, M.K., Ammar, K. (2025). Enhancing student management through hybrid machine learning and rough set models: A framework for positive learning environments. IEEE Access, 13: 80834-80846. https://doi.org/10.1109/access.2025.3565585
[19] Yeung, J.W.K., Lo, H.H.M., Fung, S., Young, D.K.W., Xia, L. (2026). Charting the pathway to STEM: How middle school socialization and science growth trajectories predict adult career success. Education Sciences, 16(1): 166. https://doi.org/10.3390/educsci16010166
[20] Offidani, M.N., Roffet, F., Galtier, M.C.G., Massiris, M., Delrieux, C. (2025). An open-source clinical case dataset for medical image classification and multimodal AI applications. Data, 10(8): 123. https://doi.org/10.3390/data10080123
[21] Jang, E., Oh, K. (2026). Investigation of the influence of flipped learning and text-based generative artificial intelligence in programming education: Effectiveness and pedagogical strategies. Computer Applications in Engineering Education, 34(1): e70146. https://doi.org/10.1002/cae.70146
[22] Tarafder, T.R., Ansari, E., Alam, A., Shil, S.K., Islam, R., Ahmed, K.R. (2025). Leveraging artificial intelligence in management information systems for sustainable supply chain optimization and environmental impact analysis. Discover Artificial Intelligence, 6(1): 56. https://doi.org/10.1007/s44163-025-00737-4
[23] Sarode, A.R., Rani, M.V., Das, B., S, U., Punia, S. (2025). An AI-based framework for interpretable mental health literacy segmentation and decision support. IEEE Journal of Biomedical and Health Informatics, 29(12): 8799-8806. https://doi.org/10.1109/jbhi.2025.3609786
[24] Alaskar, N.M., Hussain, M., Almheiri, S.J., Khan, A., Adnan, K.M. (2026). Big data-driven federated learning model for scalable and privacy-preserving cyber threat detection in IoT-enabled healthcare systems. COMputers, Materials & Continua, 87(1): 1-10. https://doi.org/10.32604/cmc.2025.074041
[25] Konstantinidou, A., Nisiforou, E.A., Vrasidas, C. (2026). Enhancing personalized learning with Artificial Intelligence and analytics: university staff's insights. Interactive Learning Environments, 1-21. https://doi.org/10.1080/10494820.2026.2619907
[26] Tian, M., Li, S., Xu, R., Cichocki, A., Jin, J. (2025). An interpretable regression method for upper limb motion trajectories detection with EEG signals. IEEE Transactions on Biomedical Engineering, 72(10): 2961-2971. https://doi.org/10.1109/tbme.2025.3557255
[27] Zhao, E., Wang, Q., Hou, S., Luo, Z., Gao, W. (2025). Time-variant reliability analysis via advanced most probable point trajectory tracking. Reliability Engineering & System Safety, 266: 111748. https://doi.org/10.1016/j.ress.2025.111748
[28] Zhang, J., Zhang, Y., Yao, E. (2025). A New framework for traffic conflict identification by incorporating predicted high-resolution trajectory and vehicle profiles in a CAV context. Transportation Research Record: Journal of the Transportation Research Board, 2679(11): 445-462. https://doi.org/10.1177/03611981251348444
[29] Kozhanov, M., Varkonyi-Koczy, A.R. (2025). Modelling curricula with GNN and LSTM for link and sequence prediction. Eurasian Journal of Mathematical and Computer Applications, 13(4): 159-167. https://doi.org/10.32523/2306-6172-2025-13-4-159-167
[30] Kassenkhan, A.M., Moldagulova, A.N., Serbin, V.V. (2025). Gamification and artificial intelligence in education: A review of innovative approaches to fostering critical thinking. IEEE Access, 13: 98699-98728. https://doi.org/10.1109/access.2025.3576147
[31] Trichkova-Kashamova, E., Paunova-Hubenova, E. (2026). Optimization of contemporary STEM learning methods in a technology-rich environment. Information, 17(1): 74. https://doi.org/10.3390/info17010074
[32] Khan, M., Khan, M.A., Moser, B., Rafique, W., Xiaolong, X., Wanchun, D. (2026). AI-driven predictive maintenance in industrial IoTs: A comprehensive survey. IEEE Internet of Things Journal, 13(10): 20275-20298. https://doi.org/10.1109/jiot.2026.3660780
[33] Yue, Z., Bickham, D., Hunt, E., Schwamm, S., Rich, M. (2024). Navigating fairness and boundaries: parental rule strategies and indicators of adolescents’ media overuse. Behaviour & Information Technology, 44(8): 1722-1737. https://doi.org/10.1080/0144929x.2024.2374895
[34] Syed, A.H., Singh, Y., Bhardwaj, H. (2026). Explainable multimodal student profiling and personalized course recommendation using attention-enhanced heterogeneous graph neural networks. Journal of Applied Science and Technology Trends, 7(1): 16-25. https://doi.org/10.38094/jastt71611
[35] Wang, L., Wang, T., Zhou, T.H., Liu, Z. (2026). Course-oriented knowledge service-based AI teaching assistant system for higher education sustainable development demand. Sustainability, 18(2): 807. https://doi.org/10.3390/su18020807
[36] Liu, H., Li, C., Liu, Z., Yang, S., Wang, H., Yan, P. (2026). Designing multimodal human–computer interaction for K–12 Learning: Research design, system architecture, and field evaluation of an ai teaching agent. International Journal of Human–Computer Interaction, 1-26. https://doi.org/10.1080/10447318.2026.2616662
[37] El Ghouch, N., Mahboub, A. (2025). Adapting learning in a context-aware mobile learning system using the dynamic case-based reasoning. Journal of Theoretical and Applied Information Technology, 103(9): 3881-3889.
[38] Camargos, R.C., Silveira, I.F. (2025). Mitigating cognitive biases in predicting student dropout: Global and local explainability with explainable boosting machine. JUCS – Journal of Universal Computer Science, 31(10): 1017-1041. https://doi.org/10.3897/jucs.131773
[39] Khachatryan, D., Parise, S. (2025). Teaching real-time object detection with an emphasis on engagement and inclusiveness. Communications of the Association for Information Systems, 56: 613-632. https://doi.org/10.17705/1cais.05625
[40] Eli, A.A., Rahman, A., Kshetri, N. (2025). D3S3real: Enhancing student success and security through real-time data-driven decision systems for educational intelligence. Digital, 5(3): 42. https://doi.org/10.3390/digital5030042
[41] Avello-Martínez, R., Gajderowicz, T., Gómez-Rodríguez, V.G. (2024). Is ChatGPT helpful for graduate students in acquiring knowledge about digital storytelling and reducing their cognitive load? An experiment. Revista de Educación a Distancia (RED), 24(78): 604621. https://doi.org/10.6018/red.604621
[42] Zhang, Y. (2025). Predicting teachers’ intentions for AIGC integration in preschool education: A hybrid SEM-ANN approach. Journal of Information Technology Education: Research, 24: 016. https://doi.org/10.28945/5502
[43] Durón, N.G., Jiménez-Preciado, A.L. (2025). Exploring the role of AI in higher education: a natural language processing analysis of emerging trends and discourses. The TQM Journal, 38(3): 673-693. https://doi.org/10.1108/tqm-10-2024-0376
[44] Jabeen, Z., Mishra, K., Dayal, R., Mishra, B.K. (2024). Transforming education in the world of artificial intelligence. LatIA, 2: 113-113. https://doi.org/10.62486/latia2024113
[45] Spyrou, O., Ariza-Sentís, M., Vélez, S. (2025). Enhancing education in agriculture via XR-based digital twins: A novel approach for the next generation. Applied System Innovation, 8(2): 38. https://doi.org/10.3390/asi8020038
[46] Zha, S., Tang, Y., Gong, J., Xu, Y. (2025). COLP: Scaffolding children’s online long-term collaborative learning. International Journal of Human–Computer Interaction, 41(24): 15453-15475. https://doi.org/10.1080/10447318.2025.2498492
[47] Liu, H. (2026). Parental AI investment behaviours and AI-mediated informal digital learning of English: The chain mediating role of children's perceived AI value and effort expectancy for AI. Journal of Computer Assisted Learning, 42(2): e70198. https://doi.org/10.1002/jcal.70198
[48] Ebermann, C., Blümel, D., Brauer, B., Weibelzahl, S. (2026). User experience and acceptance of artificial intelligence–Understanding the role of user’s expectations and system performance. Behaviour & Information Technology, 1-22.
[49] Pradana, H.D., Sumarno, A., Rusijono, R., Rofik, A., Arianto, F., Abidin, Z. (2026). Designing an AI-based evaluation system for outcome-based education to support SDGs in higher education. Journal of Engineering Science and Technology, 21(1): 49-56.
[50] Verma, N., Getenet, S., Dann, C., Shaik, T. (2025). Evaluating an Artificial Intelligence (AI) model designed for education to identify its accuracy: Establishing the need for continuous AI model updates. Education Sciences, 15(4): 403. https://doi.org/10.3390/educsci15040403
[51] Vijay, M., Jayan, J.P., Rose, R.I.H. (2025). A systematic review on artificial intelligence based adaptive gamification in knowledge engineering. KSII Transactions on Internet and Information Systems, 19(8): 2569-2591. https://doi.org/10.3837/tiis.2025.08.009
[52] Kong, K., Liu, Z., Gao, Z., Dong, H., Isleem, H.F. (2026). Hierarchical deep reinforcement learning for real-time tactical decision-making in team sports. Data Technologies and Applications, 60(2): 221-256. https://doi.org/10.1108/dta-06-2025-0512
[53] Shoaib, M., Husnain, G. (2025). Deep learning-based spatiotemporal action recognition in football using I3D and TSN with pose estimation. Biomedical Signal Processing and Control, 111: 108356. https://doi.org/10.1016/j.bspc.2025.108356
[54] Hooshyar, D., Šír, G., Yang, Y., Kikas, E., Hämäläinen, R., Kärkkäinen, T., Gašević, D., Azevedo, R. (2025). Towards responsible AI for education: Hybrid human-AI to confront the elephant in the room. Computers and Education: Artificial Intelligence, 9: 100524. https://doi.org/10.1016/j.caeai.2025.100524
[55] Liu, X. (2025). Student learning behavior recognition in smart classrooms based on artificial intelligence algorithms. In 2025 3rd International Conference on Data Science and Network Security (ICDSNS), Tiptur, India. https://doi.org/10.1109/ICDSNS65743.2025.11168809
[56] Shaikhanova, A., Kuznetsov, O., Iklassova, K., Tokkuliyeva, A., Sugurova, L. (2025). Interpretable predictive modeling for educational equity: A workload-aware decision support system for early identification of at-risk students. Big Data and Cognitive Computing, 9(11): 297. https://doi.org/10.3390/bdcc9110297
[57] Ruan, S., Nie, A., Steenbergen, W., He, J., Zhang, J.Q., Guo, M., Liu, Y., Nguyen, K.D., Wang, C.Y., Ying, R., Landay, J.A., Brunskill, E. (2024). Reinforcement learning tutor better supported lower performers in a math task. Machine Learning, 113(5): 3023-3048. https://doi.org/10.1007/s10994-023-06423-9
[58] Goran, R., Jovanovic, L., Bacanin, N., Stanković, M.S., Simic, V., Antonijevic, M., Zivkovic, M. (2024). Identifying and understanding student dropouts using metaheuristic optimized classifiers and explainable artificial intelligence techniques. IEEE Access, 12: 122377-122400. https://doi.org/10.1109/access.2024.3446653
[59] Topuz, K., Urban, T.L., Russell, R.A., Yildirim, M.B. (2024). Decision support system for appointment scheduling and overbooking under patient no-show behavior. Annals of Operations Research, 342(1): 845-873. https://doi.org/10.1007/s10479-023-05799-0
[60] Nnadi, L.C., Watanobe, Y. (2025). Hierarchical aggregation of local explanations for student adaptability. Applied Sciences, 16(1): 333. https://doi.org/10.3390/app16010333
[61] Osborne, A., Usani, K. (2025). A fairness-aware machine learning framework for maternal health in Ghana: Integrating explainability, bias mitigation, and causal inference for ethical AI deployment. BioData Mining, 19(1): 3. https://doi.org/10.1186/s13040-025-00505-1
[62] Fu, S.L., Fu, S.O., Chen, R.Y., Fu, E., Fu, M.M., Lee, T.S., Chan, H. (2025). Association between parental attendance at early adolescence’s parent–teacher conferences and their children’s performance in standardized exams for high school and college entrance. Education Sciences, 15(6): 750. https://doi.org/10.3390/educsci15060750
[63] Ofori, E., Dake, D.K. (2025). Explainable artificial intelligence in LSTM transformer models for student performance analysis. Discover Computing, 28(1): 313. https://doi.org/10.1007/s10791-025-09814-9
[64] Xing, J., Wang, F., Yang, D., Tan, C., Ma, X., Chen, W., Ji, G. (2025). A crossformer-based method for sea surface height prediction using delay–doppler map feature points. IEEE Geoscience and Remote Sensing Letters, 22: 1-5. https://doi.org/10.1109/lgrs.2025.3601112
[65] Baydili, İ.T., Tasci, B. (2025). Predicting employee attrition: XAI-powered models for managerial decision-making. Systems, 13(7): 583. https://doi.org/10.3390/systems13070583
[66] Awad-Yassin, M., Ben-Ari, O.T. (2025). Navigating risk: The contribution of family road safety climate and sense of community to driving styles of young Arab drivers in Israel. Transportation Research Part F: Traffic Psychology and Behaviour, 111: 343-353. https://doi.org/10.1016/j.trf.2025.03.010
[67] Khine, M.S., Ali, N., Abu Khurma, O. (2025). From meals to marks: Modeling the impact of family involvement on reading performance with counterfactual explainable AI. Education Sciences, 15(7): 928. https://doi.org/10.3390/educsci15070928
[68] Sujon, K.M., Hassan, R., Choi, K., Samad, A. (2025). Accuracy, precision, recall, f1-score, or MCC? Empirical evidence from advanced statistics, ML, and XAI for evaluating business predictive models. Journal of Big Data, 12(1): 268. https://doi.org/10.1186/s40537-025-01313-4
[69] Ouared, A., May, M., Piau-Toffolon, C., Dugué, N. (2025). Automating transparent learner profiling through explainable AI. Automated Software Engineering, 33(1): 33. https://doi.org/10.1007/s10515-025-00574-w