Zainab Khyioon Abdalrdha* | Mohammed Saeed Hashim | Jinan Redha Mutar | Saja Hikmat Dawood
© 2026 The authors. This article is published by IIETA and is licensed under the CC BY 4.0 license (http://creativecommons.org/licenses/by/4.0/).
OPEN ACCESS
Cyberbullying detection is hindered by severe class imbalance and high-dimensional sparse text representations. This study proposes a Synthetic Minority Oversampling Technique (SMOTE)–Northern Goshawk Optimization (NGO) stacking ensemble for binary detection across five English benchmark datasets covering aggression, insults, toxicity, racism, and sexism (312,115 labelled texts). After text normalization, tokenization, stop-word removal, and stemming, unigram–bigram Term Frequency-Inverse Document Frequency (TF-IDF) features were generated. For each dataset, stratified 70:30 training–test splitting was used; SMOTE was applied only to the training partition. NGO jointly selected TF-IDF features and tuned the hyperparameters of Random Forest, AdaBoost, support vector machine, and Naïve Bayes classifiers using weighted F1-score as the fitness measure. Optimized base learners were combined through a stacking architecture with AdaBoost as the meta-learner. Model robustness was assessed by five-fold stratified cross-validation and three fixed random seeds. According to the reported experiments, the proposed framework improved the post-optimization test-set performance of the individual classifiers across the five datasets. On the Toxicity dataset, it achieved a reported accuracy of 99.88% ± 0.10 and F1-score of 99.93% ± 0.06 in five-fold cross-validation. The framework offers a computationally lightweight alternative to transformer-based systems for benchmark text classification. Nevertheless, its results should be interpreted within the selected datasets and evaluation pipeline; external platform-level validation and ablation analyses are needed to quantify the independent contributions of SMOTE, NGO, and stacking.
cyberbullying detection, imbalanced text classification, stacking ensemble, Northern Goshawk Optimization, Synthetic Minority Oversampling Technique, Term Frequency-Inverse Document Frequency, hyperparameter optimization
Bullying is one form of aggressive behavior in which someone who has a lot of social or physical power usually abuses, threatens, or otherwise harms a weaker individual, who is generally a weaker person [1]. Bullying can take many different forms, including social (public humiliation), physical (hitting, kicking, pushing), or verbal (name-calling, threatening, taunting). Although they facilitate contact and the exchange of content, social media sites like Facebook, WhatsApp, Twitter, Instagram, and YouTube are frequently abused. The rapid increase in users across all age groups has led to a lack of awareness regarding proper usage and ethical behavior, resulting in harmful consequences such as anxiety, depression, and cyberbullying [2]. Children are particularly vulnerable to these harmful effects, and the lack of effective prevention measures only exacerbates the problem [3]. Victimization through cyberbullying was reported in the range of 13.99% to 57.5%, whereas the percentage of children and adolescents who experienced cyberbullying was within 6.0% to 46.3% [4, 5]. These incidents have been exacerbated due to the growth of social media use, frequently even without the users being aware of its purpose or ethical aspects. The advancement of technology, allowing the creation of new forms of bullying, has resulted in an increasing need for robust ways to identify and fight against cyberbullying [6]. Common cyberbullying channels include email, instant messaging, live chat rooms, text messages, social networks, and various websites [7, 8]. Cyberbullying behaviors include flooding (spamming content) and masquerading (impersonating victims) to incitement, trolling, hateful comments, humiliation, lying, posting embarrassing content, online exclusion, impersonation, trickery, and cyberstalking. These behaviors are increasingly prevalent among adolescents. Research and advancements in cyberbullying detection are urgently needed. Authorities can take the appropriate action to punish online harassers or stop them from posting anything that could incite cyberbullying if they identify instances of cyberbullying. In recent times, numerous studies have concentrated on the issue of cyberbullying on social media platforms and have proposed various methods to detect it. Therefore, it is crucial to conduct additional research on the English language and employ various techniques to obtain more precise results when identifying cyberbullying. Addressing class imbalance is a significant challenge in cyberbullying detection, as minority classes are often underrepresented in datasets. Various methods have been introduced to tackle this problem, such as oversampling, under sampling, and cost-sensitive learning. In this research, the Synthetic Minority Oversampling Technique (SMOTE) technique was utilized to balance the training data by creating synthetic samples for the minority class. Instead of duplicating existing data, SMOTE generates new samples through interpolation between existing instances. This method enhances class representation, improves the model's ability to generalize, and minimizes the likelihood of overfitting [9]. In this study, a hybrid cyberbullying detection framework is proposed. After splitting each dataset into 70% training and 30% testing sets, SMOTE is applied only to the training data to address class imbalance. The text is preprocessed by removing noise such as emojis, URLs, and special characters, and then converted into numerical features using Term Frequency-Inverse Document Frequency (TF-IDF). NGO is employed for feature selection and hyperparameter optimization of Random Forest (RF), AdaBoost, Support Vector Machine (SVM), and Naive Bayes (NB). The optimized models are integrated using a stacking ensemble. The framework is evaluated on five benchmark English cyberbullying datasets using 5-fold stratified cross-validation and performance metrics, including accuracy, precision, recall, F1-score, and Receiver Operating Characteristic–Area Under the Curve) ROC-AUC(. Experimental results indicate that the proposed stacking ensemble consistently outperforms the individual classifiers.
The following are this paper’s primary contributions:
1. This paper utilizes the NGO algorithm to achieve optimal Feature Selection.
2. NGO-based tuning for all four models (RF, Ada Boost, SVM, and NB).
3. Finally, integrate all optimized models into a unified ensemble framework.
This paper is broadly structured like this: Section 2 presents an overview of the literature review on cyberbullying detection and ensemble learning. Section 3 presents the proposed method and centralizes on the experimental results, data, and analyses the findings. Section 4 summarizes his conclusions and outlines the potential areas for future work.
Reviewing the most recent CB detection and classification techniques on internet datasets is the primary goal of this section. In the classification of cyberbullying, machine learning-based techniques with various Feature Selection techniques are frequently employed. Using data from social media, Cyberbullying and hate speech detection using Bidirectional Encoder Representations from Transformers (BERT), DistilBERT, and XLM-RoBERTa transformer-based models were proposed by Liu et al. [10] as a deep mutual distillation learning (DDML) architecture. This method improves classification by allowing small student models to learn from both a large instructor model and each other. Twitter Racism and Sexism Detection, two extremely comparable benchmark datasets, were among those used to evaluate this research. The best Twitter Racism F1-score was 74.98%, which was reported by XLM-RoBERTa. Although the method does not use class balance, evolutionary optimization, or stacking ensembles, it still requires a significant amount of computational resources. Sherly and Jeetha [11] proposed a Twitter-based approach for detecting CB by combining sentiment analysis and DL. They introduce a framework that first applies the Modified Fruit Fly Algorithm (MFFA) for Feature Selection, followed by a Hybrid Recurrent Convolutional Neural Network (HRecR CNN) for feature classification. The results demonstrate that the proposed method outperforms traditional approaches in both performance metrics and computational efficiency. Khan et al. [12] identified cyber violence using binary classification on a cyber-troll dataset. In addition to ML models like SVM and NB, they employed a range of deep learning models like CNN and DNN. At 88.34% accuracy, their proposed three-layer DNN model yielded the best result. The researchers of the study [13] employ a transformer-based method to detect cyberbullying in Bengali, a language with few resources. This was accomplished by creating a new Bengali dataset with 2,751 manually categorized texts from social media platforms. With an accuracy of 82.61% and an F1-score of 0.83, the XLM-ROBERTa model fared better than the other deep learning and machine learning models. In low-resource languages, the research fills a knowledge vacuum and provides a workable plan to prevent cyberbullying. Shah et al. [14] proposes Hinglish CBD by ML and Natural Language Processing (NLP). By using feature extraction techniques like TF-IDF and potent ML classifiers, it tackles problems with biased datasets and keyword matching. By examining YouTube comments, WhatsApp chats, and tweets, researchers can predict cyberbullying in real time. Hannan Bin Azhar and Runa [15] compared the RoBERTa transformer model to traditional machine and deep learning models to see how well it detects cyberbullying. A real-world dataset of about 48,000 manually annotated tweets was used to train the algorithm. According to the results, RoBERTa fared better than any other model in terms of accuracy (83.9%) and had a higher ability to understand context when identifying nuanced forms of cyberbullying. The authors of this paper [16] describe an ML method that uses optical character recognition and NLP to detect CB in screenshots and images submitted to social networks. The proposed technique recognizes instances of bullying and non-bullying language in photos. Eight ML classifiers extract features using TF-IDF and Bow. Logistic regression using linear SVC has a 96% accuracy rate. Saini et al. [17] has examined the performance of ensemble CNN-SVM and BERT models in detecting cyberbullying. They were tested on different datasets. As the findings, the BERT model performed better than the ensemble model, which had a 96.88% accuracy. Here, research by García-Méndez et al. [18] presented an explainable real-time cyberbullying detection system that merges GPT-4o-mini and stream-based machine learning models. It identifies seven semantic features, such as abusive, racist, threatening, and sarcastic expressions, and leverages these to build an adaptive RF classifier on the Kaggle Cyberbullying dataset. The newly developed system scored an F1-score of 90.06% and an accuracy of 90.55%, proving the success of incorporating large language models with explainable machine learning.
To help large language models identify instances of cyberbullying, research by Saeid et al. [19] presents an aggression-enhanced prompting framework. As further context for the cyberbullying prompt, it determines whether a post is overly aggressive, covertly aggressive, or not aggressive. We use instruction-tuned Gemma models with LoRA fine-tuning to assess zero-shot, few-shot, and multi-task. Aggression-informed prompts significantly enhance detection. The top model achieved a macro-F1 score of 0.99 on the cyberbullying dataset.
Table 1 highlights the key challenges faced by previous cyberbullying detection studies and the solutions proposed by the current method. It shows that many earlier studies were limited by issues such as reliance on single datasets, class imbalance, suboptimal feature selection, restricted hyperparameter tuning, and the use of standalone models without ensemble learning. In contrast, the proposed approach addresses these limitations through SMOTE to handle class imbalance, NGO-based feature selection and hyperparameter optimization to enhance model performance, and a stacking ensemble technique to improve generalization and predictive accuracy across five test datasets. This holistic strategy effectively overcomes the methodological shortcomings of prior research, resulting in a more robust and scalable tool for detecting cyberbullying.
Cyberbullying can be detected by transformer-based models such as BERT and RoBERTa, according to recent research. Class balance, feature selection, and hyperparameter optimization are not often combined in these resource-intensive methods. On the other hand, the proposed approach reduces computer complexity while increasing performance through the use of stacking ensemble learning, NGO-based optimization, and SMOTE.
Table 1. Previous study limitations and proposed study solutions
|
Ref. |
Key Limitations of Previous Study |
How the Proposed Study Addresses These Limitations |
|
[10] |
Relied on a computationally expensive multilingual transformer model. |
Uses a lightweight SMOTE-NGO stacking ensemble evaluated on five benchmark datasets. |
|
[11] |
Evaluated on a single small Twitter dataset without class balancing or cross-validation. |
Applies SMOTE and 5-fold stratified cross-validation across five datasets. |
|
[12] |
Used manual feature engineering on one dataset without optimization. |
Automates feature selection and hyperparameter tuning using the NGO algorithm. |
|
[13] |
Adopted a single XLM-RoBERTa model on a small dataset without optimization. |
Employs an NGO-optimized stacking ensemble tested on five English benchmark datasets. |
|
[14] |
Implemented a TF-IDF + machine learning approach without optimization or ensemble learning. |
Integrates NGO optimization and stacking ensemble learning with balanced data. |
|
[15] |
Used a computationally intensive RoBERTa model without class balancing or feature selection. |
Combines SMOTE, NGO optimization, and efficient machine learning classifiers. |
|
[16] |
Relied on OCR-based processing, which is prone to text extraction errors and lacked optimization. |
Processes text directly and applies NGO-based feature selection and hyperparameter tuning. |
|
[17] |
Evaluated BERT and CNN-SVM models on only two datasets without balancing or systematic tuning. |
Uses SMOTE-NGO stacking and evaluates performance across five benchmark datasets. |
|
[18] |
Tested on a single dataset without evolutionary optimization or comprehensive balancing. |
Employs SMOTE, NGO optimization, and stacking ensemble learning across five datasets. |
|
[19] |
Required an additional aggression detection model and lacked automated optimization. |
Eliminates auxiliary models by using a unified SMOTE-NGO optimized stacking framework. |
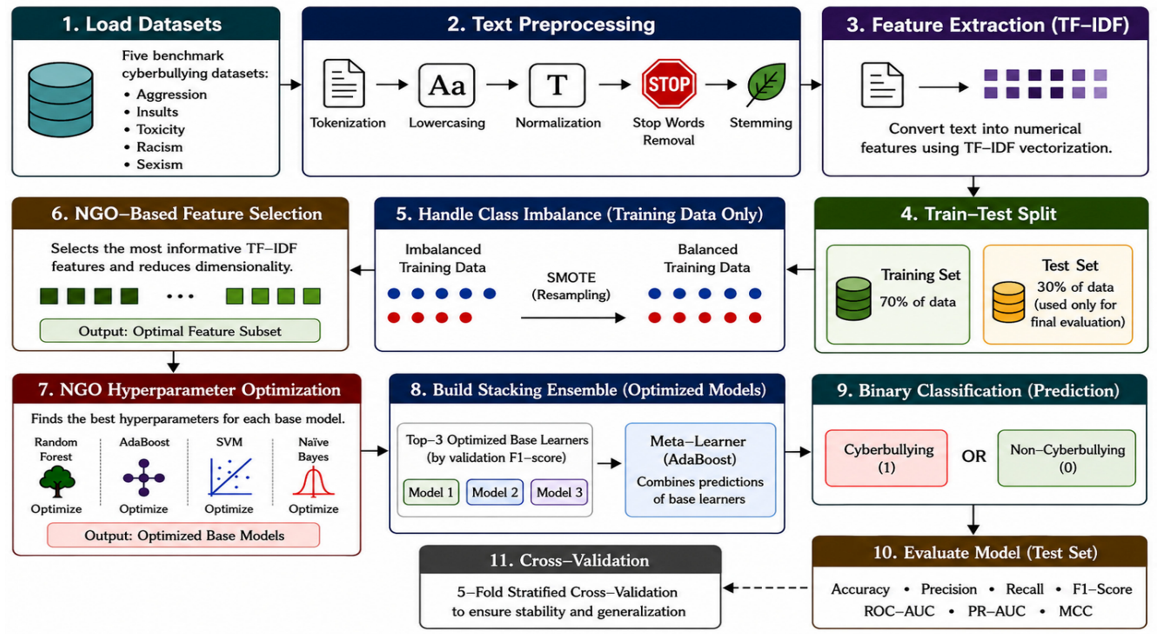
The proposed methodology described in this section employs a cyberbullying detection framework combining TF-IDF and NGO feature extraction, selection, and hyperparameter tuning with an ensemble of optimized ML models (NN, SVM, RF, and AdaBoost) to optimize model performance for cyberbullying detection, as shown in Figure 1, as proposed in the optimization ensemble model of the cyberbullying detection architecture.
Figure 1. Optimization ensemble model of cyberbullying detection architecture
A six-step process is outlined for cyberbullying detection on social media platforms:
1. The datasets are preprocessed using tokenization, lowercasing, text normalization, stop-word removal, and stemming.
2. TF-IDF is applied to convert the cleaned text into numerical feature vectors.
3. Each dataset is split into training (70%) and testing (30%) sets. SMOTE is then applied only to the training data to handle class imbalance.
4. NGO is used to select the most informative TF-IDF features and optimize the hyperparameters of RF, AdaBoost, SVM, and NB.
5. The top-performing optimized classifiers are combined using a stacking ensemble with AdaBoost as the meta-learner to perform binary classification. 6. The framework is evaluated using 5-fold stratified cross-validation and metrics including Accuracy, Precision, Recall, F1-score, ROC-AUC, PR-AUC, and matthews correlation coefficient (MCC).
3.1 Dataset collection
This study utilizes five benchmark English cyberbullying datasets collected from Kaggle, Twitter, and Wikipedia Talk Pages. The datasets cover different forms of abusive language, including aggression, toxicity, racism, sexism, and insults. In total, the combined datasets contain 312,115 labeled text samples [20]. Figure 2 illustrates the distribution of the selected datasets, and Table 2 summarizes their sources and sample sizes.
Figure 2. Cyberbullying datasets distribution
Table 2. Summary of cyberbullying datasets with sources and sample sizes
|
No. |
Dataset |
Samples |
Source |
|
1 |
Aggression |
115,820 |
|
|
2 |
Parsed / Insults |
8,790 |
Kaggle |
|
3 |
Toxicity |
159,637 |
Wikipedia |
|
4 |
Racism |
13,232 |
|
|
5 |
Sexism |
14,636 |
Kaggle |
3.2 Data preparation
Data preparation is a key step in data mining. The several ways and steps for preparing data are all connected and work toward making data better for analysis. The type and amount of data mining work will define the preprocessing method [21]. To standardize and improve text data, you need to do a few things:
3.3 Extracting features of cyberbullying
The process of extracting features is a key step in NLP tasks, including cyberbullying detection. To identify cyberbullying elements, to employ feature extraction techniques such as TF-IDF are employed, as described in the following sections.
3.3.1 Frequency representation of documents (TF-IDF)
TF-IDF is a feature extraction technique that weights words based on their frequency within a document and across the corpus. Eq. (1) illustrates how common terms in a document are given higher scores, while frequent words across all texts are down-weighted using inverse document frequency (IDF), resulting in modified term frequencies for training classifiers [27].
$T F-I D F=\left(T F_i * I D F_i\right)$ (1)
The frequency of word i in the document is denoted by the variable $T F_i$, while the inverse document frequency is denoted by $I D F_i$.
3.4 Optimizing hyperparameters and features
This section looks at NGO as a wrapper approach for Feature Selection and hyperparameter tweaking. It evaluates solutions based on model performance, such as classification accuracy or error rate, after iteratively training the model to optimize feature and input selection [28]. Wrapper approaches, such as NGO, require repetitive model training, but provide excellent accuracy in Feature Selection.
3.4.1 Northern goshawk optimization
This section introduces the NGO algorithm and its mathematical representation.
A. Inspiring and behavioral traits of the northern goshawk
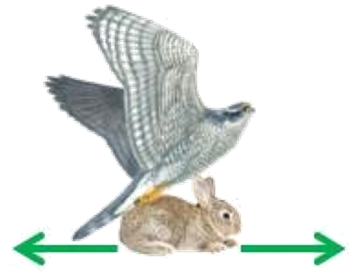
The northern goshawk is a medium-sized bird from the Accipitridae family hunts rodents, rabbits, foxes, raccoons, and birds. Males in North America and Eurasia are smaller (780 g, 46-61 cm, wingspan 89-105 cm) than females (1220 g, 58-69 cm, wingspan 108-127 cm). They swoop down on prey with brief tail pursuits and hunt intelligently. Mathematics models were used to create the NGO algorithm [29].
B. Algorithm initialization
The population-based technique known as NGO was developed in response to the hunting habits of northern goshawks. With variable values recorded as vectors in a population matrix, every NGO member stands in for a solution. The search space is initialized at random at the beginning of the process, and the population is iteratively updated using the NGO criteria specified in [29].
$\left[\begin{array}{c}W_1 \\ \vdots \\ W_i \\ \vdots \\ W_N\end{array}\right]=\left[\begin{array}{ccccc}W_{1,1} & \cdots & W_{1, j} & \ldots & W_{1, m} \\ \vdots & \ddots & \vdots & \ddots & \vdots \\ W_{i, 1} & \cdots & W_{i, j} & \cdots & W_{i, m} \\ \vdots & \ddots & \vdots & \ddots & \vdots \\ X_{N, 1} & \cdots & W_{N, j} & \cdots & W_{N, m}\end{array}\right]$ (2)
Let Wi denote the ith candidate solution, and let Wi,j denote the value of the jth variable specified by ith candidate solution. The population of northern goshawks is denoted by W, with N being the population size and m the number of problem variables. Each individual in the population represents a potential solution to the optimization problem, enabling the evaluation of the objective function for every member. The objective function values across the population can be vectorized using Eq. (3) [29].
$\mathrm{Y}(\mathrm{x})=\left[\begin{array}{c}Y_1=Y\left(W_1\right) \\ \vdots \\ Y_i=Y\left(W_i\right) \\ \vdots \\ Y_N=Y\left(W_N\right)\end{array}\right]$ (3)
The vector of objective function values is denoted by Y, where Yi represents the objective function value of the ith solution. The optimal solution is determined based on the objective function value: Lower values are preferred in minimization problems, while higher values are favored in maximization problems. Since objective function values are updated in each iteration, the best solution must be continuously tracked and updated accordingly.
C. Northern goshawk optimization mathematical modeling
The way northern goshawks hunt served as the model for an algorithm created by an NGO to update population data. It replicates two essential elements of the bird’s behavior: finding and catching prey and alternating between chasing targets or dodging dangers, all of which are done in two separate phases.
Phase 1: Prey identification (exploration): The northern goshawk quickly attacks its randomly chosen prey during the first stage of hunting. Similar to this, the NGO-inspired algorithm’s exploration capability is improved by using randomness in the selection of individuals from the search space. To find the most promising area, a worldwide search is conducted at the end of this stage. This stage is similar to the goshawk’s activity in identifying and pursuing prey. This initial stage is represented mathematically by Eqs. (4) and (5) [29].
$P_i=W_{K, i}=1,2, \ldots \ldots N, K=1,2, \ldots, i-1, i, i+1, \ldots \ldots, N$. (4)
$W_{i, j}^{\text {new, } p_1}= \begin{cases}W_{i, j}+r\left(p_{i, j}-I W_{i, j}\right), & Y_{P_i}<Y_i \\ W_{i, j}+r\left(W_{i, j}-P_{i, j}\right), & Y_{P_i} \geq Y_i\end{cases}$ (5)
$W_i=\left\{\begin{array}{l}W_i^{\text {new }, p_1}, Y_i^{\text {new }, P_1}<Y_i \\ W_i, Y_i^{\text {new }, P_1} \geq Y_i\end{array}\right.$ (6)
In the range [1, N], k is a randomly chosen natural number, $Y_p$ represents the objective function value associated with the northern goshawk, and Pi denotes the position of the prey for the ith goshawk. During the initial phase of the NGO algorithm, the updated objective function value for the ith candidate solution is denoted by $Y_i^{\text {new, } P_1}$, with the corresponding updated position given by $W_{i, j}^{\text {new, } p_1}$. The parameter r is a random value uniformly distributed in [0, 1], and the index i is randomly selected from the set {1, 2} [29].
Phase 2: Exploitation Operation Chase and Escape: Northern goshawks pursue fleeing prey, skillfully tracking them before attacking. In the NGO-inspired algorithm, this behavior enhances local search precision within a defined attack radius R. Figure 3 shows the pursuit, while Eqs. (6)-(9) model this second phase [29].
$W_{i, j}^{\text {new, } p_2}=W_{i, j}+R(2 r-I) W_{i, j}$ (7)
$R=0.02\left(1-\frac{t}{T}\right)$ (8)
$W_i=\left\{\begin{array}{cc}W_{i, j}^{\text {new }, P_2}, & Y_i^{\text {new }, P_2}<Y_i \\ W_i, & Y_i^{\text {new }, P_2} \geq Y_i\end{array}\right.$ (9)
The maximum number of iterations is T, and the iteration counter is t. $Y_i^{\text {new, } P_2}$, the goal function’s value, is established by the second step of NGO. The jth dimension is $W_{i, j}^{\text {new, } p_2}$, while the new status for the ith suggested solution is $W_i^{\text {new, } p_2}$.
The proposed NGO algorithm iteratively updates each population member in 50 steps by recalculating the objective function and population values and searching for the optimal solution. Eqs. (4)-(9) are used to update individuals during the iterations until the halting requirement is met. The best outcome of the procedure is then utilized as the quasi-optimal solution to the optimization problem.
3.4.2 Northern goshawk optimization features selection and hyperparameter optimization
The proposed wrapper-based optimization strategy uses the NGO algorithm to choose features and tune base classifier hyperparameters. Each candidate solution is a two-part hybrid vector. The first portion is a binary vector of selected TF-IDF features, with 1 indicating selection and 0 indicating exclusion. The second section includes hyperparameter values for RF, AdaBoost, SVM, and Naive Bayes classifiers. Table 3 lists hyperparameter search ranges and reproducibility-ensuring random seed values. A feature subset from the training data is utilized to train the classifier with the provided hyperparameter settings for each candidate solution. The weighted F1-score on the validation set is adopted as the fitness function. NGO iteratively adjusts the population to maximize classification performance and minimize feature subset dimensionality. The stacking ensemble model uses the best feature subset and hyperparameter configuration for each classifier as base learners after optimization. In addition, Table 4 provides a concise overview of the quantitative attributes of the five datasets. These attributes include the following: total samples, training and testing splits, vocabulary sizes before and after preprocessing, TF-IDF dimensionality, and the number of features preserved after NGO-based feature selection.
Figure 3. Northern goshawk-prey chase [29]
Table 3. Northern goshawk optimization (NGO) hyperparameter search ranges and random seed values
|
Classifier |
Hyperparameter |
Search Range |
|
Random Forest |
n_estimators |
50 – 200 |
|
|
max_depth |
5 – 30 |
|
|
random_state |
{42, 123, 2024} |
|
AdaBoost |
n_estimators |
50 – 200 |
|
|
learning_rate |
0.01 – 2.0 |
|
|
random_state |
{42, 123, 2024} |
|
Support Vector Machine |
C |
0.1 – 10.0 |
|
|
kernel |
{linear, rbf} |
|
Naïve Bayes |
alpha |
0.001 – 1.0 |
|
NGO NGO NGO |
Population Size |
30 |
|
|
Maximum Iterations |
50 |
|
|
Fitness Metric |
Weighted F1-score |
|
|
Random Seeds |
{42, 123, 2024} |
3.5 Machine learning classification algorithms
The following section describes several classification ML algorithms:
3.5.1 Random Forest classifier
RF is a flexible, simple, and robust supervised machine learning method capable of handling both classification and regression tasks. It works by constructing a collection of decision trees (DTs) that operate collectively to improve prediction accuracy. In classification, each tree independently predicts the class label, and the final output is determined by majority voting among all trees [30].
3.5.2 AdaBoost
AdaBoost is a classification algorithm that combines multiple weak learners, usually DTs, into a strong classifier. Each training instance starts with equal weight, and misclassified instances receive higher weights in subsequent rounds. The weighted errors of weak learners are used to build the final strong classifier, as shown in Eq. (10).
$H(x)=\operatorname{sign}\left(\sum_{t=1}^T \alpha_t \cdot h_t(x)\right)$ (10)
The base model is ht(x), while the strong model is H(x). Let αt stand for each model’s weights and sign to define. In order to increase classification accuracy, AdaBoost highlights data that weak classifiers have misidentified, and the final total can be either positive or negative (-1, +1). AdaBoost’s weak base classifiers are well-liked for resolving challenging classification problems [31].
3.5.3 Support Vector Machine
SVM is a supervised learning algorithm effective for classification. It finds an optimal hyperplane to separate classes. Using kernel functions, SVM handles linear and non-linear data by mapping inputs to higher-dimensional spaces, enabling complex decision boundaries for classifying new samples [32-34].
3.5.4 Naive Bayes algorithm
Naive Bayes calculates conditional probability, predicting whether one event will occur if another has already occurred. This classification approach employs Bayes’Theorem and predictor independence. In NB, one feature within a class is independent of the others. Naive Bayes is efficient, simple to implement, and effective for large datasets. Text classification using binary and multiclass classifications is accurate [35, 36].
3.6 Proposed SMOTE-NGO stacking ensemble framework
To enhance classification and generalization, advanced ensemble approaches, such as stacking ensemble learning, integrate predictions from base classifiers. To improve the results of the basic model, stacking employs a meta-learner, a second-level classifier, as opposed to bagging and boosting. For this study's base learning, four top-notch machine learning classifiers were used: RF, AB, SVM, and NB. The NGO algorithm chose features and optimized hyperparameters for each base classifier before training the model. To train the improved classifiers, a feature subset from TF-IDF vectorization and SMOTE oversampling was utilized. as in Table 5, which compares the five cyberbullying datasets' class distributions before and after SMOTE.
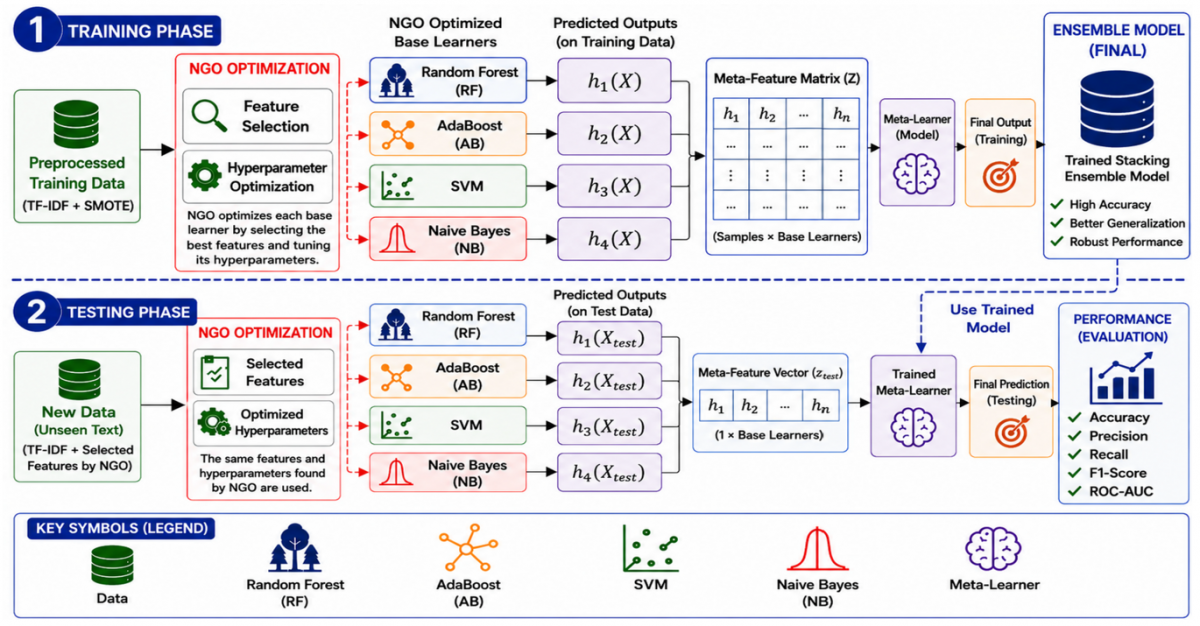
The table displays the degree of class imbalance in each dataset and the amount of synthetic minority-class samples produced by SMOTE to achieve balanced training data. Cyberbullying incidents were significantly underrepresented in all five datasets prior to oversampling. Dataset 1 had 81,074 training samples; 10,347 were from the minority class and 70,727 were from the majority class. This is to demonstrate the point. To maintain a balanced dataset, SMOTE generated 60,380 synthetic samples, bringing the total number of samples to 141,454. With 10,753 minority class samples and 100,992 majority class samples, Dataset 3 also showed the most severe discrepancy. In order to establish a balanced collection of 201,984 cases, SMOTE generated 90,239 synthetic samples. This procedure was also applied to the other datasets. Dataset 2 added 2,225 hypothetical examples to increase the number of samples from 6,153 to 8,378. The addition of 6,504 synthetic samples raised the sample size of Dataset 4 from 9,262 to 15,766, while the addition of 5,521 synthetic instances raised the sample size of Dataset 5 from 10,245 to 15,766. After applying SMOTE to all datasets, the numbers of occurrences from the majority and minority classes were identical. Training classifiers, tuning hyperparameters, and picking features were all made easier once this balancing phase reduced the model's bias toward the majority class. Apply the NGO algorithm for feature selection and hyperparameter tweaking during training, as I explained in Section 3.4.2. All of the base classifiers make predictions about the training samples. A meta-feature matrix is constructed for the purpose of training meta-learners by merging these outputs. To make a classification decision in testing, the trained meta-learner takes the meta-feature vector from the basic classifier predictions and applies it.
Table 4. Quantitative statistics of preprocessing, TF-IDF, and northern goshawk optimization (NGO)-based feature selection across five datasets
|
Statistic |
Dataset 1 (Aggression) |
Dataset 2 (Parsed/Insults) |
Dataset 3 (Toxicity) |
Dataset 4 (Racism) |
Dataset 5 (Sexism) |
|
Total Samples |
115,820 |
8,790 |
159,637 |
13,232 |
14,636 |
|
Training Samples (70%) |
81,074 |
6,153 |
111,745 |
9,262 |
10,245 |
|
Testing Samples (30%) |
34,746 |
2,637 |
47,892 |
3,970 |
4,391 |
|
Vocabulary Size Before Cleaning |
444,146 |
50,461 |
548,178 |
34,473 |
39,393 |
|
Vocabulary Size After Cleaning |
134,821 |
22,819 |
161,158 |
13,057 |
14,074 |
|
Training TF-IDF Matrix Shape |
81,074 × 115,820 |
6,153 × 22,819 |
111,745 × 159,637 |
9,262 × 13,057 |
10,245 × 14,074 |
|
TF-IDF Maximum Features |
134,821 |
22,819 |
161,158 |
13,057 |
14,074 |
|
Number of Features Before NGO |
115,820 |
22,819 |
159,637 |
13,057 |
14,074 |
|
Number of Features After NGO |
81,074 |
15,973 |
111,746 |
9,140 |
9,852 |
Table 5. Class distribution before and after applying Synthetic Minority Oversampling Technique (SMOTE) across the five datasets
|
Dataset |
Total Samples Before SMOTE |
Majority Class Before SMOTE |
Minority Class Before SMOTE |
Synthetic Samples Generated |
Total Samples After SMOTE |
Majority Class After SMOTE |
Minority Class After SMOTE |
|
Dataset 1 |
81,074 |
70,727 |
10,347 |
60,380 |
141,454 |
70,727 |
70,727 |
|
Dataset 2 |
6,153 |
4,189 |
1,964 |
2,225 |
8,378 |
4,189 |
4,189 |
|
Dataset 3 |
111,745 |
100,992 |
10,753 |
90,239 |
201,984 |
100,992 |
100,992 |
|
Dataset 4 |
9,262 |
7,883 |
1,379 |
6,504 |
15,766 |
7,883 |
7,883 |
|
Dataset 5 |
10,245 |
7,883 |
2,362 |
5,521 |
15,766 |
7,883 |
7,883 |
Figure 4 illustrates the process by which NGOs select the most informative features and adjust the hyperparameters of all base learners prior to constructing the meta-learning layer within the stacking ensemble architecture. For the input feature matrix X, let $h_1(x), h_2(x), \ldots,(x)$ be the expected results of the n best base classifiers. To generate a meta-feature matrix, the results are concatenated, as represented mathematically by Eq. (11).
$Z=\left[h_1(x), h_2(x), \ldots \ldots, h_n(x)\right]$ (11)
where, Z stands for the base learners' predictions. The final prediction is then generated by training a meta-classifier g(⋅) on Z, as represented mathematically by Eq. (12).
$\overbrace{y}=g(Z)$ (12)
where, $\overbrace{y}$ denotes the final predicted class label.
The suggested stacking ensemble offers a strong and efficient framework for cyberbullying detection on datasets with different class imbalance ratios by combining the strengths of numerous optimal classifiers.
3.7 Experimental setup
Python and Google Colab were used for all tests. To preserve class distributions, stratified sampling divided each dataset into 70% training and 30% testing groups. NGO optimization used 5-fold stratified cross-validation on training data. TF-IDF vectorization with unigram and bigram representations converted text to numbers. After feature selection, SMOTE was applied only to the training set to solve class imbalance. The NGO algorithm used the weighted F1-score as the fitness function and had a population size of 30 and a maximum of 50 iterations. Three random seed values 42, 123, and 2024, were used to improve resilience and reduce randomness. The best solution was kept. Experiment parameters used in this study are listed in Table 6.
Figure 4. The SMOTE-NGO optimized stacking ensemble framework for cyberbullying detection
Table 6. Experimental setup
|
Parameter |
Value |
|
Train/Test Split |
70% / 30% |
|
Validation Split |
5-Fold Stratified CV |
|
Feature Extraction |
TF-IDF (Unigrams + Bigrams) |
|
Class Balancing |
SMOTE |
|
NGO Population Size |
30 |
|
NGO Maximum Iterations |
50 |
|
Fitness Metric |
Weighted F1-score |
|
Random Seeds |
42, 123, 2024 |
|
Programming Language |
Python 3 |
|
Environment |
Google Colab |
3.8 Evaluating performance models
The performance of classifiers is evaluated using metrics such as accuracy, precision, recall, F1-measure, and Receiver Operating Characteristic (ROC) curve. These measures help identify the most effective classifier based on higher performance scores. Eqs. (13)-(18), define the calculations for precision, recall, accuracy, F1-score, and the ROC curve [37].
$\text{Precision} =\frac{\mathrm{TP}}{T P+F P}$ (13)
$\text{Recall} =\frac{\mathrm{TP}}{T P+T N}$ (14)
$\text{Accuracy}=\frac{\mathrm{TP}+\mathrm{TN}}{T P+T N+F P+F N}$ (15)
$\mathrm{F} 1-$ score $=\frac{2 \times \text { Precision × Recall }}{\text { Precision }+ \text { Recall }}$ (16)
AUC-ROC evaluates a model’s ability to distinguish between positive and negative cases across classification thresholds. True Positive Rate (TPR) measures correctly identified positives, while False Positive Rate (FPR) indicates misclassified negatives. An area under the curve (AUC) of 1 represents perfect classification, 0.5 indicates random performance, and below 0.5 suggests an inverted model. This metric is especially useful for imbalanced datasets or varying costs of false positives and negatives, as shown in Eqs. (15) and (16) [38].
$T P R=\frac{T P}{T P+F N}$ (17)
$F P R=\frac{F P}{(F P+T N)}$ (18)
MCC is part of the set of performance indicators. In order to determine the Pearson product-moment correlation coefficient between the actual and expected values, a contingency matrix is utilized. Supplemental measure that is independent of biased data sets. In Eq. (19), the entry for MCC is shown by the study [39].
$\begin{aligned} & M C C =\frac{T P \cdot T N-F N \cdot F N}{\sqrt{(T P+F P) \cdot(T P+F N) \cdot(T N+F N)(T N+F N)}}\end{aligned}$ (19)
Optimal value: +1; lowest value: –1.
For binary predictors that successfully anticipate the majority of positive and negative data instances, MCC is the sole binary classification rate that achieves good scores [39].
3.9 Experimental results
This study proposes a hybrid framework for cyberbullying detection that integrates SMOTE, NGO, and a stacking ensemble classifier. The NGO algorithm was employed to identify the most discriminative TF-IDF features and to optimize the hyperparameters of four base classifiers, namely RF, SVM, AdaBoost, and NB. The optimized classifiers were subsequently combined using a stacking ensemble architecture to improve classification performance on imbalanced cyberbullying datasets. For each dataset, the data were split into 70% training and 30% testing subsets using stratified sampling to preserve the original class distribution. To ensure robust and reproducible performance estimates, 5-fold stratified cross-validation was applied to the training set. All experiments were conducted using a fixed random seed of 42. To prevent data leakage, SMOTE oversampling and NGO-based feature selection and hyperparameter optimization were performed exclusively on the training folds. Table 7 presents the optimal hyperparameter values obtained by NGO for the four base classifiers across the five datasets. The performance of the proposed framework was evaluated using accuracy, precision, recall, F1-score, AUC, ROC-AUC, PR-AUC, and MCC. In addition, confusion matrices, ROC curves, and learning curves were generated to provide a comprehensive assessment of model performance and generalization capability. The experimental results presented in Tables 8–12 and Figures 4–8 demonstrate that the proposed SMOTE-NGO stacking ensemble consistently outperformed the individual classifiers before and after optimization. These findings confirm the effectiveness of integrating data balancing, feature selection, hyperparameter optimization, and ensemble learning for robust cyberbullying detection across datasets with varying imbalance ratios.
Table 8 shows that SMOTE and NGO balanced the dataset and adjusted hyperparameters to improve model performance. TF-IDF processed text data helped RF and SVM achieve strong recall and F1-scores. The stacking ensemble classifier optimizes accuracy, precision, recall, F1-score, and AUC using base model strengths with NGO. This study found that imbalanced datasets and cyberbullying detection benefit from the integration of SMOTE with NGO and the stacking ensemble classifier.
Results are in Table 9: The experimental design compares cyberbullying categorization models before and after SMOTE and NGO optimization. The table shows that augmentation improves the stacking ensemble classifier model. The model performed well in this trial with 99.94% accuracy, 99.95% precision, and 99.97% recall.
Table 10 shows findings: Table 10’s left side shows Naive Bayes second and Stacking Ensemble Classifier first before optimization. Bad RF, SVM, and AdaBoost jobs. After optimization, all models performed equally; however, the Stacking Ensemble Classifier obtained 100% recall and AUC. The results imply that SMOTE and NGO are needed to classify imbalanced data. A stacking ensemble classifier is best for this issue since it can discriminate cyberbullying from other scenarios.
Diagnosing racial cyberbullying requires SMOTE and NGO before optimization (Table 11). After optimization, the stacking ensemble classifier model was excellent since it was stable and performed well.
Table 12 shows that SMOTE and NGO optimization boost Twitter sexism. Improvement comes through optimization. All models improve after optimization. AUC, F1-score, accuracy, precision, and recall improved substantially. Improve input data, especially class imbalance, for performance. After the adjustment, the recall measures of all models exceed 99%, indicating that they can detect most instances of sexism in cyberbullying. Model performance varied pre-optimization. The stacking ensemble classifier outperforms RF, AdaBoost, and SVM. Right-side adjustments worked on all models. Almost all measurements allow ensemble classifier stacking.
Table 7. Optimal parameters of four base classifiers for selected samples of the dataset
|
Dataset |
Model |
F1-Score (%) |
Optimal Parameters |
|
Ds1 |
RF |
99.14 |
n_estimators = 149, max_depth = 30 |
|
AdaBoost |
99.28 |
n_estimators = 166, learning_rate = 1.3003 |
|
|
SVM |
99.59 |
C = 8.5928, kernel = linear |
|
|
Naive Bayes |
99.30 |
α = 0.1074 |
|
|
Ds2 |
RF |
98.41 |
n_estimators = 146, max_depth = 27 |
|
AdaBoost |
98.66 |
n_estimators = 145, learning_rate = 1.4784 |
|
|
SVM |
99.59 |
C = 1.3832, kernel = linear |
|
|
Naive Bayes |
98.92 |
α = 0.1075 |
|
|
Ds3 |
RF |
99.15 |
n_estimators = 140, max_depth = 27 |
|
AdaBoost |
99.41 |
n_estimators = 126, learning_rate = 1.4304 |
|
|
SVM |
99.78 |
C = 6.2695, kernel = linear |
|
|
Naive Bayes |
99.46 |
α = 0.1347 |
|
|
Ds4 |
RF |
94.76 |
n_estimators = 189, max_depth = 25 |
|
AdaBoost |
94.11 |
n_estimators = 183, learning_rate = 1.4308 |
|
|
SVM |
98.45 |
C = 1.9871, kernel = rbf |
|
|
Naive Bayes |
93.21 |
α = 0.5584 |
|
|
Ds5 |
RF |
96.53 |
n_estimators = 183, max_depth = 29 |
|
AdaBoost |
96.76 |
n_estimators = 192, learning_rate = 1.3251 |
|
|
SVM |
98.54 |
C = 2.9151, kernel = linear |
|
|
Naive Bayes |
98.09 |
α = 0.1032 |
3.9.1 Robustness and generalization analysis
Various further analyses were used to test the suggested SMOTE-NGO stacking ensemble's consistency, generalizability, and robustness. A variety of statistical tools were employed to measure the model's performance: learning curves for overfitting and convergence, ROC curves for discriminative performance across decision thresholds, 5-fold stratified cross-validation for generalization on different training subsets, and stability analysis across multiple random seeds for robustness and reproducibility. These studies go beyond the measures taken in the test set to evaluate the suggested model.
Table 8. Analysis result models performance in dataset 1
|
|
Dataset -1 Cyberbullying in Aggression Parse Without Optimization and SMOTE |
Dataset -1 Cyberbullying in Aggression Parse + Optimized with NGO+ SMOTE |
||||||||
|
Model |
Accuracy |
Precision |
Recall |
F1-Score |
AUC |
Accuracy |
Precision |
Recall |
F1-Score |
AUC |
|
RF |
66.30% |
66.44% |
61.74% |
64.01% |
70.85% |
98.29% |
98.24% |
99.11% |
99.11% |
99.56% |
|
Ada Boost |
70.63% |
73.55% |
61.68% |
67.09% |
77.06% |
98.78% |
98.20% |
99.94% |
99.36% |
99.70% |
|
SVM |
75.37% |
78.93% |
67.17% |
72.58% |
82.51% |
99.42% |
99.40% |
99.40% |
99.70% |
99.67% |
|
Naive Bayes |
84.80% |
84.98% |
84.13% |
84.55% |
92.32% |
98.63% |
98.70% |
99.87% |
99.28% |
99.60% |
|
Stacking Ensemble Classifier |
86.15% |
86.55% |
85.24% |
85.89% |
93.24% |
99.54% |
99.55% |
99.97% |
99.76% |
99.95% |
Table 9. Analysis result models performance in dataset 2
|
|
Dataset -2 Cyberbullying in Kaggle Parse Without Optimization and SMOTE |
Dataset -2 Cyberbullying in Kaggle Parse + Optimized with NGO+ SMOTE |
||||||||
|
Model |
Accuracy |
Precision |
Recall |
F1-Score |
AUC |
Accuracy |
Precision |
Recall |
F1-Score |
AUC |
|
RF |
61.88% |
66.04% |
49.65% |
56.68% |
66.77% |
98.34% |
98.26% |
99.26% |
99.12% |
99.30% |
|
Ada Boost |
66.09% |
69.67% |
57.57% |
63.04% |
72.37% |
98.78% |
98.98% |
99.72% |
99.35% |
99.41% |
|
SVM |
66.27% |
69.86% |
57.80% |
63.26% |
72.01% |
99.59% |
99.57% |
99.09% |
99.78% |
99.78% |
|
Naive Bayes |
76.49% |
71.91% |
81.75% |
76.51% |
85.81% |
98.93% |
98.86% |
99.76% |
99.43% |
99.91% |
|
Stacking Ensemble Classifier |
78.90% |
76.13% |
80.04% |
78.04% |
86.93% |
99.94% |
99.94% |
99.95% |
99.97% |
100.00% |
Table 10. Analysis result models performance in dataset 3
|
|
Dataset -3 Cyberbullying in Toxicity Parse Without Optimization and SMOTE |
Dataset -3 Cyberbullying in Toxicity Parse + Optimized with NGO + SMOTE |
||||||||
|
Model |
Accuracy |
Precision |
Recall |
F1-Score |
AUC |
Accuracy |
Precision |
Recall |
F1-Score |
AUC |
|
RF |
64.07% |
66.45% |
55.94% |
60.74% |
69.17% |
98.40% |
98.32% |
100% |
99.15% |
99.29% |
|
Ada Boost |
69.30% |
79.81% |
51.17% |
62.36% |
77.90% |
98.90% |
98.89% |
99.94% |
99.41% |
99.14% |
|
SVM |
74.57% |
80.49% |
64.45% |
71.58% |
83.04% |
99.59% |
99.57% |
100% |
99.78% |
99.73% |
|
Naive Bayes |
86.60% |
88.39% |
83.92% |
86.10% |
93.86% |
98.98% |
98.92% |
100% |
99.46% |
99.93% |
|
Stacking Ensemble Classifier |
87.00% |
88.49% |
84.73% |
86.57% |
94.06% |
99.94% |
99.94% |
100% |
99.97% |
100% |
Table 11. Analysis result models performance in dataset 4
|
|
Dataset -4 Cyberbullying in Twitter Racism Parse Without Optimization and SMOTE |
Dataset -4 Cyberbullying in Twitter Racism Parse + Optimized with NGO+ SMOTE |
||||||||
|
Model |
Accuracy |
Precision |
Recall |
F1-Score |
AUC |
Accuracy |
Precision |
Recall |
F1-Score |
AUC |
|
RF |
58.12% |
57.28% |
62.82% |
59.92% |
62.78% |
95.06% |
96.58% |
93.51% |
95.02% |
99.14% |
|
Ada Boost |
65.91% |
63.64% |
73.68% |
68.29% |
72.43% |
93.75% |
95.97% |
91.45% |
93.65% |
98.35% |
|
SVM |
70.30% |
69.01% |
73.34% |
71.11% |
77.06% |
98.38% |
97.65% |
99.17% |
98.41% |
99.83% |
|
Naive Bayes |
89.97% |
87.75% |
92.13% |
89.88% |
95.92% |
93.59% |
89.84% |
98.41% |
93.93% |
98.77% |
|
Stacking Ensemble Classifier |
90.86% |
89.92% |
91.34% |
90.62% |
96.41% |
98.91% |
98.81% |
99.04% |
98.92% |
99.90% |
Table 12. Analysis result models performance in dataset 5
|
|
Dataset -5 Cyberbullying in Twitter Sexism Parse Without Optimization and SMOTE |
Dataset -5 Cyberbullying in Twitter Sexism Parse + Optimized with NGO+ SMOTE |
||||||||
|
Model |
Accuracy |
Precision |
Recall |
F1-Score |
AUC |
Accuracy |
Precision |
Recall |
F1-Score |
AUC |
|
RF |
59.00% |
61.04% |
56.18% |
58.51% |
63.39% |
94.16% |
94.08% |
100.00% |
96.95% |
98.11% |
|
Ada Boost |
63.79% |
66.38% |
60.02% |
63.04% |
70.56% |
93.67% |
93.72% |
99.89% |
96.70% |
94.48% |
|
SVM |
67.64% |
71.10% |
62.51% |
66.53% |
73.58% |
97.37% |
97.28% |
99.96% |
98.60% |
97.77% |
|
Naive Bayes |
83.72% |
84.85% |
81.82% |
83.31% |
90.87% |
95.95% |
95.86% |
99.96% |
97.87% |
97.97% |
|
Stacking Ensemble Classifier |
85.05% |
88.51% |
80.33% |
84.22% |
92.07% |
99.59% |
99.78% |
99.78% |
99.78% |
99.71% |
3.9.2 Learning curve analysis
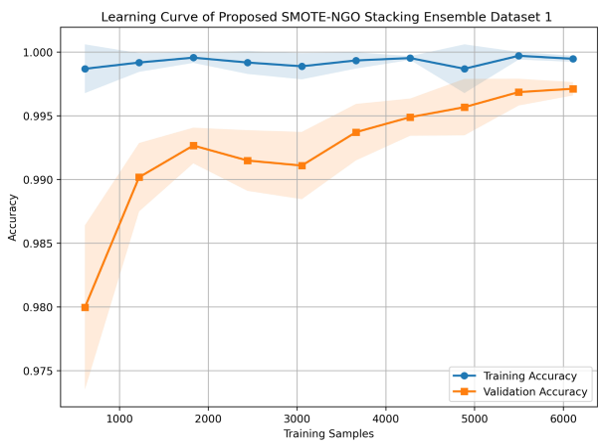
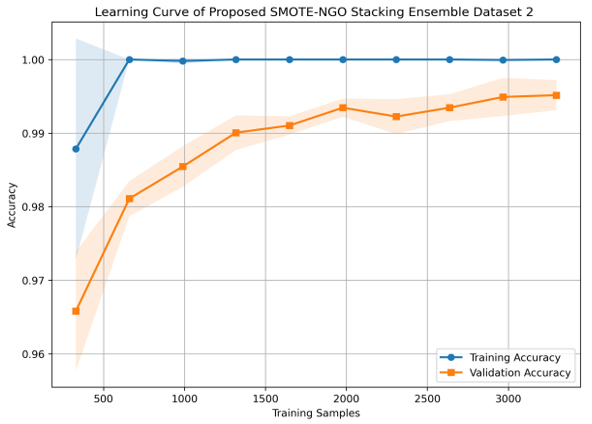
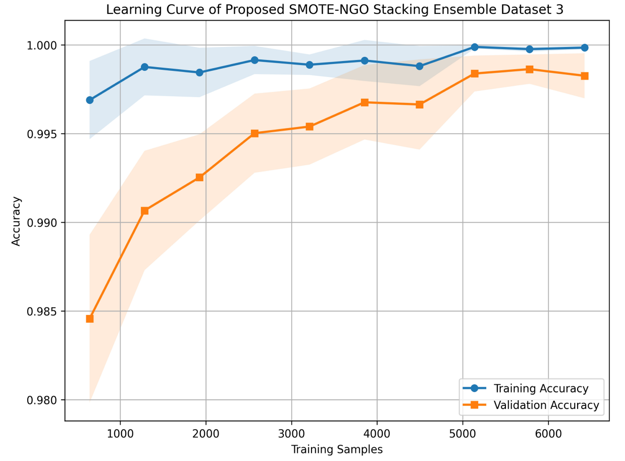
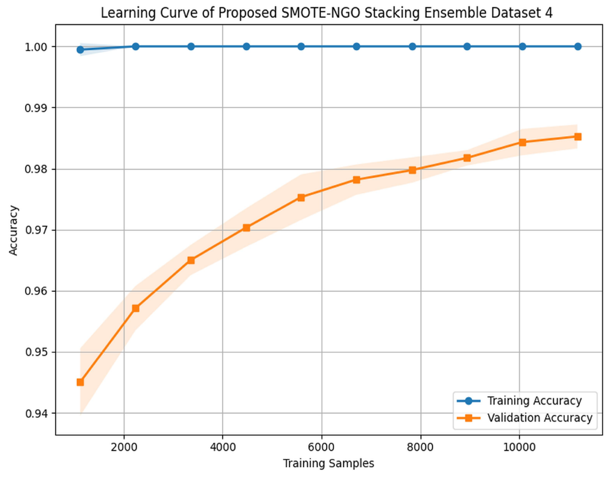
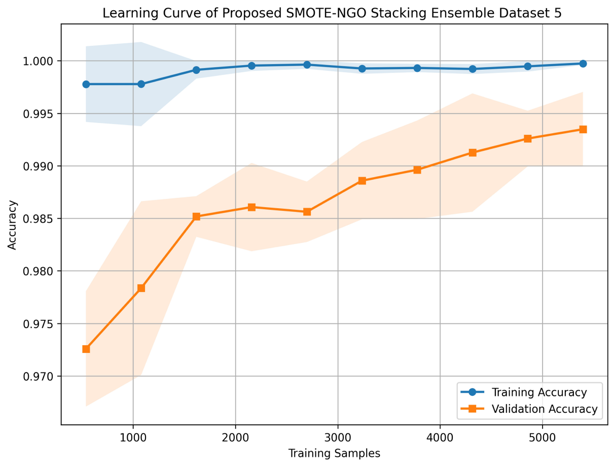
The training behavior and generalizability of the proposed SMOTE-NGO stacking ensemble were examined by creating learning curves as training samples were amassed. Each dataset's convergence behavior and model stability may be observed in the graphs as illustrated in Figures 5–9, which display the training and validation accuracy over larger portions of the training data. The outcomes demonstrate that the NGO algorithm improved the stacking ensemble hyperparameters for better prediction performance and generalization. Training accuracy stayed near 100% across all five datasets, whereas validation accuracy rose steadily as training data increased. Without overfitting or underfitting, the model learns resilient decision constraints, as seen by the slight and declining gap between the two curves. The confidence intervals of the validation curve shrank as the sample size grew, suggesting less variation and more reliable model predictions. More training cases stabilize the ensemble, as this pattern indicates. These findings are validated by an analysis that is specific to the dataset considered. Training on Dataset 1 was nearly flawless, with validation accuracy increasing from 98.0% to 99.7%. Just like in Dataset 2, validation accuracy went up from 96.6% to 99.5%, indicating effective learning even with a lower baseline. Dataset 3's validation accuracy was the highest at almost 99.8 percent, and it nearly overlapped the training curve, suggesting very little variation and excellent generalizability. Validation accuracy increased from 94.5% to 98.5% on the most challenging dataset 4, demonstrating the model's ability to handle increasingly complicated data distributions. Validation accuracy increased from 97.3% to 99.4% as a result of a smaller training-validation gap in Dataset 5, which was achieved by expanding the training set. The learning curves demonstrate that the suggested SMOTE-NGO stacking ensemble performs admirably across different abuse datasets, remains stable with more data, and improves with time. This model is a strong and accurate cyberbullying detector, as shown by its near-saturated training accuracy, steadily increasing validation performance, and shrinking uncertainty bands.
3.9.3 Compare Receiver Operating Characteristic curve analysis
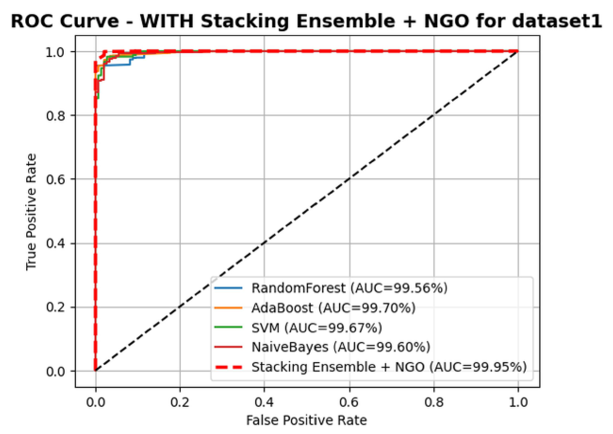
The ROC curves were used at various discrimination thresholds to assess the model's categorization ability. Model discrimination is measured by the AUC, and the trade-off between TPR and FPR is shown by the ROC curve. Positive upper-left curves and AUC values indicate effective cyberbullying detection. Figures 10-14 illustrate datasets (1)-(5). ROC curves and AUC values were generated after optimization. The performance analysis for each dataset is based on the figures provided: The stacking ensemble model with NGO achieved 99.95% AUC and excellent discrimination and performed best for Dataset 1 (DS1). As shown in Figure 10. Compare ROC and area curves for ML and ensemble models after optimizing ds1.
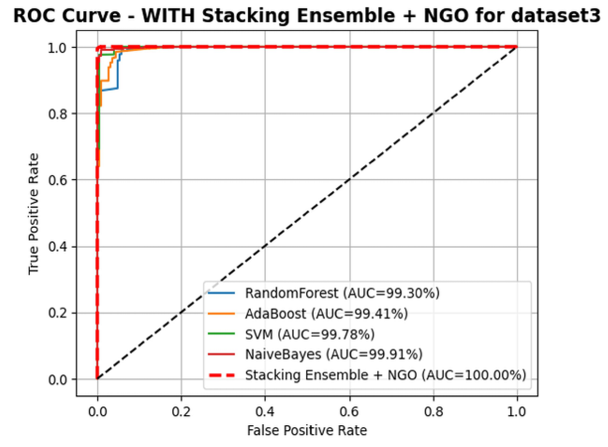
Despite its performance, Naive Bayes had a lower AUC than the stacking ensemble model. AUC was 94.06% for the stacking ensemble model in Dataset 3 before optimization. It was great to get 100% after optimization in the last analysis. As shown in Figure 12. Compare ROC and Area curves for ML and ensemble models after Optimized ds3.
Figure 5. Learning curve of proposed SMOTE-NGO stacking ensemble ds1
Figure 6. Learning curve of proposed SMOTE-NGO stacking ensemble ds2
Figure 7. Learning curve of proposed SMOTE-NGO stacking ensemble ds3
Figure 8. Learning curve of proposed SMOTE-NGO stacking ensemble ds4
Figure 9. Learning curve of proposed SMOTE-NGO stacking ensemble ds5
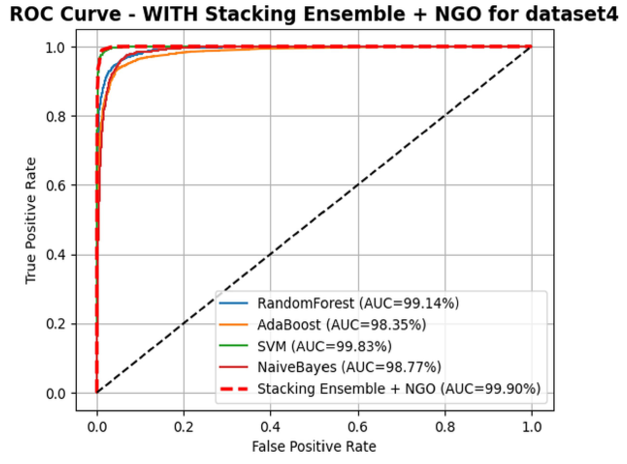
In Dataset 4, Dataset 4’s stacking ensemble model had 96.41% AUC before optimization and 99.90% after optimization. As shown in Figure 13. Compare ROC and Area curves for ML and ensemble models after Optimized ds4.
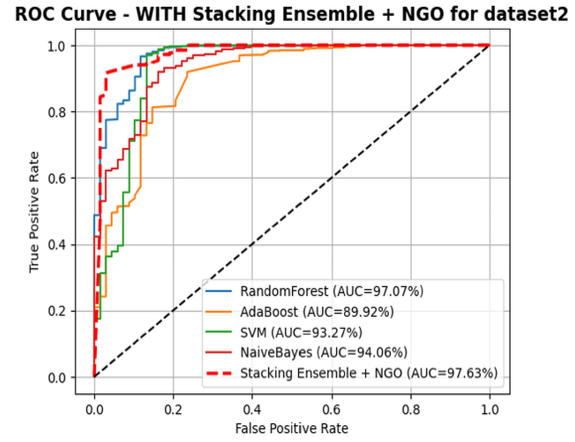
The entire stacked ensemble model scored 97.63% AUC and achieved the highest performance for Dataset 2 after tuning. All other models achieved an AUC above 89%. As shown in Figure 11. Compare ROC and Area curves for ML and ensemble models after Optimized ds2.
Figure 10. Compare Receiver Operating Characteristic (ROC) and Area curves for machine learning (ML) and ensemble models after optimized ds1
Figure 11. Compare Receiver Operating Characteristic (ROC) and area curves for machine learning (ML) and ensemble model after optimized ds2
Figure 12. Compare Receiver Operating Characteristic (ROC) and area curves for machine learning (ML) and ensemble model after optimized ds3
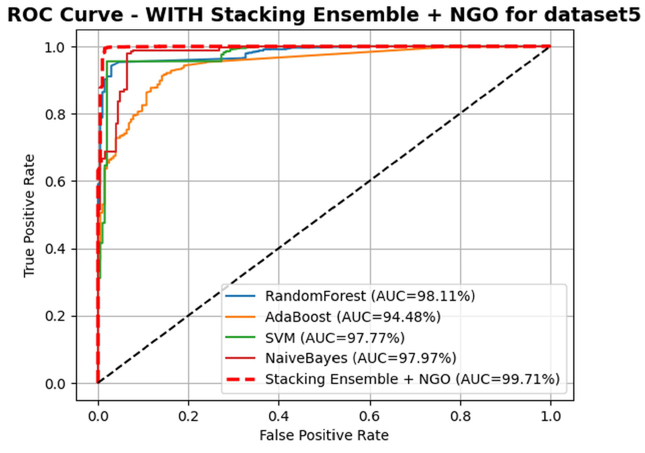
The stacking ensemble model wins Dataset 5 with 92.07% AUC before optimization and 99.71% after. Naive Bayes is superior in this data type, ranking second. Another second place for Naive Bayes shows stability. Perfect models support class differentiation with a small, tailored dataset. As shown in Figure 14. Compare ROC and Area curves for ML and ensemble models after Optimized ds5.
Figure 13. Compare Receiver Operating Characteristic (ROC) and area curves for machine learning (ML) and ensemble model after optimized ds4
Figure 14. Compare Receiver Operating Characteristic (ROC) and area curves for machine learning (ML) and ensemble model after optimized ds5
3.9.4 Fold stratified cross-validation results
On the training data, 5-fold stratified cross-validation was used to assess the generalization performance of the proposed SMOTE-NGO Stacking Ensemble. This method involved dividing the training set into five equal parts, or "folds," and maintaining the default class distribution for each. A validation set was used once for each fold, and the other four folds were utilized for training the model. A total of five evaluations were conducted on the model. When evaluating predictive performance and consistency among folds, the assessment parameters were averaged, and their standard deviations were determined. Tabulated in Table 13 are the aggregated cross-validation findings from the five benchmark datasets.
The model's strong performance across all evaluation measures showed great generalization across data divisions. With an accuracy of 99.88% ± 0.10, a precision of 99.89% ± 0.10, a recall of 99.97% ± 0.03, and an F1-score of 99.93% ± 0.06, Dataset 3 demonstrated the best cross-validation performance. With an accuracy of 99.71% ± 0.03 and an MCC of 97.37% ± 0.72, Dataset 1 produced the best results. In a similar vein, Dataset 2 showed consistent performance with an accuracy of 99.51% ± 0.31 and an MCC of 95.15% ± 0.43 Dataset 4, with an accuracy of 98.46% ± 0.25, an F1-score of 98.48% ± 0.25, and an MCC of 97.94% ± 0.10, fared well despite the difficulties it presented. With an accuracy of 99.38% ± 0.20 percent and an F1-score of 99.67% ± 0.10 percent, Dataset 5 proved to be quite accurate. The small standard deviations of all measures demonstrate the excellent generalizability and stability of the proposed model between folds.
Table 13. Results of 5-fold stratified cross-validation on five different datasets
|
Metric |
Dataset 1 (5-Fold Stratified CV) |
Dataset 2 (5-Fold Stratified CV) |
Dataset 3 (5-Fold Stratified CV) |
Dataset 4 (5-Fold Stratified CV) |
Dataset 5 (5-Fold Stratified CV) |
|
Accuracy |
99.71% ± 0.03 |
99.51% ± 0.31 |
99.88% ± 0.10 |
98.46% ± 0.25 |
99.38% ± 0.20 |
|
Precision |
99.88% ± 0.05 |
99.63% ± 0.28 |
99.89% ± 0.10 |
98.33% ± 0.33 |
99.62% ± 0.14 |
|
Recall |
99.82% ± 0.07 |
99.88% ± 0.11 |
99.97% ± 0.03 |
98.64% ± 0.47 |
99.72% ± 0.08 |
|
F1-Score |
99.85% ± 0.02 |
99.75% ± 0.16 |
99.93% ± 0.06 |
98.48% ± 0.25 |
99.67% ± 0.10 |
|
ROC-AUC |
99.67% ± 0.33 |
98.43% ± 1.62 |
99.98% ± 0.02 |
99.87% ± 0.03 |
99.70% ± 0.14 |
|
PR-AUC |
99.98% ± 0.02 |
99.94% ± 0.07 |
99.98% ± 0.002 |
99.84% ± 0.04 |
99.98% ± 0.01 |
|
MCC |
97.37% ± 0.72 |
95.15% ± 0.43 |
98.31% ± 1.93 |
97.94% ± 0.10 |
94.46% ± 1.76 |
3.9.5 Stability analysis across random seeds
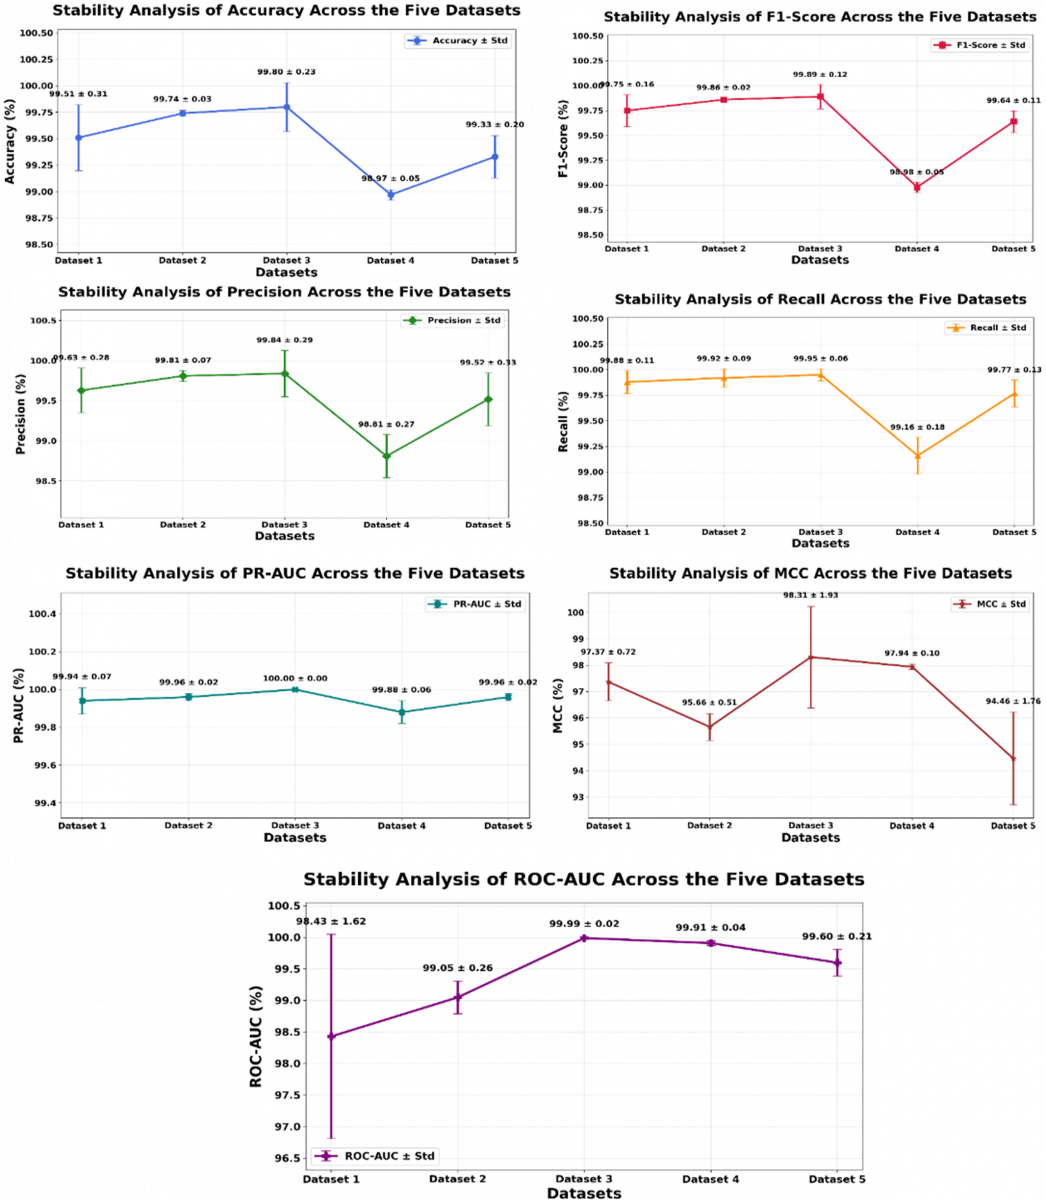
A stability study was conducted to evaluate the predicted model's repeatability when given random initializations. The experimental pipeline that included train-test splitting, SMOTE oversampling, NGO-based optimization, and stacking ensemble training was repeated three times with different seeds: 42, 123, and 2024. The assessment metrics were then normalized to determine the model's resilience and sensitivity to stochastic variation. An extremely low standard deviation indicates consistent and dependable performance throughout all tests. Table 14 provides a numerical summary of the results across all five datasets, while Figure 15 displays the Stability Analysis of Evaluation Metrics Across the Five Datasets.
The suggested SMOTE-NGO stacking ensemble consistently outperformed all assessment criteria, with minimal standard deviations, even when the initialization and data partitioning adjustments were random. Dataset 3 demonstrated the most stable results, with an accuracy of 99.80% ± 0.23%, an F1-score of 99.89% ± 0.12, a ROC-AUC of 99.99% ± 0.02, a PR-AUC of 100% ± 0, and an MCC of 98.31% ± 1.93. The high accuracy (99.51% ± 0.31 for dataset 1 and 99.74% ± 0.03 for dataset 2) and robustness were shown by these datasets. With a recall of 99.16% ± 0.18, an accuracy of 98.97% ± 0.05, precision of 98.81% ± 0.27, and MCC of 97.94% ± 0.10, the model did well on Dataset 4. The reliability was strong in dataset 5, with an accuracy of 99.33% ± 0.20 and an F1-score of 99.64% ± 0.11. Cyberbullying detection reliability is demonstrated by these results, which also demonstrate the robustness and consistency of the suggested methodology across random seeds.
Table 15 compares the datasets, techniques, optimization tactics, and performance measurements of current studies on cyberbullying detection. The SMOTE-NGO stacking ensemble outperforms state-of-the-art methods on a wide variety of benchmark datasets.
Figure 15. Stability analysis of evaluation metrics across the five datasets
Table 14. Stability analysis results of different seed number across five datasets
|
Metric |
Dataset 1 (Stability Analysis) |
Dataset 2 (Stability Analysis) |
Dataset 3 (Stability Analysis) |
Dataset 4 (Stability Analysis) |
Dataset 5 (Stability Analysis) |
|
Accuracy |
99.51% ± 0.31 |
99.74% ± 0.03 |
99.80% ± 0.23 |
98.97% ± 0.05 |
99.33% ± 0.20 |
|
Precision |
99.63% ± 0.28 |
99.81% ± 0.07 |
99.84% ± 0.29 |
98.81% ± 0.27 |
99.52% ± 0.33 |
|
Recall |
99.88% ± 0.11 |
99.92% ± 0.09 |
99.95%± 0.06 |
99.16% ± 0.18 |
99.77% ± 0.13 |
|
F1-Score |
99.75% ± 0.16 |
99.86% ± 0.02 |
99.89%± 0.12 |
98.98% ± 0.05 |
99.64% ± 0.11 |
|
ROC-AUC |
98.43% ± 1.62 |
99.05% ± 0.26 |
99.99% ± 0.02 |
99.91% ± 0.04 |
99.60% ± 0.21 |
|
PR-AUC |
99.94% ± 0.07 |
99.96% ± 0.02 |
100% ± 0 |
99.88% ± 0.06 |
99.96% ± 0.02 |
|
MCC |
97.37% ± 0.72 |
95.66% ± 0.51 |
98.31% ± 1.93 |
97.94% ± 0.10 |
94.46% ± 1.76 |
Table 15. Comparison of cyberbullying detection studies
|
No. Ref |
The Purpose of the Study |
Technique Used |
Dataset Type |
Finding and Identifying Features |
The Best Result |
|
[10] |
Lightweight multilingual hate speech detection. |
DDML + XLM-R. |
9 multilingual hate speech datasets, including Twitter Racism and Sexism datasets. |
Contextual transformer features. |
Acc. 93.64%, F1 87.95%. |
|
[11] |
Detect cyberbullying on Twitter. |
HRecRCNN + MFFA. |
4,556 Twitter posts. |
TF-IDF, BoW, N-grams. |
Accuracy 95.0%. |
|
[12] |
Detect online hostility. |
DNN + Word2Vec. |
20,001 English tweets. |
Emotional + Word2Vec features. |
F1-score 97.0%. |
|
[13] |
Bengali cyberbullying detection. |
XLM-RoBERTa. |
2,751 Bengali social media texts. |
TF-IDF, BoW, embeddings. |
Acc. 82.61%, F1 0.83. |
|
[14] |
Detect toxic Hinglish messages. |
RF, SVM, KNN, AdaBoost. |
18,307 Hinglish tweets. |
TF-IDF features. |
RF F1 97.2%. |
|
[15] |
Compare RoBERTa with ML and DL models. |
Fine-tuned RoBERTa. |
48,000 annotated tweets. |
Contextual transformer features. |
Accuracy 83.9%. |
|
[16] |
Detect cyberbullying from images. |
OCR + TF-IDF + ML classifiers. |
160,000 samples from YouTube, Twitter, Wikipedia, and Kaggle. |
OCR-extracted text + TF-IDF. |
Accuracy 96.0%. |
|
[17] |
Compare BERT and CNN-SVM models. |
BERT, CNN-SVM. |
Two benchmark datasets. |
Contextual and CNN-based features. |
BERT Accuracy 97.34%. |
|
[18] |
Develop a real-time explainable detection framework. |
ARFC + GPT-4o-mini. |
15,890 English tweets from X. |
LLM-generated semantic + sentiment features. |
F1-score 90.06%. |
|
[19] |
Improve cyberbullying detection using aggression-enhanced prompts. |
EPP + LoRA + Gemma. |
Five aggression datasets + 47,000 tweets. |
Aggression labels as contextual cues. |
Macro-F1 0.99. |
|
Proposed Study |
Develop an optimized cyberbullying detection framework. |
SMOTE-ENN + NGO + Stacking Ensemble. |
Five benchmark datasets (Twitter, Kaggle, Wikipedia). |
TF-IDF with optimized feature selection and hyperparameter tuning. |
Proposed Study achieved over 5-fold stratified cross-validation produced an F1-score of 99.93% ± 0.06 and an accuracy of 99.88% ± 0.10%, AUC 100%. |
The SMOTE-NGO stacking ensemble successfully and robustly detects cyberbullying on five benchmark datasets. When using SMOTE for class balancing, the NGO approach for automated feature selection and hyperparameter tuning, and stacking ensemble learning, there is a considerable improvement in accuracy, precision, recall, F1-score, ROC-AUC, PR-AUC, and MCC. In order to guarantee reproducibility and minimize random variance, all tests were performed using three fixed random seeds: 42, 123, and 2024. The sum of these runs is what gives us the final output. This approach showed that the proposed framework consistently produces results under different random initializations and enhances model behavior assessment. To identify cyberbullying and decrease model bias toward majority classes, SMOTE created fake minority-class data. By integrating the strengths of many base classifiers and generalizing to diverse social media text data, the stacking ensemble outperformed its competitors on the majority of datasets. To boost performance, NGO automatically adjusted the classifier hyperparameters and picked useful feature subsets. Classifiers trained using RF and SVM yielded the best results after optimization, whereas those trained using Naive Bayes and AdaBoost showed consistent but minor improvements. When comparing the five benchmark datasets, the hold-out test and 5-fold stratified cross-validation analysis revealed that Dataset 3 (Toxicity) fared the best. Results from stability analysis and cross-validation showed that the model had the highest accuracy (99.80%); recall (99.97% ± 0.03); F1-score (99.89% ± 0.06); ROC-AUC (99.99% ± 0.02); PR-AUC (100% ± 0.02); and MCC. These metrics demonstrate that the suggested framework performed well on Dataset 3, with near-perfect prediction accuracy and minimal variability in validation. Results from the dataset were impacted by the intricacy of the data and the distribution of classes. The framework did admirably on the most challenging benchmark, Dataset 4 (racism). Under imbalanced conditions, MCC values ranging from 94.46% to 98.31% confirmed the model's balanced classification. In conclusion, the SMOTE-NGO stacking ensemble demonstrates excellent prediction accuracy, resilience, and generalizability over different cyberbullying datasets, according to stability analysis and cross-validation. The framework's low standard deviation values and numerous random seeds make it reproducible and dependable, making it an ideal choice for cyberbullying detection systems in the real world. In the future, possible applications of this method include investigating adaptive ensemble weighting, detecting multimodal cyberbullying, and combining designs based on transformers and extending the framework to multilingual datasets, cross-platform evaluation, and integration with contextual embedding techniques. In addition, feature selection and hyperparameter optimization were areas where NGO excelled; nevertheless, its performance may vary depending on factors such as population size, iteration number, and random initialization. Computers are more expensive for NGOs than more conventional search methods. Its application with optimization parameters, multilingual corpora, and smaller datasets will be the subject of future study.
The authors would like to thank AL_Mustansiriyah University (www.uomusiriyah.edu.iq), Baghdad-Iraq for its support in the present work.
[1] Arif, M. (2021). A systematic review of machine learning algorithms in cyberbullying detection: Future directions and challenges. Journal of Information Security and Cybercrimes Research, 4(1): 1-26. https://doi.org/10.26735/GBTV9013
[2] Akhter, A., Acharjee, U.K., Talukder, M.A., Islam, M.M., Uddin, M.A. (2023). A robust hybrid machine learning model for Bengali cyber bullying detection in social media. Natural Language Processing Journal, 4: 100027. https://doi.org/10.1016/j.nlp.2023.100027
[3] Barlett, C.P., Simmers, M.M., Roth, B., Gentile, D. (2021). Comparing cyberbullying prevalence and process before and during the COVID-19 pandemic. The Journal of Social Psychology, 161(4): 408-418. https://doi.org/10.1080/00224545.2021.1918619
[4] Sifath, S., Islam, T., Erfan, M., Dey, S.K., Islam, M.M.U., Samsuddoha, M., Rahman, T. (2024). Recurrent neural network based multiclass cyber bullying classification. Natural Language Processing Journal, 9: 100111. https://doi.org/10.1016/j.nlp.2024.100111
[5] Zhu, C., Huang, S., Evans, R., Zhang, W. (2021). Cyberbullying among adolescents and children: A comprehensive review of the global situation, risk factors, and preventive measures. Frontiers in Public Health, 9: 634909. https://doi.org/10.3389/fpubh.2021.634909
[6] Peled, Y. (2019). Cyberbullying and its influence on academic, social, and emotional development of undergraduate students. Heliyon, 5(3): e01393. https://doi.org/10.1016/j.heliyon.2019.e01393
[7] Alanazi, I., Alves-Foss, J. (2020). Cyber bullying and machine learning: A survey. International Journal of Computer Science and Information Security, 18(10): 1-8. https://doi.org/10.5281/zenodo.4249340
[8] Haidar, B., Chamoun, M., Yamout, F. (2016). Cyberbullying detection: A survey on multilingual techniques. In 2016 European Modelling Symposium (EMS), Pisa, Italy, pp. 165-171. https://doi.org/10.1109/EMS.2016.037
[9] Tyagi, P., Singh, J., Gosain, A. (2024). Whale optimization-based synthetic minority oversampling technique for binary imbalanced datasets. Procedia Computer Science, 235: 250-263. https://doi.org/10.1016/j.procs.2024.04.027
[10] Liu, Z., Shao, Z., Wang, H., Li, B. (2025). DDML: Multi-student knowledge distillation for hate speech. Entropy, 27(4): 417. https://doi.org/10.3390/e27040417
[11] Sherly, T., Jeetha, B. (2021). Sentiment analysis and deep learning based cyber bullying detection in twitter dataset. International Journal of Recent Technology and Engineering, 10(4): 15-25. https://doi.org/10.35940/ijrte.D6511.1110421
[12] Khan, U., Khan, S., Rizwan, A., Atteia, G., Jamjoom, M.M., Samee, N.A. (2022). Aggression detection in social media from textual data using deep learning models. Applied Sciences, 12(10): 5083. https://doi.org/10.3390/app12105083
[13] Sihab-Us-Sakib, S., Rahman, M.R., Forhad, M.S.A., Aziz, M.A. (2024). Cyberbullying detection of resource constrained language from social media using transformer-based approach. Natural Language Processing Journal, 9: 100104. https://doi.org/10.1016/j.nlp.2024.100104
[14] Shah, K., Phadtare, C., Rajpara, K. (2022). Cyber-bullying detection in Hinglish languages using machine learning. International Journal of Engineering Research and Technology, 11(5): 439-443. https://doi.org/10.17577/IJERTV11IS050318
[15] Hannan Bin Azhar, M.A., Runa, A.A. (2023). Enhancing cyberbullying detection with RoBERTa: A transformer-based approach. In International Conference on Global Security, Safety, and Sustainability, London, UK, pp. 301-315. https://doi.org/10.1007/978-3-031-82031-1_16
[16] Sultan, T., Jahan, N., Basak, R., Jony, M.S.A., Nabil, R.H. (2023). Machine learning in cyberbullying detection from social-media image or screenshot with optical character recognition. International Journal of Intelligent Systems and Applications, 15(2): 1-13. https://doi.org/10.5815/ijisa.2023.02.01
[17] Saini, H., Mehra, H., Rani, R., Jaiswal, G., Sharma, A., Dev, A. (2023). Enhancing cyberbullying detection: A comparative study of ensemble CNN–SVM and BERT models. Social Network Analysis and Mining, 14(1): 1. https://doi.org/10.1007/s13278-023-01158-w
[18] García-Méndez, S., Arriba-Pérez, F. (2024). Promoting security and trust on social networks: Explainable cyberbullying detection using large language models in a stream-based machine learning framework. In 2024 11th International Conference on Social Networks Analysis, Management and Security (SNAMS), Gran Canaria, Spain, pp. 25-32. https://doi.org/10.1109/SNAMS64316.2024.10883785
[19] Saeid, A., Sabu, A., Koushik, G., Neri, F., Kanojia, D. (2025). Cyberbullying detection via aggression-enhanced prompting. In Proceedings of the 15th International Conference on Recent Advances in Natural Language Processing, Varna, Bulgaria, pp. 1044-1052. https://doi.org/10.48550/arXiv.2508.06360
[20] Elsafoury, F. (2020). Cyberbullying datasets (Version 1). Mendeley Data. https://www.kaggle.com/datasets/saurabhshahane/cyberbullying-dataset.
[21] Tan, P., Steinbach, M., Karpatne, A., Kumar, V. (2019). Introduction to Data Mining (2nd ed.). Pearson. https://lccn.loc.gov/2017048641.
[22] Bai, Z., Sunitha, Z., Malempati, S. (2023). Ensemble deep learning (EDL) for cyberbullying on social media. International Journal of Advanced Computer Science and Applications, 14(7): 551-560. https://doi.org/10.14569/IJACSA.2023.0140761
[23] Kowsari, K., Jafari Meimandi, K., Heidarysafa, M., Mendu, S., Barnes, L., Brown, D. (2019). Text classification algorithms: A survey. Information, 10(4): 150. https://doi.org/10.3390/info10040150
[24] Al-Anzi, F.S., AbuZeina, D. (2017). Toward an enhanced Arabic text classification using cosine similarity and latent semantic indexing. Journal of King Saud University – Computer and Information Sciences, 29(2): 189-195. https://doi.org/10.1016/j.jksuci.2016.04.001
[25] Kalra, V., Aggarwal, R. (2019). Importance of text data preprocessing and implementation in RapidMiner. In Proceedings of the 2017 International Conference on Information Technology and Knowledge Management, New Delhi, India, 14: 71-75. https://doi.org/10.15439/2017KM46
[26] Salman, Z.A.W. (2023). Text summarizing and clustering using data mining technique. Al-Mustansiriyah Journal of Science, 34(1): 58-64. https://doi.org/10.23851/mjs.v34i1.1195
[27] Barua, A., Sharif, O., Hoque, M.M. (2021). Multi-class sports news categorization using machine learning techniques: Resource creation and evaluation. Procedia Computer Science, 193: 112-121. https://doi.org/10.1016/j.procs.2021.11.002
[28] Abdalrdha, Z.K., Al-Bakry, A.M., Farhan, A.K. (2024). Crimes tweet detection based on CNN hyperparameter optimization using snake optimizer. In New Trends in Information and Communications Technology Applications, Baghdad, Iraq, 2096: 207-222. https://doi.org/10.1007/978-3-031-62814-6_15
[29] Dehghani, M., Hubálovský, Š., Trojovský, P. (2021). Northern goshawk optimization: A new swarm-based algorithm for solving optimization problems. IEEE Access, 9: 162059-162080. https://doi.org/10.1109/ACCESS.2021.3133286
[30] Al-Obaidi, S.A. (2024). Automated fake news detection system. Iraqi Journal for Computer Science and Mathematics, 5(4): 2. https://doi.org/10.52866/2788-7421.1200
[31] Chengsheng, T., Huacheng, L., Bing, X. (2017). AdaBoost typical algorithm and its application research. MATEC Web of Conferences, 139: 00222. https://doi.org/10.1051/matecconf/201713900222
[32] Bhaumik, S., Chattopadhyaya, A., Bera, J.N. (2025). Detection and classification of faults in renewable energy penetrated stand-alone microgrids using SVM and DWT techniques. Electric Power Systems Research, 245: 111634. https://doi.org/10.1016/j.epsr.2025.111634
[33] Han, X., Wang, J., Wu, Z., Li, G., Wu, Y., Li, J. (2018). Learning solutions to two-dimensional electromagnetic equations using LS-SVM. Neurocomputing, 317: 15-27. https://doi.org/10.1016/j.neucom.2018.05.035
[34] Ramachandra, A.C., Mohammed, R., Kumthekar, P.S. (2023). Support vector machine implementation to separate linear and nonlinear dataset. Saudi Journal of Engineering and Technology, 8(1): 4-15. https://doi.org/10.36348/sjet.2023.v08i01.002
[35] Yuslee, N.S., Abdullah, N.A.S. (2021). Fake news detection using Naive Bayes. In 2021 11th IEEE International Conference on System Engineering and Technology (ICSET), Shah Alam, Malaysia, pp. 112-117. https://doi.org/10.1109/ICSET53708.2021.9612540
[36] Abdalrdha, Z.K., Kadhim, A.A., Kadum, A., Naser, W.A.K. (2025). Enhancing fake news detection via PSO-optimized ensemble learning: A comparative study of SVM, NB, and RF. Ingénierie des Systèmes d’Information, 30(6): 1629-1638. https://doi.org/10.18280/isi.300621
[37] Hameed, M., Abdullah, M.Z., Jassim, A.K., Al Khalidy, M.M. (2024). A hybrid for analyzing text streaming using data mining and machine learning techniques. Journal of Engineering and Sustainable Development, 28(5): 675-680. https://doi.org/10.31272/jeasd.28.5.13
[38] Tafvizi, A., Avci, B., Sundararajan, M. (2022). Attributing AUC-ROC to analyze binary classifier performance. arXiv preprint arXiv:2205.11781. https://doi.org/10.48550/arXiv.2205.11781
[39] Chicco, D., Jurman, G. (2020). The advantages of the Matthews correlation coefficient (MCC) over F1 score and accuracy in binary classification evaluation. BMC Genomics, 21: 6. https://doi.org/10.1186/s12864-019-6413-7